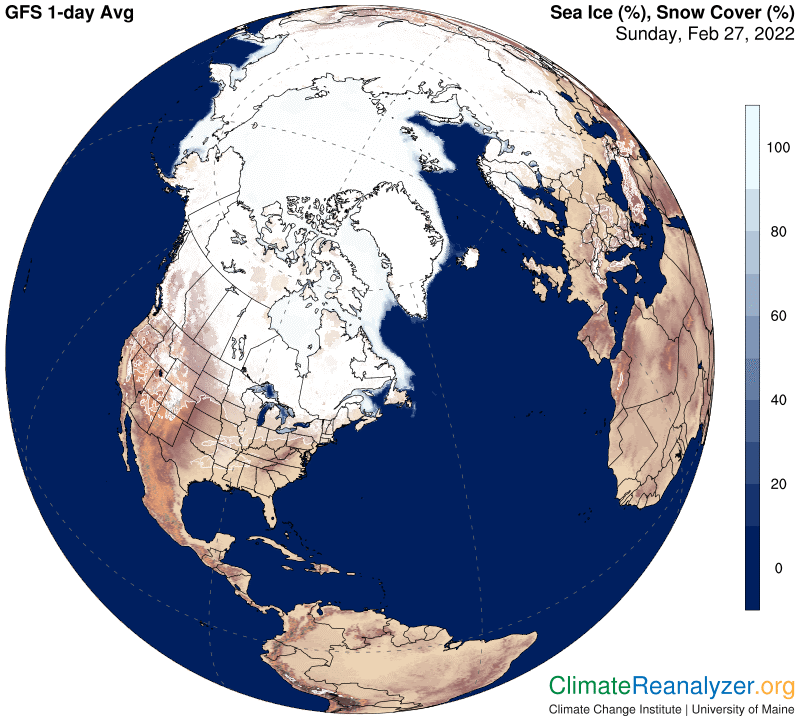
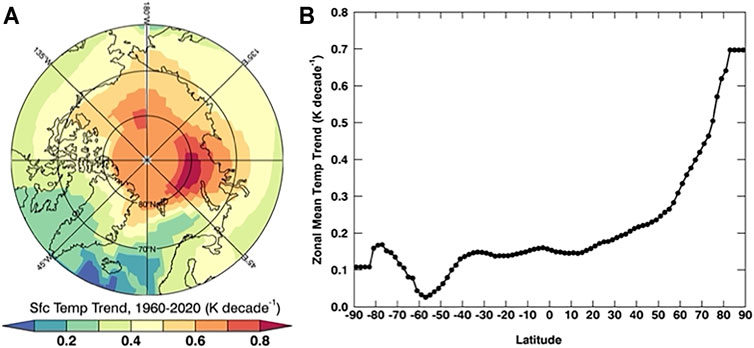
For at least the last 800,000 years it is an established fact that whenever the Earth was engaged in a prolonged period of global warming the Arctic region was likely to warm up two or three times more than the globe as a whole. The usual kind of warming conditions are in effect today, and the result is just as true today as it ever was, if not more so, based on measurements that have well-confirmed accuracy. Scientist want to know the complete reason for the amplified comparison, understanding that it is most likely complicated. I believe whatever is involved as a cause must have a stronger effect in the Arctic than anywhere else. The summer melting of sea ice that covers the Arctic Ocean quickly comes to mind, and is well-established as a cause, but can’t possibly one that is appropriate for telling the whole story. Most notably, during the cold season of the year, when the Arctic region is both very cold and very dark, there is minimal change in sea ice cover from one day to the next—and yet we are now seeing signs of powerful Arctic Amplification being extraordinarily effective on a numbers of individual days during this period. The last two days, as illustrated in these letters, provide a perfect example. How can this be so?
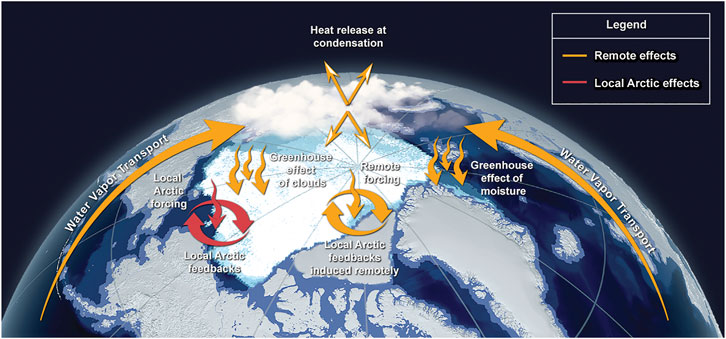
Whatever is causing these aberrations must first of all be characterized by having an ability to do the job, and next by having something irregular about its nature. By the latter I mean that on some days this agency will be ready and willing to do the job and on other days it will not. That doesn’t leave much wiggle room for choosing prospects. Moreover, the same prospect may be required to exude some of the same properties later on, during the warm season of the year, and perhaps also during eras when incoming solar radiation has taken a radically different course from that of today, as depicted by Milankovitch cycles. I am convinced that only one prospect is available which can meet all of these tests, and that is precipitable water (PW), transported over the Arctic atmosphere by atmospheric rivers (ARs) that come and go in an irregular way. What I have in mind for these letters is a project that can determine how well this choice performs on a daily basis, starting now and extending into the immediate future for as long as it takes to resolve any open questions.
AA exists in the form of a temperature anomaly of a rather ordinary sort. The anomaly is usually composed of temperature averages over a full month, compared with averages for the same month during an extended historical baseline period, or else for the comparison of seasons made up of several months, or the same for a full year, or possibly the average of several years. Individual days are less useful for drawing broad conclusions, and thus given little attention, because of their high level of irregularity. Any one day can never be dependable as an indicator, and yet each day has value if it helps to explain the formation of a longer lasting trend. When irregularity is a key ingredient in the makeup of a trend, it seems that the analysis of daily anomalies actually becomes indispensable. There is simply no better way to dig into the true effects of PW, a substance that is constantly on the move and changing concentration while engaged on its brief, high-altitude journeys.
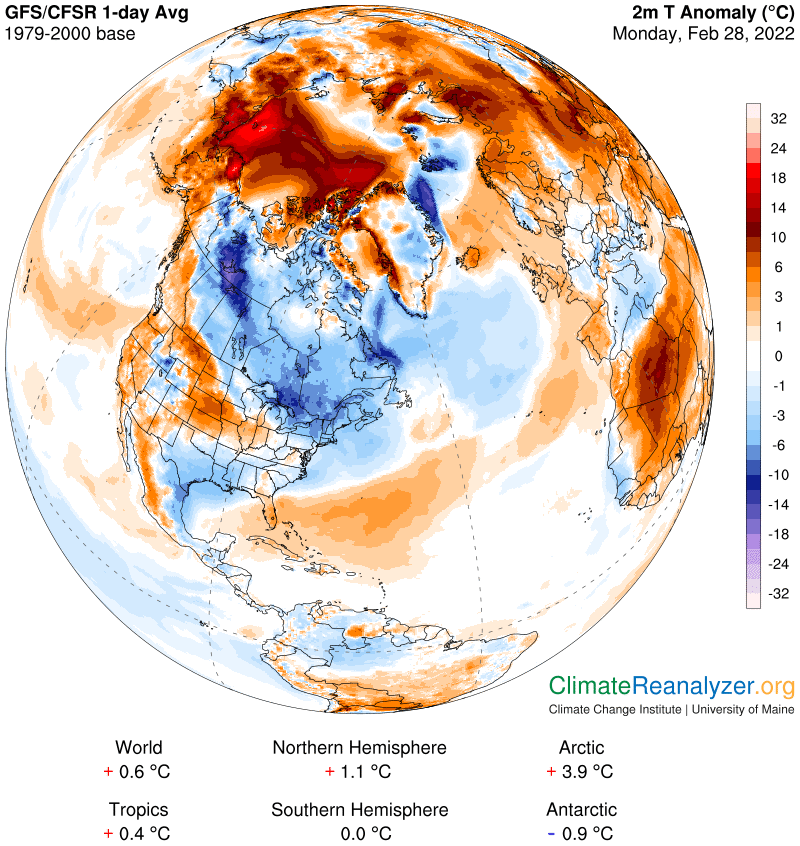
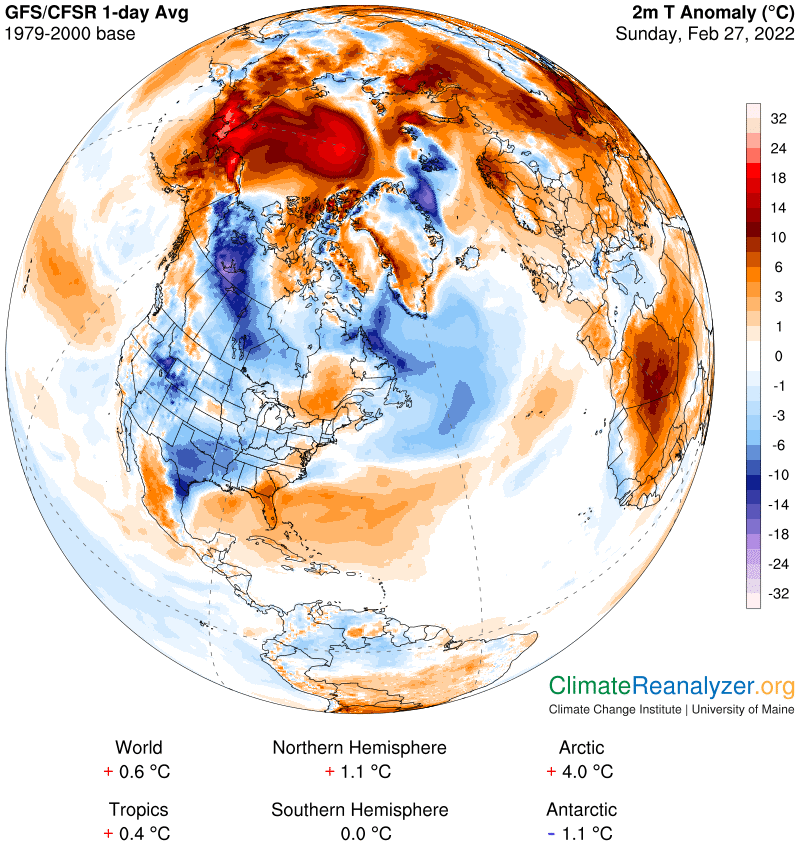
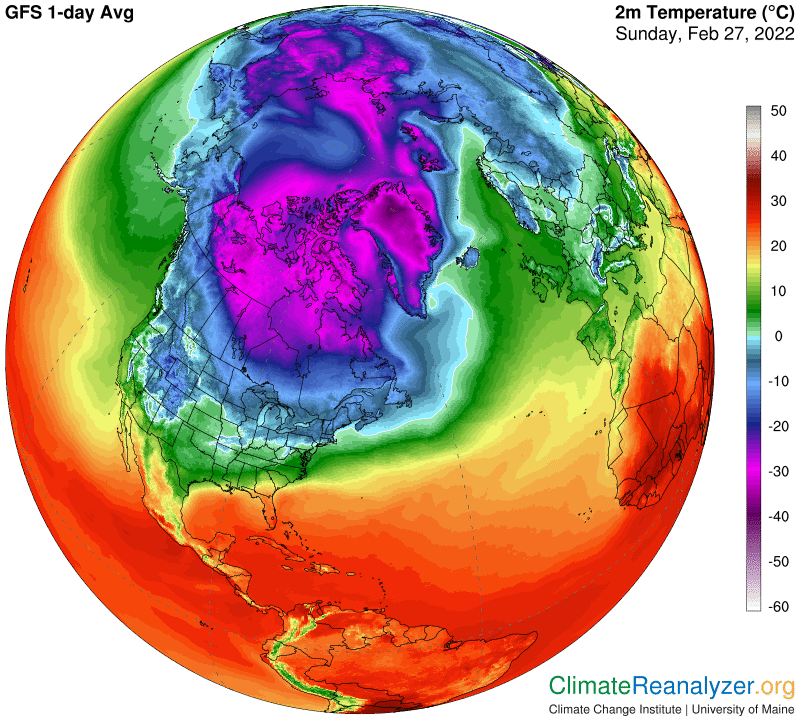
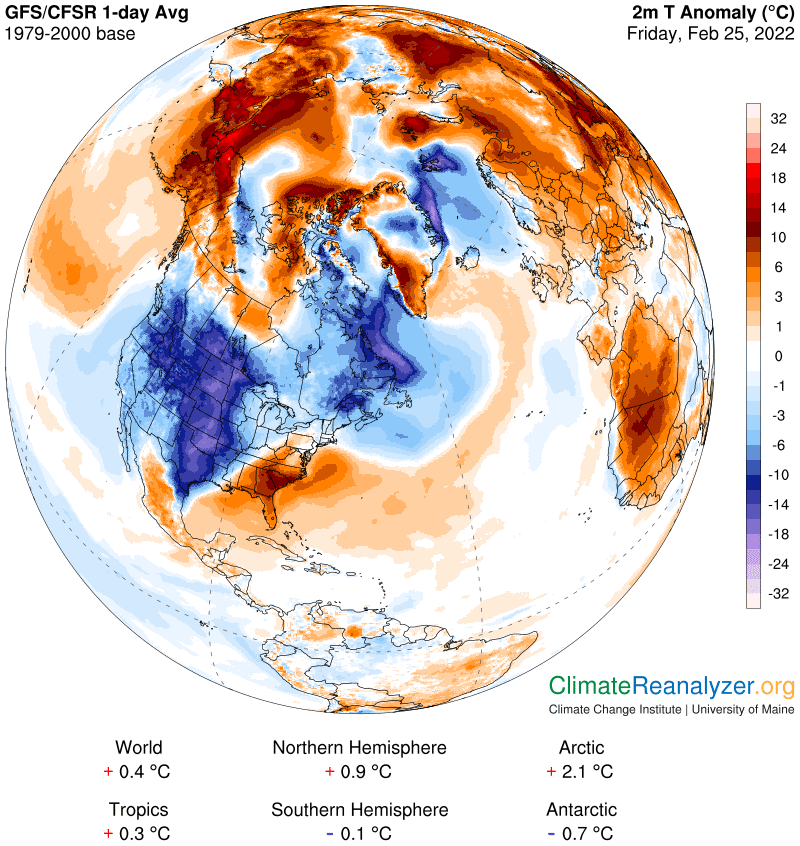
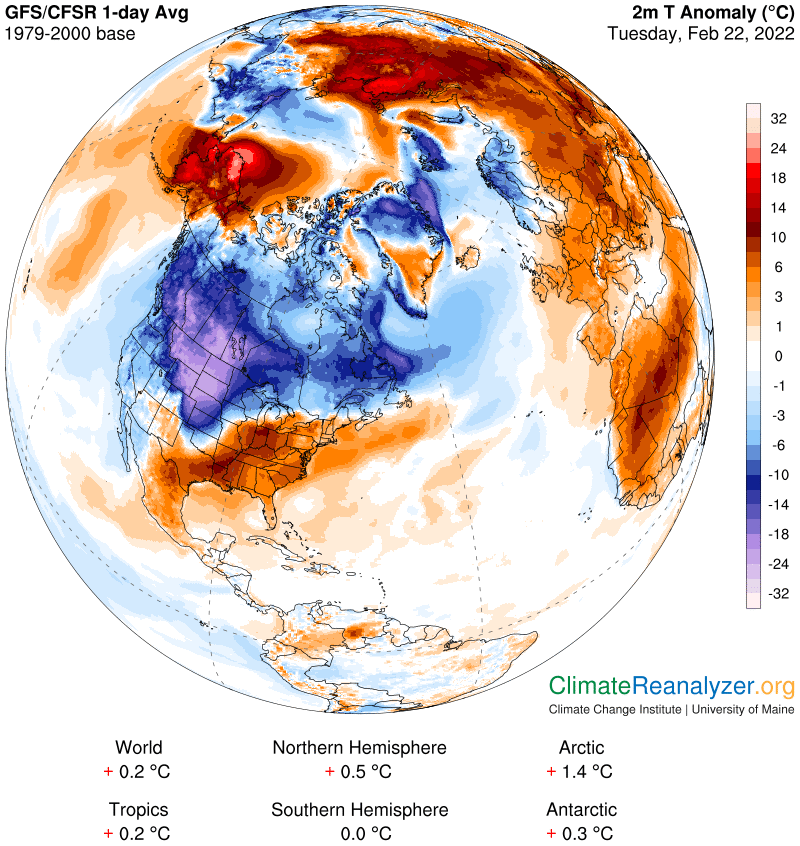
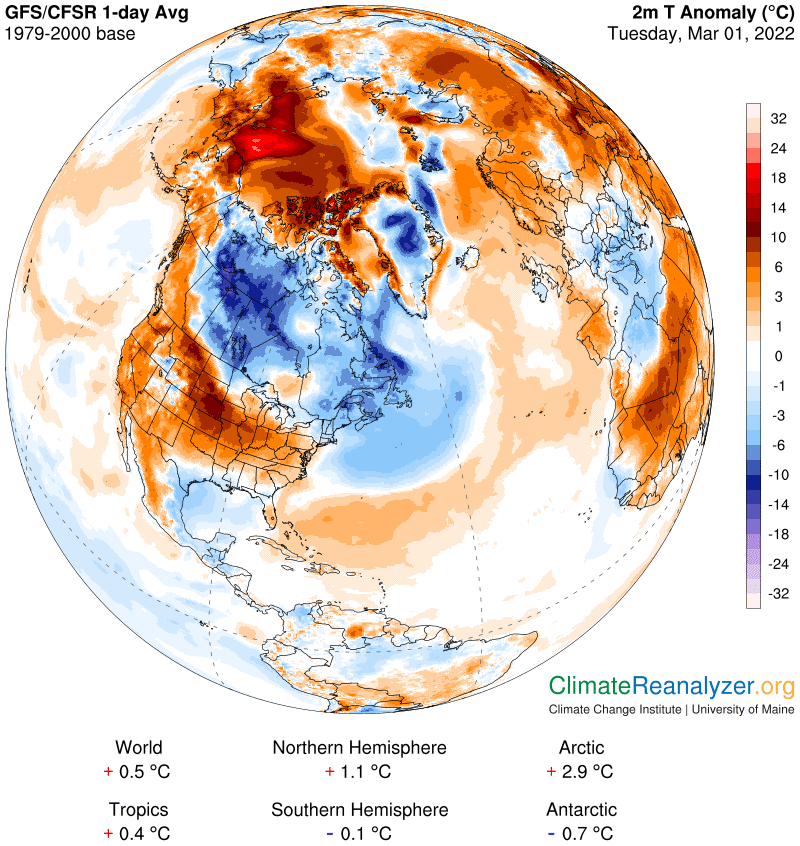
Today’s anomaly map reveals Arctic numbers that have backed off a little from the extremes of the previous two days but a relative warming of 2.9C is still six times greater than the global average for the day, and nearly three times the average of the NH. The latter, in turn, is double the global average, because the whole SH is just a big zero. With respect to current trends, I believe the Arctic number is the most irregular of all today. That’s something we will want to keep track of. Incidentally, the tropical zone anomaly rarely shows anything more than a slight amount of irregularity on the daily chart. My guess is that this is because there are virtually no ARs at work in the overhead skies, virtually no significant change in overhead PW values from day to day, and nothing else taking effect in the ‘irregular’ category.
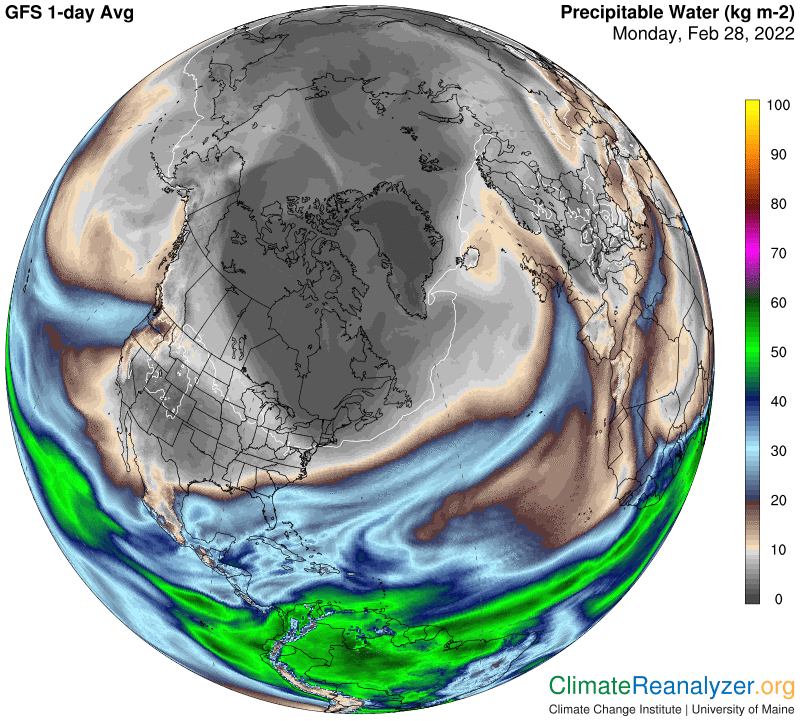
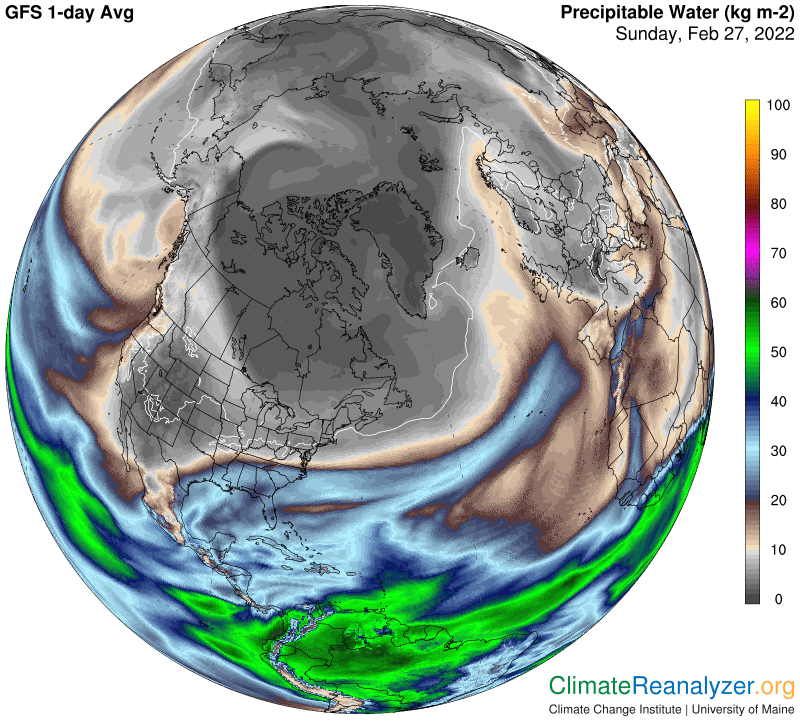
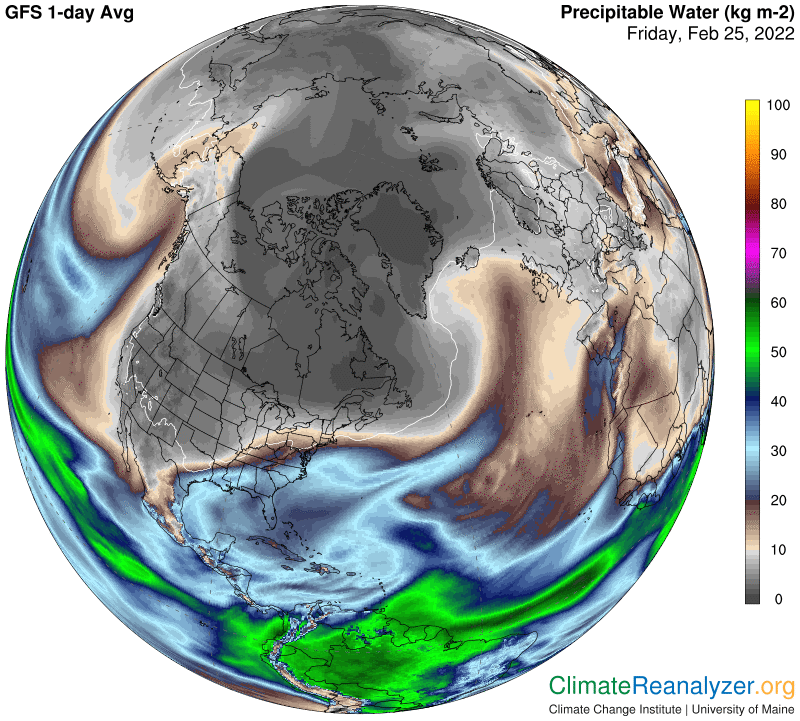
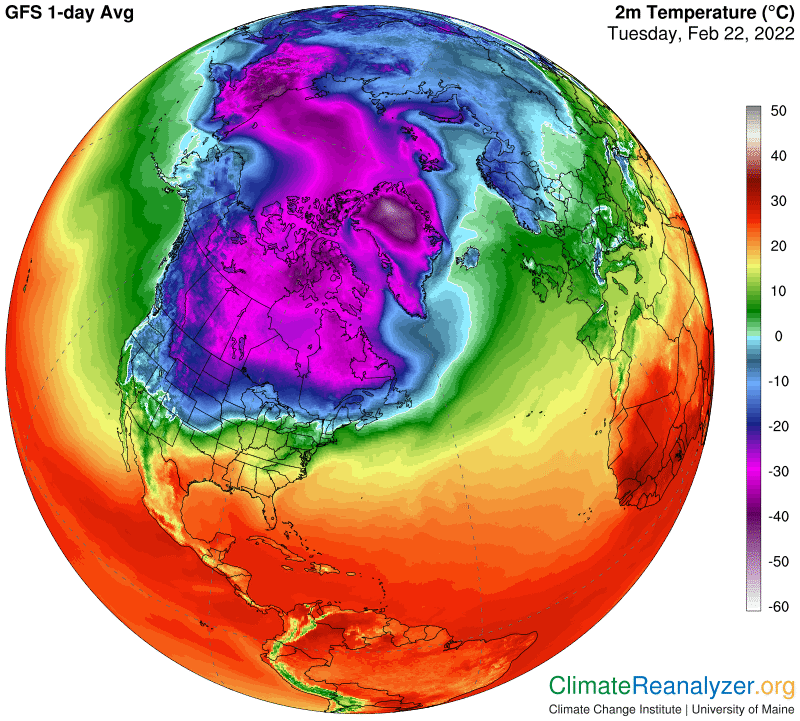
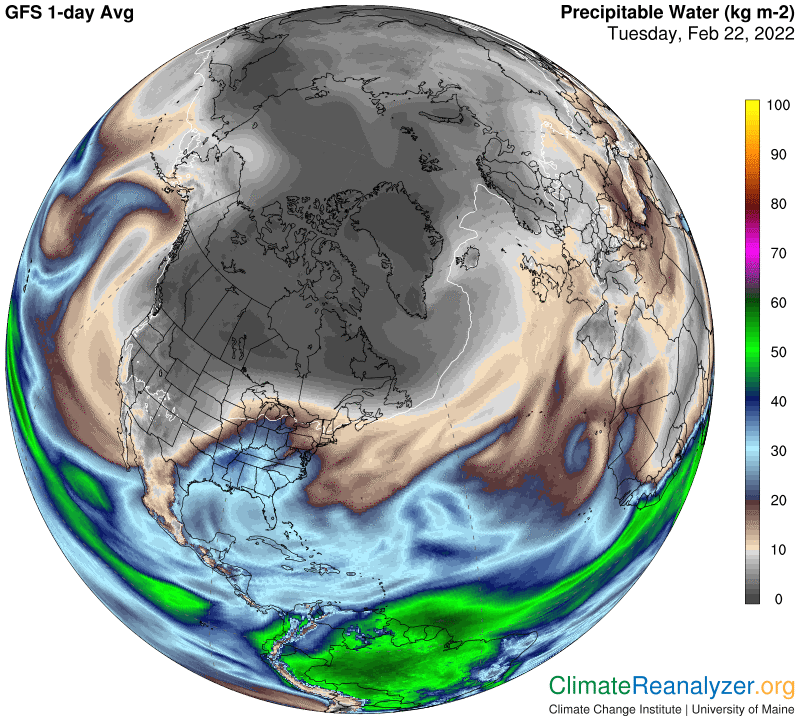
The one big anomaly zone is still fairly intact from yesterday, and still strong enough to command a high total. Once again, the PW map informs us that the source of this large anomaly is dependent on the PW contents being introduced by a pair of ARs that originated in the central Pacific. Reduced amounts of this PW has worked its way right up to the pole again, enabling an anomaly of about +3C. If you use plenty of magnification you will find two spots of peak warmth in the 21-24C bracket back toward the Bering Strait, where the PW value is 5-6kg.
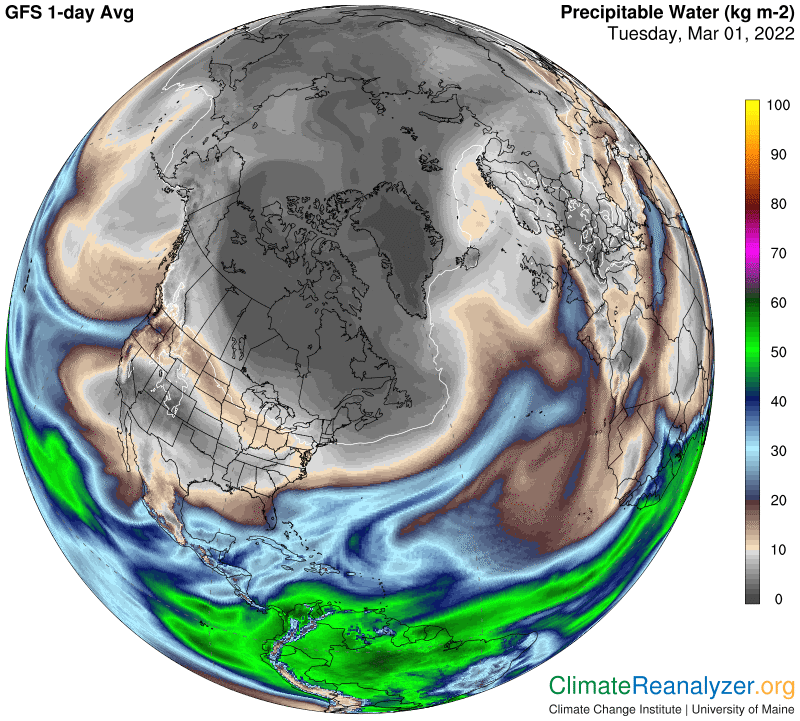
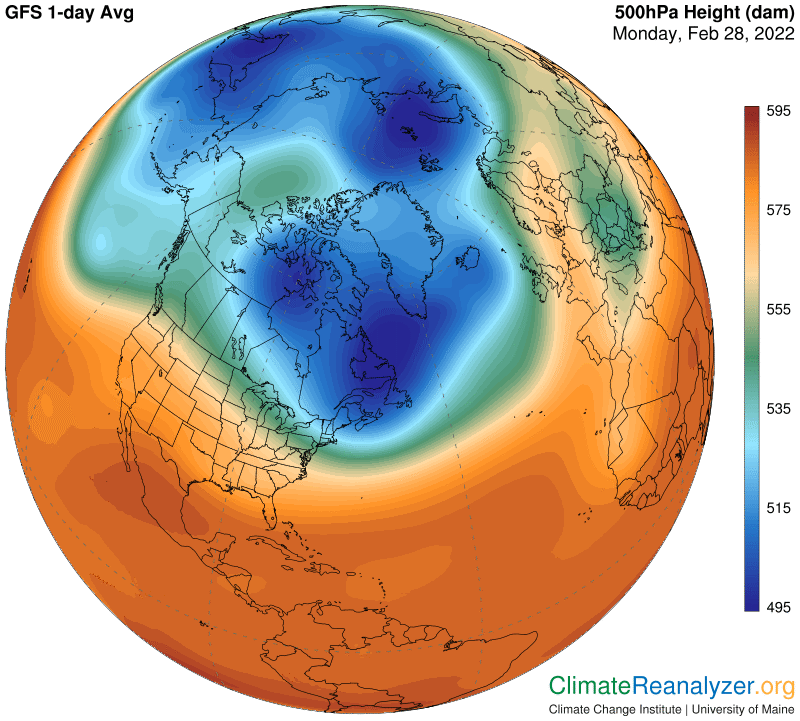
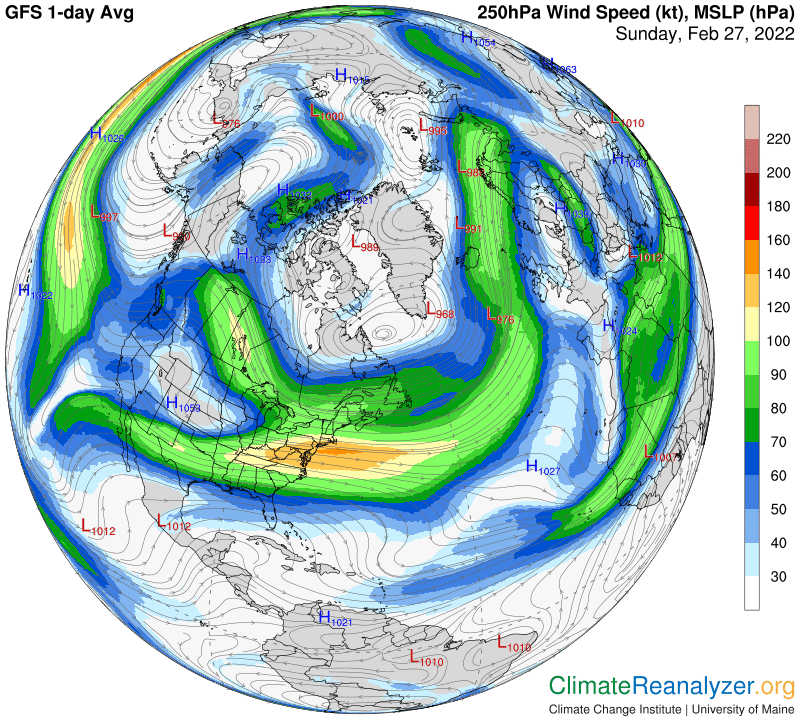
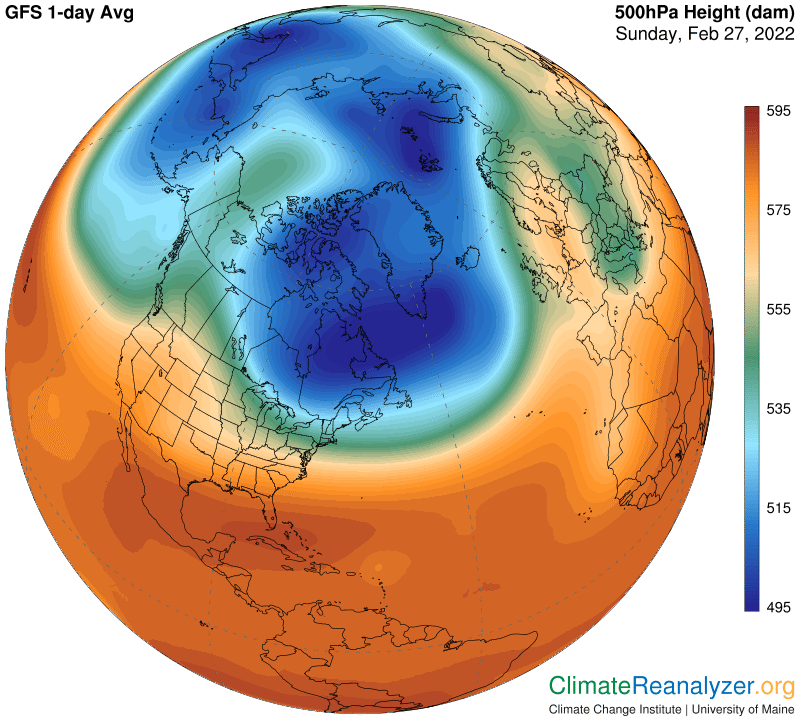
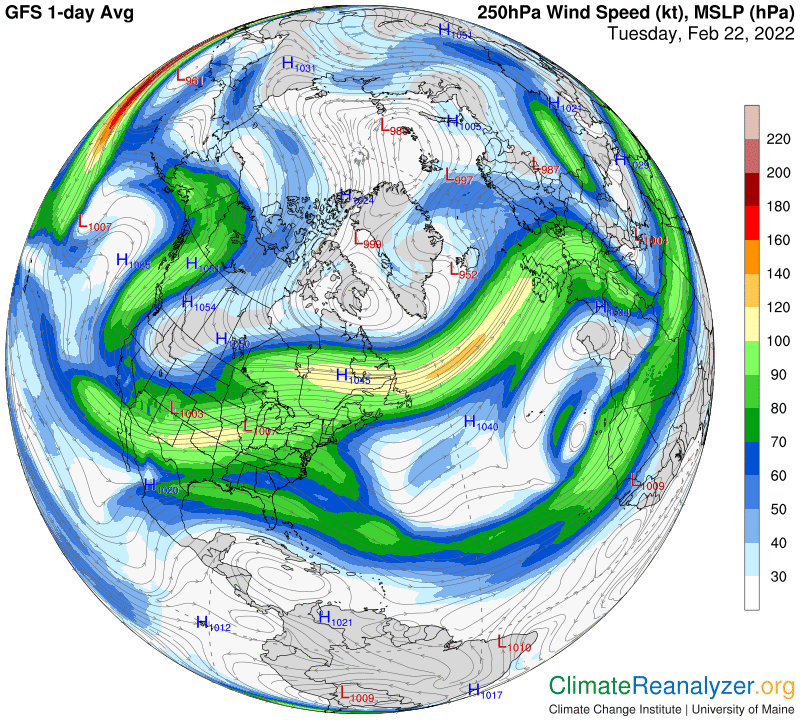
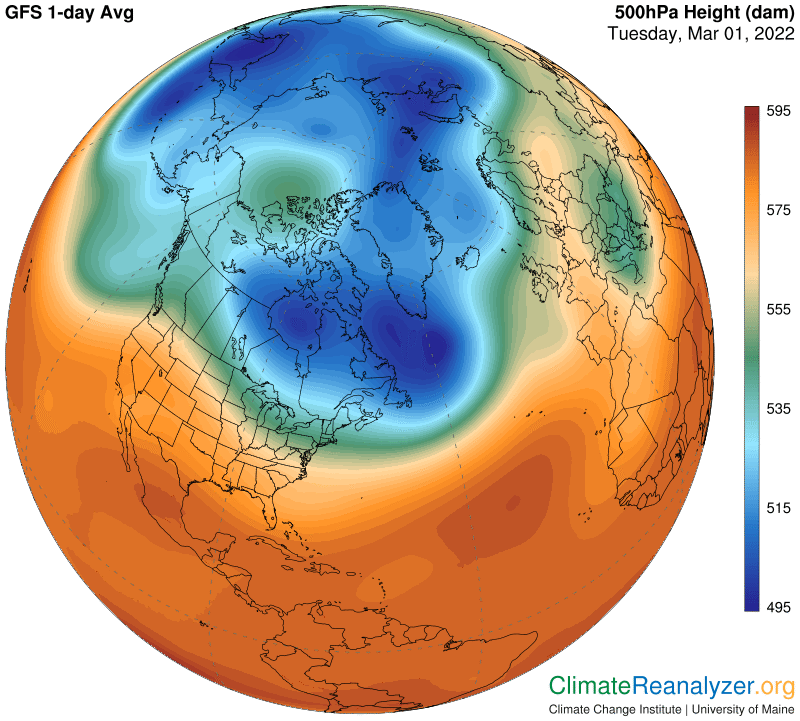
The gradients in the air pressure configuration map remain favorably positioned for enabling deep PW penetration in this part of the region:
Carl