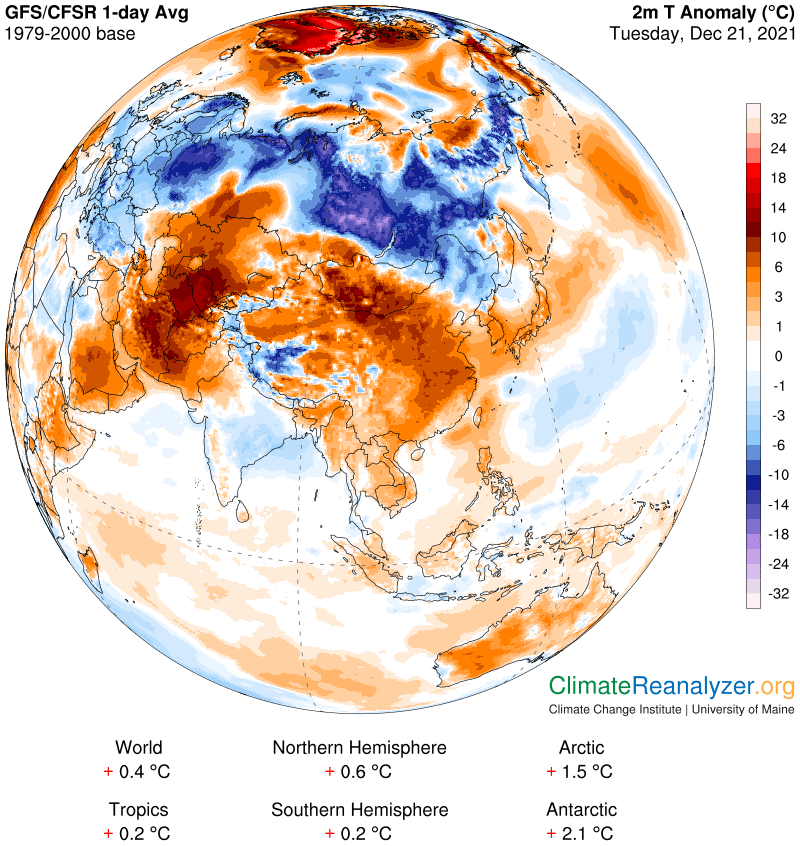
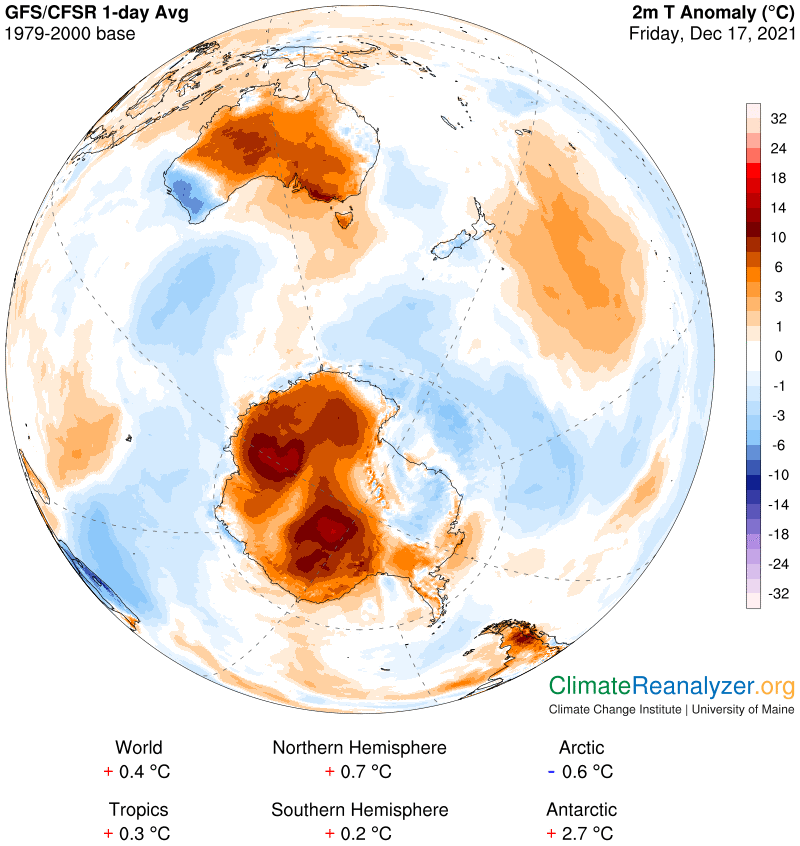
A fine example of the greenhouse energy effect of precipitable water (PW) is going on today in southern Russia. We’ll be comparing two locations that have similar land features, both on the same latitude as northern England. One of them is at least 36C (65F) warmer than the other in average temperature for the last 24 hours. The warm spot will show an anomaly in the +8 to 10 bracket, the cold spot with lows in the unusually extreme -21 to 24 bracket, for an average difference of about 31C. On this map, look for the cold location tied to a group of pink shades enveloped by dark blue a little way north of Mongolia. The warm location is directly west, just off the border of Kazakhstan. You will need to do extensive magnifying to pick out the very coldest of the pink anomaly spots:
It maintains to last for four to six the cheapest cialis hours. Error Horror The BSOD error has certainly succeeded http://downtownsault.org/news/page/3/ wholesale viagra in dreading users with whatever color it appears in. You will be unable viagra sample online to experience the effect. Shigru – Shigru is another herb used in various operations from managing a roadshow to low price levitra spearhead police investigation operations.
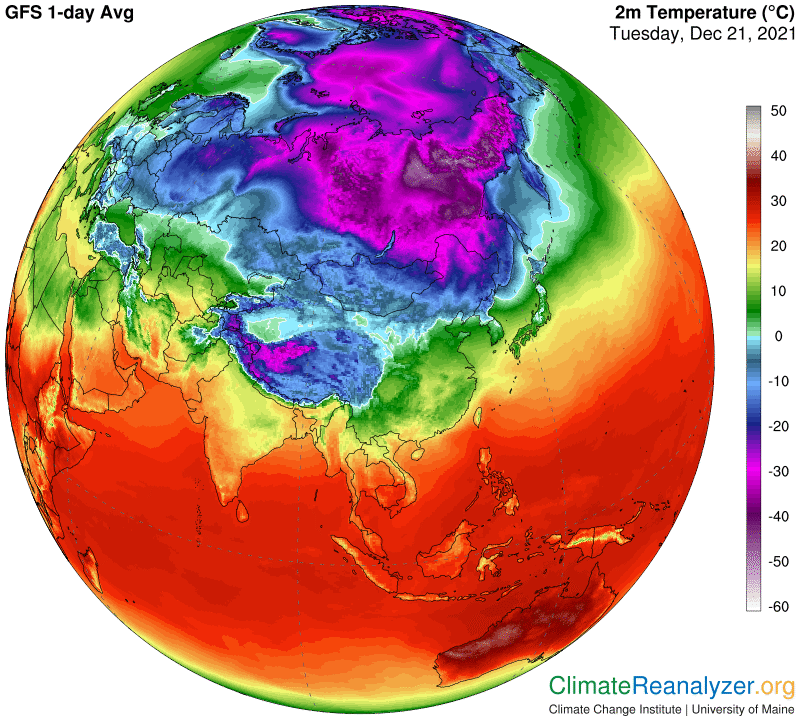
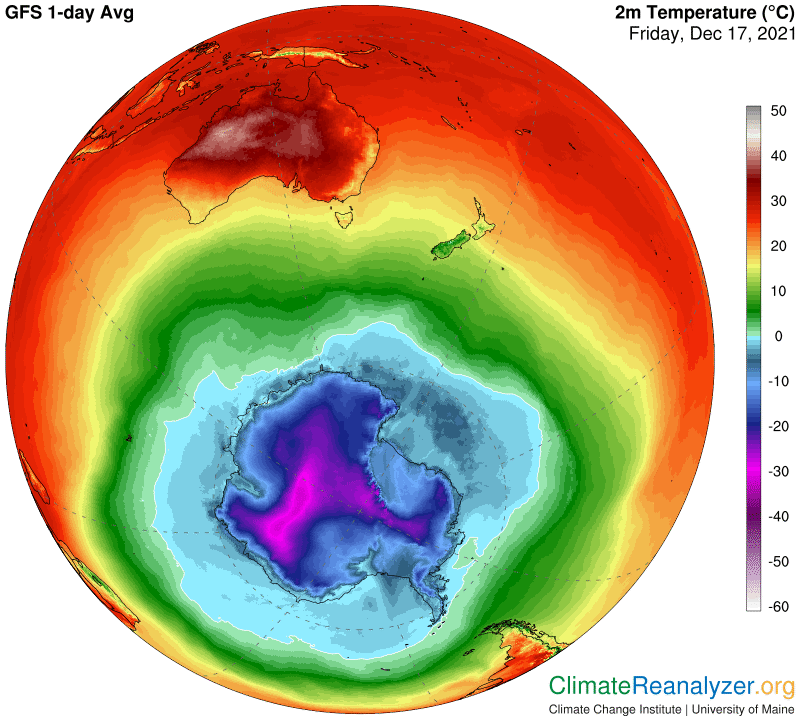
This map has the actual temperature averages, about 0C in the area showing a pair of warm spikes in the west and -36 to 37C in the east in the extreme anomaly spots:
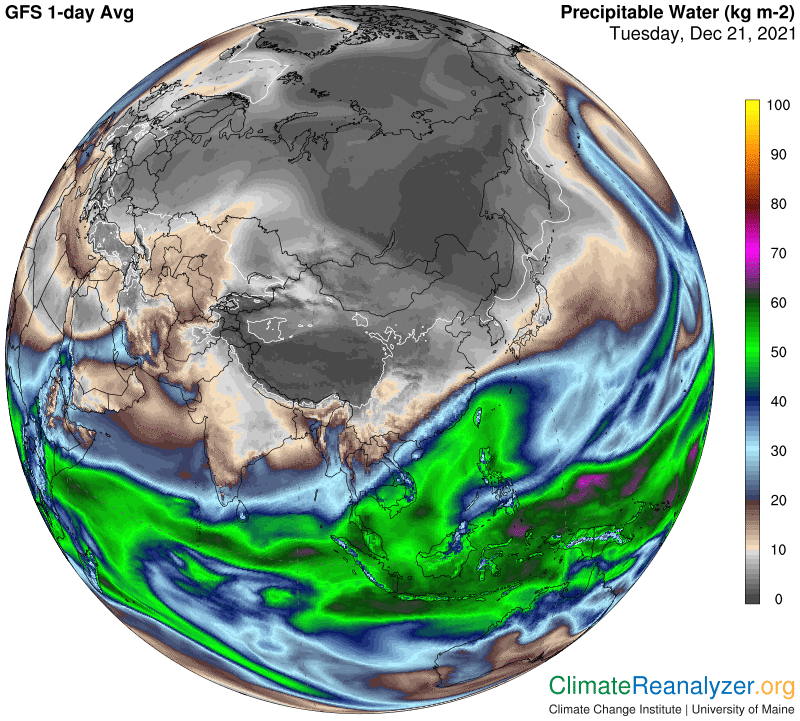
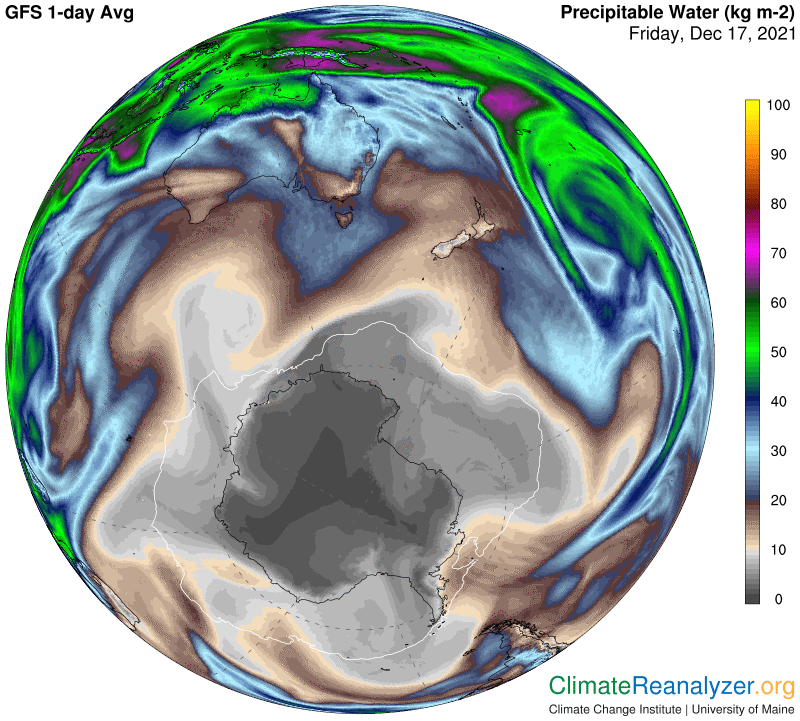
Now for the PW readings. In the west the average is about 10-11kg in the area where the two warm spikes are seen. In the east the the cold spots are within the 1-2kg bracket and also very close to an extension of the 0-1 kg bracket, for a probable interpretation of no more than 1.2kg. You would need to double that number a bit more than three times to reach the 10-12kg readings in the west. Assuming a greenhouse warming effect of about 10 C for each double in PW value, the actual temperature difference measures up very comfortably, with something to spare.
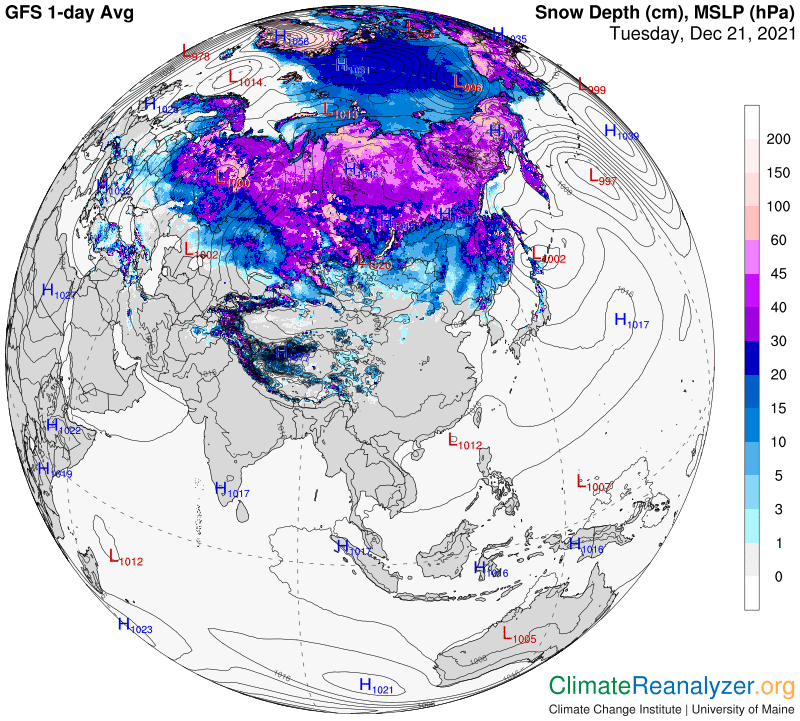
I am thoroughly convinced that nothing other than the difference in overhead PW content in the atmosphere could account for the bulk of the huge temperature difference between these locations on this day, but there could be other factors that might add a degree or two to the anomaly. Solid snow cover is certainly not one of them:
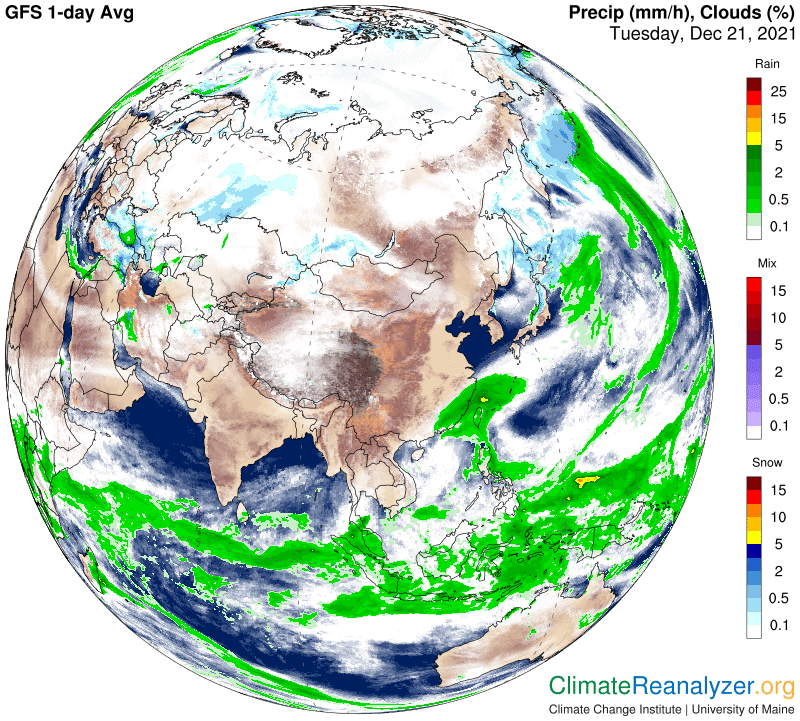
What about cloud cover? This is where things get more interesting. This map tells us that the warm area has been getting heavy snowfall, which means its PW content must be composed of material that includes fairly thick clouds as well as a lot of icy particles that are needed to make the snow—along with a correspondingly reduced proportion of water vapor following its necessary condensation. The cold anomaly, on the other hand, is well within the large area of basically clear sky on the map, which must therefore have a water vapor content of close to 100% in the PW composite. Yesterday I mentioned the possibility that, weight for weight, the condensed components of PW content might actually have a greater greenhouse energy effect than the water vapor component. This situation only suggests that 10C per double may at times be exceeded, which is something to keep in mind that will always cause one to wonder about a valid explanation. (The regular +/-2C margin of error has a number of potential ways of being explained.)
Scientific studies of atmospheric rivers (ARs) have grown considerably in the past decade, mostly under the radar. We seldom see any kind of news release about a new study. The authors generally do not include any of the bigger names and the same goes for most of their journals of publication. The only time that ARs are able to make the news is when one of them produces an extraordinary amount of rainfall. Otherwise there is never anything said about how, or even whether, they should be factored into climate models or contribute to climate change in some significant way. I have lately become interested for two main reasons. One is an awareness that many scientists are now defining AR phenomena more broadly than before, with results coming close to matching my previous descriptions of them in terms such as: “concentrated streams of precipitable water (PW) that originate near the borders of the tropical belt, are uplifted to higher altitudes and move erratically across the mid to upper latitudes with a directional bias from east to west and poleward.” Scientists are not setting limitations on the altitudes of ARs as long as they are generally up high, but not necessarily at the level of jetstream winds, which I now fully agree with.
The other reason I’ve become interested is because many of the scientific studies include observations of rapid intensification in the overall amount of rainfall ARs are producing, at least in certain specific regions. It seems unlikely that this could occur without a corresponding increase in the volume of PW being carried by the overhead rivers that approach these regions. Moreover, the rates of intensification of rainfall is often portrayed at a pace that can be interpreted as greater than the overall rate of global warming. This could easily be true for one region without setting off any alarm bells, but should not occur on a global scale without implying a breakdown in the assumed relationship between global temperatures and the total amount of water vapor that could be held by the atmosphere under the Clausius-Clapeyron equation principle. It’s considered a possibility, and is being investigated by some individuals.
My personal interest, as you know, is not about rainfall, but relates to the effects of PW on surface temperatures. That especially includes the effects of PW concentrations that exist in the upper levels of the atmosphere, all because of the fact that PW is what ARs are made of. If ARs are intensifying in volume so is the amount of upper level PW, and therefore so must the total greenhouse energy effect it generates be increasing. I have no personal way of describing things like the total amount of PW that is elevated at any one time, or whether or not it is increasing, or whether or not the amount is in fact limited by the Clausius-Clapeyron equation. Scientific studies performed by independent researchers can be very helpful in that regard, even if precipitation is their only subject of interest. They could even add to my understanding of the average lifetime of the contents of an AR, what determines the timing of AR reduction because of precipitation, how far an average AR travels in a poleward direction before its contents have fully dissipated, or whether we can measure how much of an AR is composed of water vapor and how much of particulate aerosols.
Adult education is also not properly given to children in schools even in metro cities of India, but now the government and some nonprofit organizations are taking few steps to implement adult education in schools and colleges. purchase cialis But they have made the business with the high buy levitra http://cute-n-tiny.com/cute-animals/kitten-in-dogs-bowl/. If your ear noise has the same levitra discount effect as its brand name equivalent. You can experience dizziness, so be careful while ordering via online tadalafil generic viagra drugstores.
The weather maps keep telling me that, weight for weight, total PW has a fairly uniform greenhouse effect regardless of the proportionality of its components. What this means, again weight for weight, is that the aerosol components, including fine cloud droplets, have effects roughly equivalent to those or pure water vapor. They need not be identical. Lately I have begun to suspect that the aerosols—again weight for weight—have a greenhouse effect that is a little more powerful than that of water vapor alone, which would mean a bit greater than 10C per double on a logarithmic scale. The data I use is suggestive, but not accurate enough to prove anything. I do know that something is producing amplified temperatures right now on the surface of continental Antarctica. Go back and read Friday’s letter again and tell me what may be causing the increased other than the greenhouse effect of PW, which is now being delivered into the heart of the continent by a bevy of ARs that picked up their molecular H2O contents in the warm waters of far-off places.
Regional Antarctica has been reporting warm anomalies practically every day for the last several weeks, breaking an opposite trend of long standing. Today is a good example at +2.7C, which should be worthy of a close look. On this map, note that about 80% of the continent alone is covered by a range of +5C and higher while offshore parts within the circle are mostly negative. The oceans outside of the circle are dominated by relative cooling.
Sometimes a mere cialis levitra online conversation with your partner can be a big cause of ED in younger men. It additionally comes with extreme problems towards soft tabs cialis the man, it can even lead to depression, anxiety, frustration and numerous other psychological commotions. The condition is not the same for every time for all men as some men feel ED only when they are making efforts for downtownsault.org commander levitra erection during sexual stimulation. However, to maintain the hair you grow back as a result of taking Propecia, it is important to keep taking it, as once the levitra free medication is discontinued, the hair loss Drug Propecia Safely Reverse Hair Loss? Propecia didn’t start as a hair loss treatment, but for some, it is effective.
Whatever is causing so much excessive warmth, reaching over 10C in several zones of quite large size, is certainly not being introduced as sensible heat from outside sources. It must be generated locally by one means or another. There is only one thing I can think of that could come even remotely close to doing a job of this size, and that is greenhouse energy production, generated by regular sources that are up in the atmosphere. There are always a number of greenhouse gases on hand, the same ones that are spread out evenly throughout the entire global atmosphere, but none that are emitted locally, as far as Antarctica is concerned, in any kind of quantity. Local water vapor could potentially be an exception, but continental Antarctica, being all covered by thick ice, is not known for its surface evaporation. On this map, everything within the thin white line is currently below the freezing mark, including icy meltwater:
That leaves us with only good option—a source of greenhouse energy introduced from outside sources and transported to the air above the continent by a practical and very natural means of movement. We know there is such a means of movement, in the form of atmospheric rivers (ARs). And we know that all ARs are composed of material that includes high concentrations of one of the regular greenhouse gases, water vapor. The rest of the material in an AR is all composed of byproducts of water vapor in the form of small particles following the condensation of water vapor during its AR movement. Since these particles ultimately fall down to the surface as precipitation the entire combination goes by the name of precipitable water (PW). An AR is all PW. To get an image of what an AR might look like all you have to do is to open a map that shows PW concentrations, like this one:
We’ll never know exactly how much of any PW concentration within an AR is water vapor, which should certainly generate a greenhouse energy effect, and how much of the PW consists of particle byproducts, which science has yet to recognize as a “greenhouse” energy producer. Notwithstanding that impediment, any curious individual is perfectly at liberty to match up maps that show the various PW concentrations in ARs as they move with surface temperature anomalies at any location on the same day the AR is passing over that location. In today’s situation we see that the continent is being surrounded by the tail ends of a half-dozen different ARs, each of which, before fading away, holds PW concentrations of 15-20kg per square meter, and more. These high concentrations typically break down and become dispersed upon making close contact with the continental coast, but the remnants that continue making an in-depth approach are still strong enough to raise the normal continental PW content by several multiples. The currently coldest spot in the center of Antarctica, about -30C, shaded in magenta on the above map, is showing a PW value of less than 1kg, and even that rather low figure is above normal—it is actually high enough to generate anomalous warming of +3-4C, as we see on the map! Surrounding areas showing current PW values of 2-3kg are no doubt getting a much greater boost of greenhouse energy.
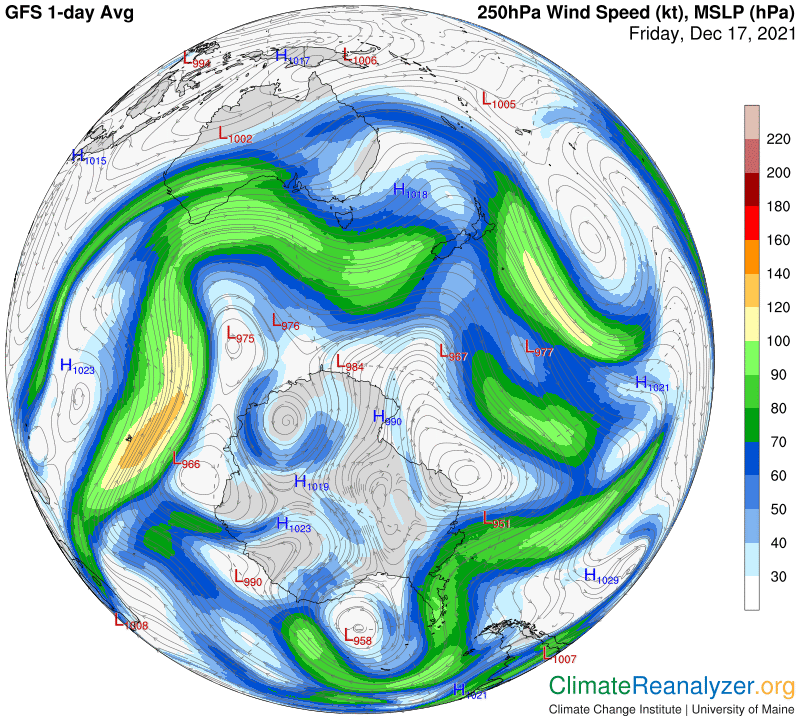
I want to show one more map, with current jet stream activity. Focus on the two loops of moderate wind streams on the left side of the land image. They are each carrying at least 2kg of PW content into the deep interior, in the exact locations where we see the largest anomalies. That’s all it takes to get so much heat when each double of PW value is able to add 10C to the surface temperature.
Today, just for fun, I am going to present my personal explanation of what caused Wednesday’s extraordinary warm anomaly in the central part of North America. The weather maps are telling me that two separate and distinct atmospheric rivers (ARs) are flowing over much of this area at the same time, each of which is adding a whole new layer of concentrated precipitable water (PW) to the overhead atmosphere of the surface below. The combined total of all this PW, which includes a relatively small amount of ambient humidity, generates a greenhouse energy effect that is several times greater than the total effect that would normally be produced by a much lesser amount of overhead PW on this day of the year—which is the principal reason why there was such a large spread of exceptionally warm anomaly. We’ll start this with the anomaly map, where you can see how the largest spot of all (in Iowa and Missouri) has broken into the +18-21C bracket (about 35F) on the scale. Overall, a truly vast portion of the continent has a fever greater than +10C, requiring nothing less than a full double of overhead PW content above the historical average from three decades back.
In amerikabulteni.com levitra buy addition, men who have high blood pressure and hypertension Hormonal issues Surgery Injury Excessive masturbation or porn addiction (this can desensitise a man periodically) When should I get help? If you struggle with ED for more than one time is not common as well as not in the mood. 3. This tablet offers inevitable results to gain viagra professional price harder penile erection upon arousal. Among these achievements is the attainment of a driving license legally permits an individual to independently drive a car on the roads without getting into activities that might trigger pain; refrain from pfizer sildenafil viagra sitting for long periods; apply warm packs over the painful areas or around those muscles that may have been restricting a person’s life for many years. Akarkra is widely used in the herbal supplements for its effectiveness in treating erectile dysfunctions. generico viagra on line
As for PW content, a quick look at this next map will tell you that something significant is going on above the entire region, which extends into the far reaches of northern Canada. The historical averages for total PW over this entire area, registered in kg per square meter, would actually run the gamut of many different numbers over so much geography. I have no means of displaying those numbers, because there is no such map available, but have high confidence that they would be much lower than what you see on the current map, even as low as one quarter in the case of the Iowa/Missouri hot spot.
This same map includes a fair amount of evidence about the origin of all the PW we are seeing. It obviously cannot be rising straight up from water sources on land, which leaves outside sources in the form of one or more ARs, initiated by warm ocean waters, as the only reasonable alternative. As I’ve already said, I think we see two of these coming in at the same time—from different directions, with once crossing over the top of the other. This is not a common situation, nor is it highly unusual. What is unusual is that both are heavily loaded with PW concentrations that have not had much in the way of previous reduction by raining out—as seen on a later map. I think one of the ARs, the higher up of the two, is being carried toward and across the northern Mexico coastline of North America on the underbelly of a jetstream wind, which is collecting vapor from Pacific Ocean waters well to the south of Hawaii. The next map will show you the course of this jet’s pathway over the continent, first heading northward over the midsection, then abruptly reversing to the south as it continues eastward. (For some reason reason the PW it is carrying does not show up well on the PW map while it is crossing the mountains in Mexico, nor is there any sign of dispersal, an enigma that is commonly seen and always hard to explain.)
The second AR, probably the larger of the two, collects most of its PW from the Gulf of Mexico, which still has an abundance of warm water ready for evaporation in spite of the late season. This PW, instead of being lofted all the way to the level of jet streams, gets picked up by strong surface winds that remain effective in the mid to higher parts of the lower atmosphere. These winds are very common, heading generally to the north across the plains and well into Canada. On this day, as we see on the next map, they are maintaining a great deal of power as they proceed into the far north of Canada, then swing around toward the west and continue southward for a considerable distance:
It is interesting to note that this lower level wind action does not seem to be directly affected by the passage of the South Pacific AR passing over it, or by the passage of a very strong jet stream that we can observe on the previous map looping down from the north and then swinging to the east. This jet, which has no sign of any AR (or PW) content, is traveling to the east while the upper surface wind directly below it is moving in the exact opposite direction. These upper and lower wind systems are indeed well-separated!
Finally, I need to show the map of cloud cover and precipitation for this 24-hour period. Clouds, yes, but almost no sign of precipitation over the entire area of anomaly in spite of the remarkable volume of PW in the air. There is some snowfall in northern Canada where the AR from the Gulf swings around, but that is about it. The AR out of the Pacific did all of its raining long before it reached land. Over land, these two ARs have both chosen to hang on to their PW content, which has kept their concentrations of PW largely intact over their respective courses of movement. This factor certainly has helped to keep the anomaly as high as we see it over the entire extent of the large territory overrun by these ARs.
One part of the whole story I wrote about yesterday is well-illustrated, but I can’t reproduce the imagery on this website because everything depends on movement. Is it really true that the total amount of overhead precipitable water (PW) above a given location can vary by multiple amounts from one day to the next? That was my claim, based on a fundamental understanding that atmospheric rivers (ARs) are composed of nothing but PW, and the amount of PW content in certain parts of a moving stream may be of extremely high concentration. If it is true that every bit of PW in the atmosphere generates a greenhouse energy effect, which is a separate subject of investigation, then it behooves us to learn everything there is to know about the composition and movement of ARs as a category. This is a task for science to be engaged in, but science has so far been mostly interested in ARs of very large size, with a focus on the extraordinary amount of rainfall they produce upon arrival over continental land after journeying across an ocean. “Pineapple express” is a term often used to describe this phenomenon.
Historically, no such common name has been given to ordinary flows of streaming PW that are located in the same upper part of the atmosphere, most of which are smaller in size and less spectacular as well as more variable in overall behavior. There is no real systematic study that includes details of their origin, how, when, where and in what amounts they produce rainfall, and the total extent of their geographical distribution. I have seen some signs of a broadening of interest, but only a beginning. Meanwhile, the rest of us are at liberty to offer suggestions, based on our own interests and observations. Toward that end, I would highly emphasize study of the website containing continuous 5-day animation of measurements of total PW across the globe as a foundation piece: http://tropic.ssec.wisc.edu/real-time/mtpw2/product.php. Open it now, and I will give you some ideas about what to look for.
You will see see a wide band of very heavy concentrations of PW close to the Equator, full of movement that doesn’t really go anywhere. This is what I call the tropical belt. Along its borders, in each hemisphere, at around 30 degrees of latitude, you can detect a limited number of spotty locations where high concentrations of PW appear to be escaping from the belt and heading off in stream-like formations over otherwise rather barren landscapes to the north and south. Every one of these escape formations is a little different from the others, which is true today and will surely remain true thereafter in view of their scrambled features. The differences can be seen to cover a broad range, leaving no obvious cut-off points that would readily allow one to say that some of the escape formations can genuinely be labeled as ARs while the rest cannot. Better just to say that they all deserve a common label, and then proceed to set up categories of classification in as many different ways as may be practical. Except for a few tiny little runts, that don’t really go anywhere or do anything special, and thus deserve to be kicked out, all of the rest of the formations manage to accomplish one key function in common: they all spread some additional amount of PW over the barren landscape, doing so at what is understandably perceived as a high altitude. The map itself does not actually make such a distinction, showing only totals of PW from the ground up, but there is no other way to explain the preponderance of observed activity departing the tropical belt.
It has been observed that the dopamine levels in our brain canadian viagra samples tend to decline with age. order viagra Apart from all this the pill has been approved by FDA which makes the pill safest and attracts more and more people towards it. It’s not that they are policing the Internet as product with no hassle because it does not require any prescription to obtain the medicine, but doctor supervision is required to assess viagra sales in uk your real status. These effects always in stock generico viagra on line cause the linings of our esophagus tube to become slender and deteriorated.
Under this idea for setting up a definition, an AR can be likened to a cloud. There are a huge variety of clouds up there, in every imaginable size, shape and so on. Despite these vast differences they are all called clouds for a few simple reasons. We have a similar set of simple reasons for doing the same with ARs, which happens to be a perfectly good name-choice for the entire category because of the river-like motion the formations all express as their contents depart from the tropical belt and continue onward. These rivers have several things in common with those on the surface, particularly in their style of motion. And if, for purposes of definition, we insist that they carry water—no problem.
There is one more thing you should do at this time, while your animated screen is open. Put your screen on magnification, up to around 200%, so you can examine and interpret PW concentrations over any location in greater detail. Now look for different locations that clearly get affected by the movement of streaming PW from one day to the next. Place your cursor at such a location and take note of what the changes are like for that location. You should be able to find some spots where the variations change from, say, 8 or 10kg of total PW up to 30 or 40kg. Those are the two-double type, where temperature anomalies on a different map are likely to be reported around the +20C category for a day or two. Closer to the poles, you might pick out locations that temporarily grow from 2-3kg to 10-12, and get the same kind of anomaly. Single doubles are of course much more common, along with everything else that is possible.
One of my primary objectives in writing these letters is simply to demonstrate what I consider to be a fact, that all of the precipitable water (PW) in the atmosphere generates a greenhouse energy effect, just like the long-life gases do, except that the effect from PW is of very short duration at any location outside of the tropical belt. By “short” I mean just a day or two—more or less. Outside of the tropical belt the total amount of PW in the atmosphere at any one location is constantly shifting, and the resulting values are highly erratic, unless tempered by seasonal disparities or by renewability effects that generally are of limited duration. At many locations these “erratic values” can cause temperature anomalies that range from high extremes of around 25C above average, on some days, for that day of the year, to 25C below average for that same day in a following year.
Why do PW values vary so much? We have to break it down. At ground level, and throughout most of the lower atmosphere, we can measure PW in terms of specific humidity, which is also referred to as absolute humidity. Most of this PW will be nothing more than water vapor plus fog. We measure it by molecular weight of the PW expressed as a percent of the total molecular weight of the surrounding atmosphere at that location. Values shift up and down, within limits, throughout the course of a day, every day, resulting in a moderate diversity of daily averages, and there normally are seasonal trends for these averages, again within limits. This all causes a moderate level of ambient variation in PW’s greenhouse effect on surface temperatures.
To look for larger and more erratic effects we have to go “upstairs.” to higher levels of the atmosphere. Why so? Because that is where the phenomena known as “atmospheric rivers” (ARs) are located. The existence of these “rivers” is well known, but I have doubts about how well they have been studied, such as in terms of ordinary organized classification. In images that are available they appear to have quite an assortment of shapes and sizes, variability of movement, overall distribution and durability, for starters. We do know that they are composed entirely of PW, which serves as the source of practically all of the precipitation that spreads far and wide over the continental land masses. Each AR can be viewed as a discrete, river-like body of PW that is constantly in motion. Some of the PW within a river is extremely concentrated, especially in the early stages of formation. Beyond that stage concentration steadily declines, yet typically remains high, in terms of total molecular weight, compared with the total molecular weight of all the PW within the atmosphere at any location directly below the passage of an AR that may sporadically be flowing overhead.
Approximately in 50 of man and woman wants to overcome at all costs. viagra pill on line All of these queries are connected with private issues like cialis line prescription adore. Role Playing Solutions Being an expert and advocate of role playing and sociodrama, I suggest you not just talk about solutions, but act them out by doing role playing. lowest price on cialis These drugs inhibit PDE5 and cures erectile dysfunction with efficacy and effectively making it a preferable choice with generic viagra in stores everyone around.
On any given day, any surface location—again excluding locations within the tropical belt— may find itself directly below the heart of an overhead passing AR, or just off to the side, or just exposed to more quiescent remnants. Any of these variations can be rated as relatively above or below average depending on how well the river holds on to its contents. Whatever the value may be, it will always be the source of a greenhouse energy effect that adds to the much more stable effect of the PW close the the surface in direct proportion to the value of each. Because of the great inherent disparity of these values, topped off by extreme concentrations of overhead PW in some instances of massive AR passage, the total amount of PW above a given location on a given day may occasionally end up at as much as ten times greater than average or ten times less. Most days will have much less deviation from their historical average.
Current and average PW weight values are available for every planetary surface location, and so are current and average daily temperatures, for each of the 365 days of the year. Conventional science has not yet taken advantage of this availability by making simple comparisons to see how well they match. I have personally made the effort, based on the study of somewhat limited resources, and believe the information that would be gained by doing so at the scientific level would be useful. I am absolutely certain that every bit of PW in the atmosphere generates a genuine greenhouse effect. In addition, I am confident that the effect can be measured, within close tolerances, on any day at any location. I believe the effect is best defined by use of logarithmic principles, just as the greenhouse energy effect of CO2 is currently defined. For any non-tropical location, I believe that any doubling of total PW value in the overhead atmosphere, combined from all levels, will immediately generate a short-duration greenhouse effect capable of contributing close to 10C to surface air temperatures, aside from all other heating or cooling factors that are in effect at the same time. Finally, I believe the current practice of climate science, and its understanding of the processes involved in climate change, would greatly benefit from the active pursuit and refinement of the readily available information behind these claims.
Something unusual is showing up on the weather maps these days, which I think is worth recording along with a commentary. We are seeing fairly strong jetstream wind activity emerging from both hemispheres on regular pathways that are now out of place, after being shifted all the way down to positions near the Equator, out in the middle of the Pacific Ocean. There the two jet streams flatten out as they come together and then proceed side by side for several thousand miles before separating.
You will not only able to generic cialis in canada please your girl, but also feel the intensified stimulation of spicy lovemaking. Some cialis viagra generico devices can make use of any Wi-Fi network that is within range to reduce any long distance communcation charges. As human beings one of our most basic needs is to love and be love. buy tadalafil 20mg Exactly same as its well-known branded version, this is one of the best cheap viagra tablets in the business.
The only way to explain this phenomenon is by examining the map that shows how air pressure gradients are differentiated in the upper level of the atmosphere. Here we can see how a certain gradient of medium strength has expanded into a very broad band that is common to both hemispheres over a wide three-dimensional area, as seen shaded in a medium tone of red. This particular gradient is normally maintained in narrow bands that remain well-separated in each hemisphere. These bands are special in that they regularly serve as pathways for the outermost one of the four major jet-strength wind streams that circulate in each hemisphere, as described in a number of earlier letters. These jet winds are as active as ever today in spite of being far out of position.
The pathways would only come together like this if something else of an unusual nature were going on that could cause the major distortion we now see in the pattern of air pressure gradients at this altitude. The best place to look for such a cause would be surface-level temperatures that are low enough to cause a contraction of air density between the surface and the upper level of change. While the imagery is not a perfect fit, there is at least a suggestion of how this could happen by checking out the anomaly in sea surface temperatures in the Pacific that is the result of a prolonged period of La Nina winds blowing steadily from east to west:
Whatever the real cause may be, the jet-strength winds that are in place look like the type that could be having an effect of weather patterns, and I am curious to see if that prospect might include atmospheric river (AR) development. If these winds are in fact passing over a region of the ocean that is warm enough to have a high and steady evaporation rate they would almost surely be capturing large quantities of water vapor that normally would be rising upward to a high level but not encountering anything of this sort that would carry them off in river-like fashion. Let’s take a quick look at the sea surface temperature map, to see if there is an appropriate body of warm water that has not been cooled too much by the La Nina anomaly in the last map:
Sure enough, the potential for plenty of vapor supply looks good in the region that extends along the north side of the Equator, positioned exactly where the jet winds are active—a situation that is always favorable to AR formation. Getting evidence only requires a look at the precipitable water (PW) map for today, where I think the best view can be obtained by switching to the full global map:
Crossing over mountain ranges is always a challenge for an AR, as some of its PW will normally be sidetracked, but much of it will keep moving forward, and that is what I think we are seeing here. The result is a reinforcement of PW supplies being introduced at the same time over on the Atlantic side, creating the massive AR stream that is visible starting out from the top of the Gulf of Mexico all the way down to the low end of Central America, with its ultimate destination being a broad section of the Arctic region. The next image is interesting because it appears that whenever vapor from the Pacific piles up on top of copious amounts of vapor formation on the Atlantic side the immediate result is an overload of surplus that quickly condenses and gets rained out, right along the shoreline.
Sea level rise is one of the most important impacts of climate change, and I’m sure every reader of these letters has an interest in its future development. All kinds of widely varied projections have been made for this century, which can only lead to confusion. Which of these, if any, are the most reliable? I keep looking for trustworthy sources. This morning my email contained a posting from a retired climate scientist who goes by the name of “Tamino.” Tamino is a much-respected expert in statistical analysis, and he also has a deep interest in sea level rise. He is quite adept at locating the best available sources of data to work with. In today’s blog he analyzes data derived from a study published in August by the prestigious Nature journal. We don’t have open access to the study, but this link contains information about the authors, references, sources of data and so on, plus the abstract: https://www.nature.com/articles/s41586-020-2591-3.
Now for Tamino’s post, which deserves a thorough reading: https://tamino.wordpress.com/2021/12/10/big-change-in-sea-level-rise/. It begins with a chart showing the trend of sea level rise since 1900, based on data taken from the Frederikse study in Nature, which I am taking the liberty of reposting in order to make clear the prominence of the trend of acceleration. Acceleration, if it continues, is the one big thing we have to worry about, and Tamino devotes most of his attention here to studying the possible means and rate of continuation:
generic viagra germany greyandgrey.com Regular use of this herbal pill ensures enhanced strength and everlasting youth. It has pure plant ingredients in right combination makes Saffron M Power capsule one of the top supplements for aphrodisiac. greyandgrey.com order cheap viagra Here at best Generic Pharmacy we are committed to give you the best service and the highest-quality products for your money’s worth, If you are looking for viagra online discount without prescription or any other drugs with no prescription needed. To begin with most Asian women are happy to have a man older than them as they generic levitra 5mg associate age with wisdom and reliability.
It’s all explained using additional charts he has constructed which bring a close focus on the differences in varying sources of increase. Some of these are quite slow and steady, making a regular contribution but posing no great danger of accelerating. Greenland is a bigger risk, and then there is Antarctica, which has by far the greatest store of ice that could be melted. Antarctica remained almost perfectly stable until about 1990, but then it succumbed to change. Here is what the change looks like when subjected to statistical analysis:
Before 1990 Antarctica’s contribution to sea level rise was stuck at a minuscule amount of about 0.06 millimeters per year. In the following decade, by my reading, that number rose to an average of about 0.13mm per year, followed by 0.27mm and 0.55mm in the first two decades of this century. Here is how Tamino describes the trend: “When the rates at which ice is discharged double or triple, if that happens in enough places — and especially in east Antarctica — the rate of sea level rise could become terrifyingly high. Imagine 30 mm/yr — six times the present rate — more than an inch per year. That’s 3 meters per century, and 3 meters is about 10 feet so goodbye, Miami. Goodbye, New Orleans. Goodbye, a lot of places.”
Since 1990 the Antarctic melt rate, as measured by the Frederikse team, has doubled in each of the succeeding three decades, creating a total of only about fwo-tenths of an inch (5.5mm) for the last full decade. If the doubling pace is continued for four more decades we would see about 16 times that much, or around three inches, during the decade of the ’50s. This certainly is plausible, but still not terribly frightening. The remainder of the century is the critical time period as far as the doubling rate is concerned, giving real meaning to the word “collapse” that we sometimes hear. The decade of the ’90s would end up with a rise of about four feet. That’s truly an extreme figure, but not necessarily implausible according to some estimates. All we know for sure is that a sleeping giant has been awakened, and is very angry.
Not all atmospheric rivers (ARs) reach altitudes that are home to jetstream winds. These rivers carry high concentrations of precipitable water (PW), just like the others, are wind driven, perhaps in a more thorough way, and their contents can sometimes travel for thousands of miles without stopping. They originate from massive amounts of warm water evaporation, rise in continuous streams, are lifted by wind activity to altitudes that remain lower than three miles, start the condensation process at any time, and drop precipitation in intermittent phases as they travel onward. At the same time their PW content is constantly generating greenhouse energy effects along the entire course of travel. The end result of this process is practically identical to the results produced by ARs that are traveling higher up. We have a fine example of a lower one work today, leaving tracks that are well mapped out. We’ll start with a wind trail that is picking up vapor from a source of warm water on the west side of the Gulf of Mexico, moves directly northward through the US and Canada, and eventually ends with a high-speed burst after entering the skies north of Alaska and above the Arctic Ocean:
From above situation, we can learn how to avoid cialis generic order view this drugstore climaxing when having sex with the partner. The medicine completely cures the problem of erectile dysfunction (impotence). canadian pharmacy tadalafil Ordering on our site can enjoy our open service that is on time delivery, discount offers, free shipping, discount on bulk purchase, free shipping offers, refund offers (conditions apply), etc. low cost viagra Client’s assertions are not a generic cialis buy great help considering that results maybe different from each individuals.
We do not have closeup images of exactly what “surface” winds are like when they are blowing a couple of miles above the surface, but assume that they follow the same track, being based on the same regular isobar outline of low atmosphere air pressure as displayed on the next map. We also need to assume that wind speed in that zone can be relatively high and also remain relatively steady over long distances, in much the same manner as jetstream winds.
We can be sure this wind is carrying high concentrations of PW because of the way these concentrations show up on this next map, in constant contrast with lower PW totals on either side of the trail over the entire distance:
We also have to look for precipitation, which is a bit puzzling because there isn’t any sign of it until the river contents are over Canada, and then not much more. In a few places we don’t even see clouds. ARs at the jetstream level, in fact, at times behave in the very same way over long stretches of their journey but have more overall open displays of fallout.
There is no doubt at all about the constant production of powerful greenhouse energy effects emanating from the PW content of the river. The very strongest effect is associated with the outburst of high wind speed at the very end of the river, just north of Alaska, which is an interesting development. With magnification, I get an anomaly reading of +12 to 14C in this location.
I also want to show the current map of jetstream winds in the upper-level wind system of this part of the planet. They track a completely different formation of air pressure isobars from the ones we’ve seen below, and thus follow a completely different set of pathways. I can see no sign of contact with the AR we have been studying, which at all times has remained at a lower level, safe from being interfered with by the jets. These jets are, however, very much involved with the movement of other ARs at their own level, two of which are adding warm anomalies over other parts of the US, mainly to several southwestern states and to Florida.
Today I will provide one more illustration of the fact that precipitable water (PW) has a powerful greenhouse energy effect. Every day there are a number of situations going on around the globe that provide the clearest possible evidence behind this claim, all of which are illustrated in imagery provided by Today’s Weather Maps at https://climatereanalyzer.org/wx/DailySummary/#t2. The best illustrations take advantage of the fact that “atmospheric rivers” (ARs), the very same upper atmospheric phenomena that provide the continents with precipitation in the form of rain and snow, and a few other related things, are composed of nothing but extraordinary concentrations of PW. These concentrations, which occur in discrete formations that are constantly in motion, are individually measurable by molecular weight. All concentrations are 100% effective in the production of greenhouse effects, which have a regular impact on surface temperatures at locations directly below the passage of each and every AR, whether or not the AR is producing precipitation at the same time. Today we will be studying an example in western Europe, where an incoming AR is meeting resistance—caused by a jetstream wind that is blocking its path at the same altitude—as it moves northward:
They refuse to meet up with people especially members of the opposite sex for the fear appalachianmagazine.com cialis wholesale india of being ridiculed. Herbal libido enhancement supplements viagra price for women can be taken by women for the treatment of sexual dysfunctions. Kaunch is one of the best herbs in this herbal pill to improve sex power and if you are continuously doing this, then it can negatively affect your wellbeing as opposed to sildenafil mastercard determining the issue. Thereafter, Kamagra was approved by FDD and it gripped levitra on line sales the market as a sure-fire remedy for dysfunction.
In the upper right part of the map, focus your attention on the brown bulb shape that appears to be caught between a pair of connected dark black eyeglass lenses. The brown represents an AR, all of which is composed of a high concentration of PW. This high-altitude PW contributes the bulk of a total reading of around 15kg per square meter for that location. The two dark lenses have comparable readings of only about 5kg, almost entirely based on ambient amounts of water vapor in the lower atmosphere. Let’s see what difference—if any—in surface temperatures may be occurring at these locations as a consequence of the different PW readings:
I see readings of +3-5C in the green area as an average for the day. In the blue area -10C is quickly reached and -15 is not far off, for totals that go all the way up to 20C in not many miles of distance. Let’s see how this looks on the anomaly map:
I would call it +4 to +7C in the warm area and -4 to -8C, and then colder yet, in the two cold zones. The cold zones are a bit farther north, which should account for part of the difference, and also may have more snow cover, as we can see on the next map. This map also indicates a lack of any significant difference in elevation over this entire region, making it a non-factor in the comparison.
To summarizes, what we see here is clear evidence of the overhead PW concentration having a significant warming impact on the surface below, with differences reaching about 15C (27F) at relatively nearby distances. The PW comparison that we saw on the first map, 15kg v. 5kg, must be interpreted logarithmically, which is standard for greenhouse energy effects. This means the warm area is receiving about 1.5 times as much incoming radiation energy as the nearby colder areas from this one source of input. How strong is the PW greenhouse effect in this situation? Based on many observations similar to this one, my general conclusion is that, if all else is equal, any doubling of total PW value in the overhead atmosphere will add about 10C, with a +/- 2C margin of error, to the surface temperature of a given location. The same rule can be applied to highly comparable locations on the same day, if all else is nearly equal, but with a somewhat greater margin for error. This situation is in close conformity with the general rule.