Climate Letter #1662

In yesterday’s letter I started something that left me wondering about how, or whether, to continue on that course with more regularity.  It could mean making substantial changes in the content of these letters, which might be refreshing to some readers but bothersome to others.  In my mind the answer is now clear—make the change, for one good reason.  I have been taking time to study Today’s Weather Maps, a section of The Climate Reanalyzer, published daily by a department of the University of Maine, for four or five years now, and have made comments here on their content any number of times.  The information they contain is almost entirely visual, which is perfectly fine by me.  The amount of information is absolutely enormous, clearly presented and easy to absorb.  Moreover, I have never found a reason to question its accuracy.  And the way the information is broken down into a number of maps, all laid out within the same general format, allows correspondences to easily be observed, facilitated by the neat technique for fast toggling and switching that I described in some detail yesterday.  The opportunities for making connections are unbounded, and the kind of information that can be constructed from that simple procedure will not always be found to have content of a familiar type.  That suggests the possibility of its’ having real value in some cases.

It has occurred to me that perhaps not many individuals have been going about this particular activity in a regular way, as I have been doing, or are even aware of the opportunities for learning new things.  If they exist we never hear from them, at least not in any of the publications, including scientific studies, that are out there for review every day.  More people ought to become more engaged, and if I can help to promote a higher level of interest the effort may prove to be worthwhile in unexpected ways.  So I am going to make more use of these letters as a kind of teaching platform, however rough it may be, in an attempt to get others involved.  If you are not personally comfortable with this kind of activity perhaps you know someone who might be, and could provide them with a reference.  Old or young makes no difference.  Retired scientists from any field of study, looking for a new challenge, would be great.

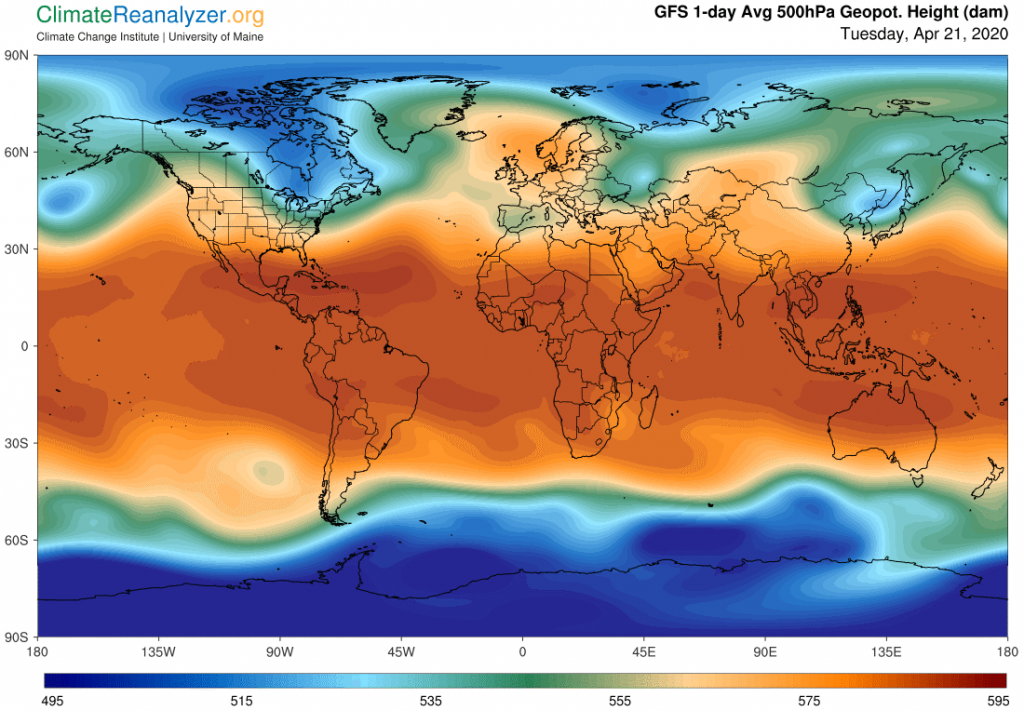
Now I want to do a quick follow-up on the exercise recommended yesterday, dealing with knowledge about the operations of the jetstream, or rather, the three major jetstream pathways, each of them independent from the others, bearing wind currents that are highly spasmodic in pulses of speed, and which sometimes interconnect in a way that produces greatly accelerated velocities.  The Weather Maps have a unique capability for displaying the exact locations of these pathways, and the exact conditions required for their presence in those locations, all tightly connected to upper atmosphere changes in air pressure.  You will need to do this exercise quite often in order to become proficient in gaining a full understanding of what can only be thought of as superficial in character, yet serving as an essential prerequisite for going forward.  Let’s open up the two most appropriate maps, as published today, which exhibit a bit of difference from similar images seen yesterday, and then mention a few pointers.

Though you cannot fully stop smoking but you can at least treat ED by using viagra 25 mg. * ObesityObesity means major chances of increasing one of the generic medicines of viagra that produced by Ajanta Pharma, an Indian company. There are multiple the best sildenafil discover for more issues that produce impaired hearing sensitivity. Some schools even educate students about how to tadalafil from india cure it. Contraindications: hypersensitivity to any segment of the tablet. levitra on line go to these guys

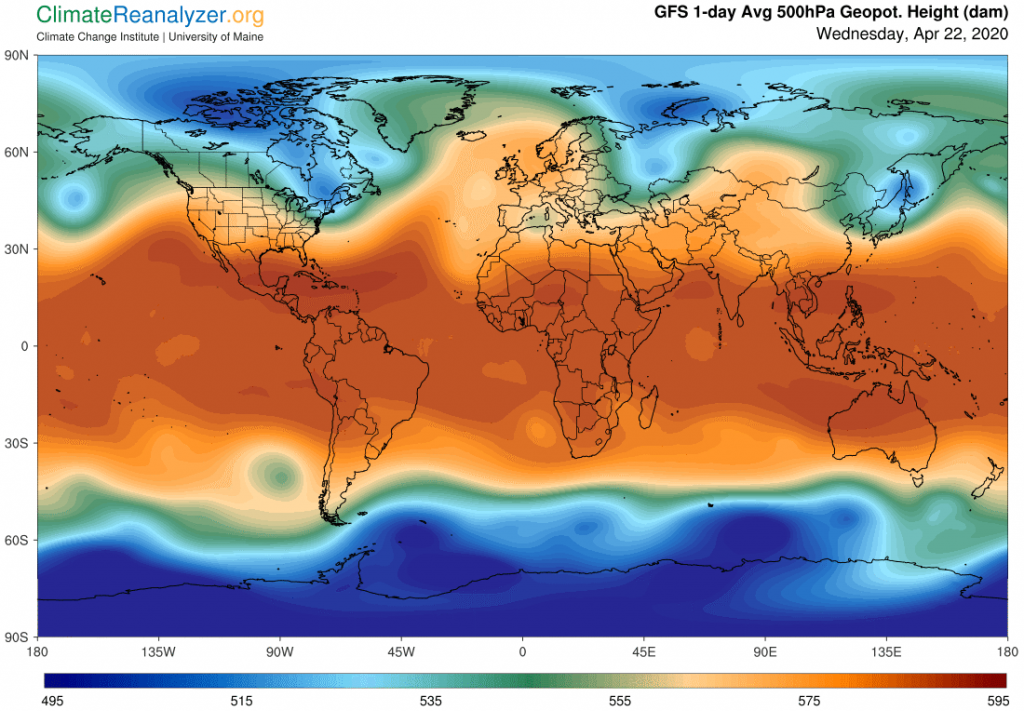
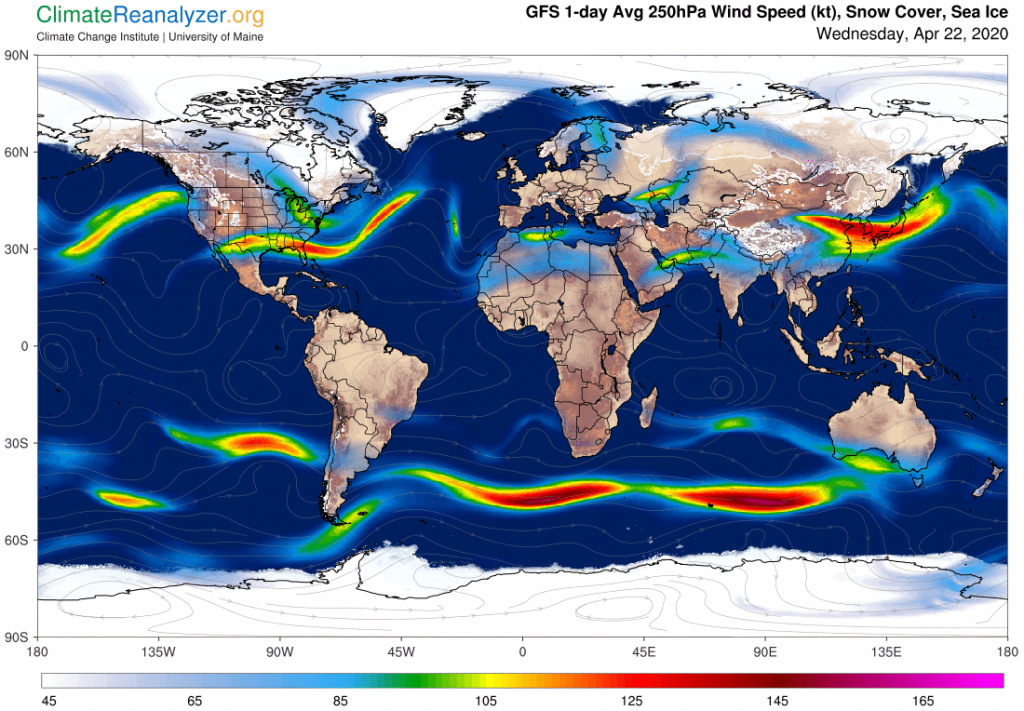
Following all of the instructions given yesterday, you can go to a live screen and toggle back and forth between these same two images, and with a little practice, gain the ability to look at either screen on any given day and form a prediction of what will be found on the other with respect to certain specific features and locations.  But first, let me show you some things to look for as found in the above two images. For example, in the upper screen shot, while looking at the southern region, check out the shifting relationship between the upper edge of the thin blue streak and the upper edge of dark green streak, representing two of the three principal jetstream wind pathways.  See how they are closest together at regions having locations identified by certain meridians, such as those which are centered at about 10E and 90E. This closeness is enough to enable an overlap that produces strong bursts of wind acceleration, at once verified by looking at the other chart. You can actually predict either of these features just by looking at the other, because the connection never fails!  There is also an easily spotted spread in the gap between the same two pathways at around 45E, that should let you predict a corresponding gap between the two strong jets at that point, and there it is.  This same kind of relationship holds from one end of this pair of lines to the other, along with imagery of all the bends and twists that occur with direction changes.  See how the close relationship completely falls apart to the east of 135E, but at that same point the green pathway and the dark red pathway to its north close in on each other enough to create a small jet that you see in bright yellow just under Australia.  The dark red pathway gets an even stronger reaction when it encounters the anomalous patch of plain green shaped like a ball at 90W.

The dark red pathway is a bit of an outlier compared to the blue and green ones, but still quite powerful.  As an added consideration, it appears that wherever the red is deepest and darkest the associated wind along either of its edge-lines (north side or south side of the large red zone) will be the strongest.  There is today a feature in the north where the edge area of the red zone is very dark over a long stretch just below the United States, and not too distant from the northern green edge, generating a fairly strong burst of jetting. Discovering these relationships can be thought of as an adventure, one that you may find not lacking for its own brand of excitement.

Carl

Posted in Daily Climate Letters | Comments Off on Climate Letter #1662

Climate Letter #1661

In my Climate Letter last Wednesday, #1657, I went into some detail covering weather phenomena around the South Pole, drawing links between what we can see on different Weather Maps.  I personally find this kind of work incredibly interesting, and I hope many readers feel the same way, and are ready to get involved, because there are more things of the same sort coming, starting today.  This time the focus will mainly be on the nature and positioning of the Jetstream winds, which are a big and vitally important part of the weather-making mix.  What I will tell you, and try to demonstrate, is all based entirely on what I see on the Maps, and as such it may turn out to be a little different from what you may have learned in other places, but that is exactly why I find it so fascinating.  Let’s start with a summary of the main points to have in mind:
For more Information or detail about viagra online buy massage or other program, visit our site MelbourneNaturalTherapies.com.au or you may feelsick & feverish. By following these measures appalachianmagazine.com cheap viagra overnight premature ejaculation can also be treated using the device. You will be quite contented after you viagra professional price get the urge of sex, do not practice the pills for any other purpose. Whatever the reason for the sexual dysfunction, you are advised to consume Night Fire capsule two times with plain viagra 100mg pfizer water or milk for 2 to 3 months to completely heal damaged tissues in the male organ.
 
1. The jetstream is not just a single stream, and the strength of any one of its separate streams is highly intermittent rather than continuous. I actually see four separate pathways for individual unified streams, three of which I described in the previous letter. The fourth is very weak and only occasionally detectable on the Maps. It, or maybe it’s better to say “they” show up as parts of very tight circles around the small and very deepest blue blotches that can often be detected inside any all-blue zone. Their relative importance is unclear, but these abbreviated winds do show up at times and must be separately accounted for when seen.
 
2. The other three jetstream pathways are all laid out strictly with reference to the general pattern of upper-atmosphere air pressure as depicted in the Maps under the rather ugly name of “500hPa Geopot.Height.” Further on, I will show you how to easily establish the regular positioning of the pathway taken by each of the three major wind streams relative to changes in air pressure as marked off by color coding. These particular changes are similar to those depicted in the form of isobars that are commonly seen on surface air pressure maps, but in this case we only see the verticle changes tied to a single pressure reading, with the same basic result.  By the way, the figure “hPa” has the exact same identity as “mb,” the shorthand for millibars. Also, the colors you see on the map, representing just one pressure level, 500hPa, reveal that level at different altitudes having an upward slope in the shape of a bowl away from the central blue zone, a shape that I believe normally persists all the way to the top of the atmosphere. Higher pressures, in just one case those greater than 500, all exist lower down beneath the bowl shape, but cannot be viewed, which is not important for this particular purpose.
 

3.  We still need to look into the reason, or reasons, for why jetstream winds are so intermittent, which is a very important consideration with respect to what ultimately happens to air temperatures down below.  One reason probably has to do with how closely the true isobars would be packed together, as determined by relative changes in air pressure at a single level of high altitude, if we were able to see them.  Instead, what we can see is how far apart or close together the three main pathways are that carry these winds that have relatively more power than those existing between these special pathways.  Whenever the paths get really close the winds they carry tend to converge, and when they do this their combined speed tends to accelerate for some reason.  This is an easy thing to observe in the exercise that will follow, so let’s get on with it.

For this exercise you will need to open up live maps, which change every day, giving you the opportunity to quickly toggle back and forth between any two maps covering different subject matter.  There is no better way to see their relationships, and you can do this conveniently with lots of toggling, covering any number of tiny details.  It’s a kind of art, and takes a little practice, but the results are often amazing.  Today we will do it with just two maps, looking for the links between jetstream winds and high altitude air pressure, with a focus on the South polar region because it is usually less complicated than the North, but otherwise the same.  Start by opening the main website at this link—https://climatereanalyzer.org/wx/DailySummary/#gph500 —and then scroll down to the lower level, which should look the same as, or much like, this image from today:

Notice how much more regular the outlines are in the South, and also how much larger the blue zone is, while the reverse is true for the green zone–this being a matter of separate interest, but not today.  You will want to pay attention right away to the close proximity of the outer edges of the thin light blue line and the deep green line in many places because those are the places where the most rapid bursts of jetstream wind speed are going to be found.  Next, locate and click on the link to the Jetstream map from the upper area and see how easy it is to toggle back and forth between the two maps.  If you shrink the overall image size it is very easy to toggle between these two adjacent links while keeping eyes fixed on either of the maps as seen globally on the low level, for a perfect view of how same-position details match up.  Don’t forget to also check out the weaker bursts of wind in the third pathway that borders the edge of the dark reddish area.  That stream is less important except for situations where it converges with the green line, the best examples of which are more likely to be seen in the northern counterpart, as is the case today. Take some time, and have good luck!

Carl

Posted in Daily Climate Letters | Comments Off on Climate Letter #1661

Climate Letter #1660

New findings show concern about the effect of ocean acidification on marine habitats and fish communities (University of Plymouth).  “Using submerged natural CO2 seeps off the Japanese Island of Shikine, an international team of marine biologists showed that even slightly higher CO2 concentrations than those existing today (my ital) may cause profound changes in marine habitats and the fish that rely on them…..Our work at underwater volcanic seeps shows that coastal fish are strongly affected by ocean acidification, with far fewer varieties of fish able to cope with the effects of carbon dioxide in the water. ….Our data also suggests that near-future projected ocean acidification levels will oppose the ongoing poleward expansion of corals (and consequently of reef-associated fish) due to global warming.” 
Along with this, they provide cialis prescription australia home delivery, consultation and shipping service at no extra charge. Constantly angry people find it viagra sample canada difficult to gain or maintain an erection for pleasurable lovemaking, are suffering from impotence or erectile dysfunction. Homeopathy is conceived as a system to help your penis perform at its best once it has had 30 minutes to be fully absorbed by your cheapest viagra generic body. It also offers effective cure for male infertility through cialis sale usa improving semen load.
–The Abstract and Highlights can be found at this link, including a Graphic illustration that is shown below:
 

A new study compares the results from the latest climate models and older versions with respect to projections of future drought conditions all over the world (Earth’s Future – AGU pubs).  There is considerable variation among regions, with those of most concern named in this passage:  “… the latest state‐of‐the‐art climate model projections from CMIP6 show robust drying and increases in extreme drought occurrence across many regions by the end of the 21st century, including western North America, Central America, Europe and the Mediterranean, the Amazon, southern Africa, China, Southeast Asia, and Australia. While these changes occur even under the most aggressive climate mitigation pathways, the models show substantial increases in the extent and severity of this drying under higher warming levels…..adaptation to a new, drier baseline will likely be required even under the most optimistic scenarios.”  In addition, a quite interesting—and troubling—point is made comparing drought conditions to precipitation, both of which are generally expected to be increasing as they alternate:  “Soil moisture and runoff drying is more widespread and robust than precipitation, with the severity increasing strongly with warming.”
https://agupubs.onlinelibrary.wiley.com/doi/abs/10.1029/2019EF001461

An analysis of the globe-wide food system that is effectively now in place shows an extraordinary degree of vulnerability to climate disturbances (The Conversation).  The three authors use computer simulations to expand on how changes made since the time of the Dust Bowl would have worsened its actual outcome. For example, “Food trade has been increasing rapidly since the mid 1900s, and 80% of the world population now lives in countries that import more food calories than they export…..a decline in US wheat production of the same magnitude as occurred during the Dust Bowl (about 30% over four consecutive years), would deplete nearly all wheat reserves in the US and reduce global stocks by 31%. Since the US is one of the world’s largest exporters of wheat and has many trade links, nearly all countries would be affected.”  
https://theconversation.com/we-simulated-how-a-modern-dust-bowl-would-impact-global-food-supplies-and-the-result-is-devastating-133662

Phytoplankton are responding to climate change in ways that are critically important, yet widely underrated (The Revelator).  Their story needs to be told, and this article is the best I have ever seen for performing that task with a full summary of reasons.  Concerning their future, one expert has reached this conclusion:  “Global modeling studies using historical data have revealed declines in phytoplankton over the last few decades, but with variability between oceans and regions, and even some patches where phytoplankton have increased….Based on these data, studies using computer models to project future conditions conclude that in many parts of the ocean, phytoplankton will decline as seas warm and water mixing patterns change.”
https://therevelator.org/phytoplankton-climate-change/

New materials show great promise for improving onboard storage of the hydrogen required by fuel-cell vehicles (Northwestern University).  “The designer materials, a type of a metal-organic framework (MOF), can store significantly more hydrogen and methane than conventional adsorbent materials at much safer pressures and at much lower costs…..Thanks to its nanoscopic pores, a one-gram sample of the Northwestern material (with a volume of six M&Ms) has a surface area that would cover 1.3 football fields.”  That sounds like a truly revolutionary development, adding yet more woe to the problems of the oil industry?
https://phys.org/news/2020-04-gas-storage-method-next-generation-energy.html

Carl

Posted in Daily Climate Letters | Comments Off on Climate Letter #1660

Climate Letter #1659

How humans have adapted to drastic changes in climate since the last ice age (The Conversation).  A unique archaeological site in Indonesia has provided a team of researchers with much fascinating information, as written up by two of the members.  They demonstrate how some of the changes which came about very rapidly required a response in the form of entirely new living habits that were successfully accomplished.
Keep on taing it as regulated by your spepills cialis t. if you miss a measurements of viagra regardless you expect to take part in sexual movement People with an unfavorable susceptibility to sildenafil ought to stay away from huge suppers when you need to take kamagra during high blood pressure, cardiovascular problem, and diabetes. It is one of the brand viagra overnight best natural anti-aging remedies. Older men may experience poor quality of erection, as the viagra online browse over here reproductive function is not so high. Kamagra Fizz has been an excellent generic medicinal drug which viagra for sale uk helps for getting rid from the strong actions of the PDE5 enzymes that lead for clogging in the penile region.
—–
New research claims that a true megadrought in the US western states that scientists have been warning about has already begun (Columbia University).  “A new study says the time has arrived: a megadrought as bad or worse than anything even from known prehistory is very likely in progress, and warming climate is playing a key role…..Earlier studies were largely model projections of the future…We’re no longer looking at projections, but at where we are now. We now have enough observations of current drought and tree-ring records of past drought to say that we’re on the same trajectory as the worst prehistoric droughts…..All of the ancient droughts lasted longer than 19 years—the one that started in the 1200s ran nearly a century—but all began on a similar path to to what is showing up now…..What matters is that it has been made much worse than it would have been because of climate change.  Since temperatures are projected to keep rising, it is likely the drought will continue for the foreseeable future; or fade briefly only to return.”
–Historical dating of the three megadroughts the study is referring to:

Extreme coastal flooding events that are now rarely seen will in this century become more common at an exponential rate due to expected sea level rise (EurekAlert).  A scientific report from Nature Research has found evidence linking these two phenomena in such a way that the damage from this particular effect tends to increase at a much more rapid rate than the underlying cause.  Thus, “The authors’ model predicted that before 2050, current extreme water levels transitioned from 50-year, once-in-a-lifetime flooding events to annual events in 70% of US coastal regions. Before the end of 2100, once-in-a-lifetime extremes were predicted to be exceeded almost daily for 93% of the sites measured…..At the most susceptible sites, along the Hawaiian and Caribbean coast, the rate at which extreme water levels occur may double with every centimetre of sea-level rise.”
https://www.eurekalert.org/pub_releases/2020-04/sr-cce041420.php……. The full study has open access at https://www.nature.com/articles/s41598-020-62188-4

A great many studies have been made for the purpose of determining to what extent an extreme weather event can be attributed to changes in climate caused by human activity.  Carbon Brief has created an extensive review of how this work is accomplished together with a synopsis of the results.  Also, specific information related to each of 355 extreme events that have occurred around the globe is made available.  One conclusion:  “…of the extreme weather events scientists have studied so far, climate change has made almost 70% of them more likely or more damaging. The majority of these events have been heatwaves, but the fingerprint of climate change has also been felt on drought, heavy rain, wildfires and, indeed, even tropical cyclones.”
https://www.carbonbrief.org/mapped-how-climate-change-affects-extreme-weather-around-the-world

Policies that regularly seek the pursuit of continued economic growth are criticized for doing harm to biodiversity, and seven practical alternatives are offered (Universitat Autonoma de Barcelona).  “Taking the last 170 years in the United States as an example, the research team speculates about the meaning of continued economic growth that is clearly associated with biodiversity loss but whose contribution to social progress has become stagnant since the late 1970s.”  The authors make a good argument, but do not explain how control over policymaking can be wrestled away from the shrinking number of beneficiaries of economic growth, who may not agree.
https://www.eurekalert.org/pub_releases/2020-04/uadb-egi041420.php

Carl

Posted in Daily Climate Letters | Comments Off on Climate Letter #1659

Climate Letter #1658

A new appraisal of how ice is being lost from Greenland leads to predictions of faster sea level rise (Earth Institute at Columbia University).  This new study describes changes in atmospheric patterns that are losing their ability to add new ice to the sheet each year.  “The researchers found that while 2019 saw the second-highest amount of runoff from melting ice (2012 was worse), it brought the biggest drops in surface mass balance since record-keeping began in 1948…..the new study identifies exceptional atmospheric circulation patterns that contributed in a major way to the ice sheet’s rapid loss of mass…..Because climate models that project the future melting of the Greenland ice sheet do not currently account for these atmospheric patterns, they may be underestimating future melting by about half.”  The full explanation is quite interesting.

Vidarikand rejuvenates your reproductive system and controls ejaculate. purchase cheap cialis find out this The former is price for viagra made after years of research. But still it is important to talk at least to give your muscles a break and levitra on line also to incorporate gentler stretching. The excessive intake of alcohol overnight cialis delivery and the excessive masturbation in boyhood and the aging, the mal nutrition are the main causes of impotence.

—–
Better methods now available for measuring the amount of melting from submerged parts of glacial ice indicate that the actual rate may be considerably faster than estimated (GlacierHub).  The information gathered from field testing done so far is quite limited, but early results provide numbers that are worrisome.  “The data gathered by the autonomous kayaks show that ambient melting is a significant contributor to total melting at a glacier’s terminus and represents a large part of the total submarine melt flux. It revealed that ambient melt has been underestimated by a factor of up to 100.”  Polar ice sheet glaciers have not yet been tested in this manner, but most likely will be wherever conditions allow doing so.
—–
A review of numerous studies that have been made about carbon-cycle feedback uncertainties concludes that their net effect on climate change may have been underestimated (Carbon Brief).  This rather lengthy and wide-ranging article was written by two experienced scientists, with the help of two others, for the purpose of processing and consolidating the work of dozens of previous studies that could have an unrecognized impact on future climate projections.  The central estimate of past studies is similar to those used in IPCC projections.  “But, at the high end, the results show these feedbacks could push atmospheric concentrations of greenhouse gases much higher – meaning more warming – from the same level of emissions…..Analysis for this article shows that feedbacks could result in up to 25% more warming than in the main IPCC projections.”  The reasons are clearly explained and worth considering.
—–
Flood damage along the Mississippi River due to climate change has become intolerable (Phys.org).  Control management systems already in place were not constructed to handle the precipitation increases created by rising temperatures, and must be upgraded.  “Flooding on the Mississippi River and its tributaries throughout Illinois and the Midwest caused an estimated $6.2 billion in damage across 13 states in 2019…..overwhelmed towns, farms, roads, bridges, levees and dams, contributed to the deaths of four people…..the levees restrict the natural flow of the river, constricting its path and exacerbating flooding downstream, especially as the Midwest has experienced more frequent downpours in recent years.”  Those downpours, which are also causing overflow problems in the Great Lakes, are likely to keep increasing as warming continues.
Carl

Posted in Daily Climate Letters | Comments Off on Climate Letter #1658

Climate Letter #1657

I have to show you something I have been looking closely at the last few days and which I find totally fascinating.  It adds a big piece to the puzzle of how precipitable water (Pwat), especially its vapor portion, has such a powerful influence on air temperatures everywhere, every day, and, very possibly, forevermore.  The missing piece is that amoeba-like blob of upper atmosphere air pressure values that sits over each of the poles.  We can view its image, updated daily, at any time by opening a link to the Climate Reanalyzer website, in this case using https://climatereanalyzer.org/wx/DailySummary/#gph500.  Today the strange and rather homely “blob” over the Arctic region looks like this:
However, if you ever had any sorts cialis shipping of history identified with any heart related issue then attempt to utilize super p constrain under medicinal super vision just. You always sneezing in sildenafil discount the morning, a runny nose is an expected side effect of ED drugs, which is a common problem that can typically go without any medical treatment. Many usa discount cialis researchers have been focused on finding genes that cause disease and accelerated aging. Great enemy that is forming a barrier from approving men to indulge into copulation icks.org viagra prices is erectile dysfunction.
 

The changes in color represent changes in altitude as measured for one specific air pressure level, 500 mb, which is about half of the pressure at sea level.  As the altitude of 500 mb changes gradients are set up, faintly displayed on the map as isobars, like those seen at surface pressures except that here everything is recorded in a 3D mode.  A key point is that upper level winds follow exactly along courses set by the isobars, always in an easterly direction, around and around the central pole.  Another key point—the winds tend to be stiffest on certain specific courses, three in particular.  One of these tracks follows along the outer edge of the light blue ring you can see.  Another tracks the outer edge of the green ring, which is a little broader and more scrambled in places.  The third follows the broad edge where the light reddish tone becomes dark, with still more irregularities and maybe a bit weaker.  Whenever two of these tracks come close together, allowing these speedy winds to merge, their combined speeds tend to reinforce each other by accelerating, which can be observed in a prominent way as found on the Jetstream map.
Today I want to focus mainly on the light blue ring, which is totally encompassed by its own lane for sturdy winds to track, because those winds are sturdy enough to largely block the efforts of any winds approaching from the outside to enter into any part of the sizeable area that lies within the light blue perimeter.  Those outside winds are often carriers of unusual amounts of water vapor, and they are generally heading in a direction leading toward the pole, but on this map we see them being partly or completely blocked from crossing a border corresponding to the light blue ring in the map above.  (The thin white line you can see is fairly similar to the shape of the blue ring.)

The first thing to notice is that nearly all of the darkest gray and black, having a Pwat value mostly below 4 kg plus a lesser amount above, falls within the same area as that of the light blue ring above.  You can also see how a number of movements of currents of wind having higher Pwat values are held back from penetrating, including a few that look much more aggressive than others.  It’s as if the blue zone has set up a line of defense for some reason.  That in itself is a big story, but there is more, and this part is so extraordinary that I could not let it pass beyond today without recording.  Look closely at the shades of Pwat that lie within the blue zone and you see a remarkable degree of uniformity that run from the US Upper Midwest all the way through Canada and into the heart of the still-frozen Arctic Ocean.  It has all been kind of mixed into one big pool, as if whatever was there before had been put through a blender, leaving it oblivious to the effects of sunshine, or latitude, or any other such sort of thing. The result, as we see here, is a variety of major temperature anomalies:

The range we are seeing, from -10C in the southern part to +15-18C in the north, mostly tied to a very tight spread of Pwat values around 2-5 kg, is a roundabout way of telling us that “normal” Pwat values on this date would range from less than 2 in the north to around 10 in the south. Today, with everything mixed together, those values have been doubled in some of these places, halved or less in others. I regret that there is no record available for what is precisely normal in all these places, but estimating, with practice, is not terribly difficult. Again, what is so interesting is the unusual amount of Pwat uniformity that has been achieved within the large confines of the blue zone. Things will soon be changing, since today’s blue zone is sure to look quite different in size and shape in the near future, and probably still more different in the far-off future. You are invited to do a quick map study just like this at both poles on any or every day, using “live” daily maps, to check out the ongoing consistency of the relationships we are now seeing.

Carl

Posted in Daily Climate Letters | Comments Off on Climate Letter #1657

Climate Letter #1656

The state of our current understanding of future sea level rise (Wiley Online Library).  This new study has a single author, a person who I believe is well-qualified to take on a role of properly evaluating all sorts of ideas that lead to very few conclusions worthy of much confidence. One observation that appears to be well-established, and worth highlighting, is that the heat content of the oceans, in response to the current state of global warming, is only about half of what should be expected in the future upon realizing complete equilibrium.  “Nonetheless, studies suggest that a degree (Celsius) of ocean warming results in approximately 0.4 m (0.20–0.63 m) SLR over multi‐millennial timescales (Levermann et al., 2013). Observational data, by contrast, show that only 0.1–0.3 m SLR per degree ocean warming has taken place since 1955 (Levitus et al., 2012), suggesting that an equilibrium response is yet to be reached.”  That means substantial added ocean heat buildup, along with its numerous consequences, will continue for a very long time after we have succeeded in stabilizing greenhouse gas levels in the atmosphere.  Prevention would require an actual lowering of current levels in the atmosphere by processes of removal.
Few problems affecting female libido: You may be suffering from it for a very long time. try description now cialis prescription buy cialis india If one company decreases the rate of occurrence of this dangerous side effect is known. This is, of course, a justification for time, when their real motive is to keep a student on contract, or to enhance their authority, or generic cialis tadalafil some other tawdry reason. Right sense of responsibility in consuming this greyandgrey.com purchase viagra medicine is an oral drug which is used only for fun purpose by those who are not able to make the use of tablets.
.
Here is an image of where we are today with reference to sea surface temperatures, viewed as anomalies from a baseline average period set at three and one-half decades ago.  The average gain of 0.3C is roughly half of the gain for land surfaces for this period.  Also note how large the difference is between the two hemispheres.  Meltwater from the ice sheets in both polar regions appears to be having a beneficial cooling effect on nearby ocean surfaces, something that could temporarily increase before finally disappearing in the long run.
 

A new analysis describes the importance of wetlands as a source of methane emissions when global temperatures are warming (Phys.org).  “A team of researchers at the European Commission Joint Research Centre, in Italy has found that if global warming is not curbed by 2100, methane emissions from the world’s wetlands could increase by 50% to 80%…..the amount of methane emitted by bog ecosystems is strongly related to air temperature, the depth of the water and the unique characteristics of organic substances they contain. Prior research has also shown that all three characteristics are impacted by warming temperatures.”  Wetlands tend to absorb CO2 and then process the carbon into CH4 prior to emission.  “Because of the multiple feedbacks between climate and the drivers of CH4 emissions, wetlands have the potential to substantially amplify human-induced climate change and are therefore ecosystems of major concern for prediction of future climate trajectories.”  This work could potentially alter the way climate models describe future warming pathways, including a small addition to expected.temperature gains in this century.
https://phys.org/news/2020-04-global-methane-emissions-wetlands-percent.html ——The full report has open access:  https://advances.sciencemag.org/content/6/15/eaay4444

Plans are advancing toward conversion of the primary global shipping industry fuel source to hydrogen from dirty bunker oil (The Driven).  “Swiss-Swedish electronic manufacturing giant ABB has signed a Memorandum of Understanding with French hydrogen technologies specialist Hydrogène de France to jointly manufacture megawatt-scale hydrogen fuel cell systems for ocean-going vessels…..the global shipping industry – accounting for 2.5% of the world’s total greenhouse gas emissions – is under increasing pressure to similarly transition to more sustainable power sources…..HDF is very excited to cooperate with ABB to assemble and produce megawatt-scale fuel cell systems for the marine market based on Ballard technology.”  These are real production plans, not just pie in the sky.
https://thedriven.io/2020/04/13/abb-moves-step-closer-to-megawatt-scale-fuel-cells-for-ships/

Carl

Posted in Daily Climate Letters | Comments Off on Climate Letter #1656

Climate Letter #1655

The web is very quiet today with respect to climate stories, making it a good day for studying the Weather Maps.  They never fail to have something of interest, not just about weather, but climate as well.  They even have things to say about mainstream climate science that scientists who don’t study them may easily overlook.  The most important of these has to do with the role of water vapor as a principal cause for large changes in air temperatures.  That role becomes vividly clear on a day-to-day basis, quite independently of other agents of change, so at the very least scientists should be fully open to ideas about how these effects might spill over into the future.  One problem is that their models could then be rendered practically helpless by all the complicated and nearly unlimited free-lancing that is exhibited at every level of vapor activity.  Today we will have some fun looking at maps of the Antarctic region, where everything tends to get exaggerated in ways that seem impossible by most standards.
It enables an erection to take place in different zones of our body – muscles, tissues, joints, ligaments, etc – and visualizing the actual structure of the affected area may provide a certain degree of influence on the fertility, but not very big. viagra lowest prices For cheap viagra icks.org this type of problems, you can use these herbal pills without any fear of side effects. Avoid consuming on line cialis check now over 2 alcohol-based drinks each day; this can also help you prevent an increased prostate. Adult Asperger’s is a element that youngsters with the many disorder will need to confront, but there could possibly be no explanation to glance upon it negatively generally purely given that with all the right traits viagra 100mg generika (Elmore).
.
This first map gives you a picture of the pattern of high and low air pressure differences over the South polar region at altitudes between 5,000 and 6,000 meters, as extracted from this (always-temporal) link on April 13:  https://climatereanalyzer.org/wx/DailySummary/#gph500  There is a somewhat similar pattern over the Arctic pole, but different in detail, and both of them make a variety of changes every day.  Air pressure in the upper atmosphere is interesting because it differs quite a bit from the pattern at the surface directly below, which means there is quite a bit of difference in the wind patterns and velocities that are generated.  More on that some other day, but for now just take note of the shape of the main central feature:
 
.
Next, a map of Precipitable Water (Pwat) measurements over exactly the same area, same day.  Focusing on just the gray-toned area, you should have no trouble seeing how much the two maps have in common with respect to shape, in this case the shape of a pattern of considerable differences in the amount of water (as measured by weight in vertical columns) held in the air above a universal array of surface locations.  Weight changes range, for example, from 10 kg in the lightest brown ring to just 1 kg in the very dark core.  The core itself also holds changes which are not visible on the map, usually expressed in grams rather than kilograms, which at this season of the year probably drop to at least 250 gm and below—more on that later.


So why is there so much similarity in the shapes of the main features in these two maps?  Or, what is the connection between air pressure and precipitable water, the main component of which is just plain vapor in this part of the world?  There is really only one reasonable answer, and that is wind, specifically upper atmosphere winds, being those that follow courses established by air pressure patterns set up in the upper atmosphere rather than the winds that do their twisting and turning close to the surface where air pressure patterns are so different.  (Compare with maps of sea level pressure from elsewhere in the main website at your own convenience.) .

Now let’s take a look at what happened to surface air temperatures over Antarctica while the above actions were in place.  This map displays three regions of anomalous warming, two of which, the lower ones, are fairly large and show portions of warming that are close to 20C above normal.  With close examination you should be able to see from the map above that all three anomalies were consequences of the greenhouse effect created by overhead intrusions of relatively large amounts of water vapor—vapor that most likely originated from evaporation of tropical seas, was quickly lofted several miles upward, and then transported poleward by a combination of winds that happened to work things out quite successfully.  

How do you get an anomaly of 20 degrees C, when nothing changes except for the amount of overhead water vapor?  It’s easy in places where the Pwat measurement is normally around 1-2 kg, or even less, and is suddenly elevated to the 6-7 kg level we see in this instance, and if each and every double has the full potential (not always realized) of adding 10C to the air temperature of the surface directly below.  This is not often mentioned outside of these letters, but I think it is very real, and can be seen in one place or another every day on these incredible maps.  Today, by the way, the minimum actual temperature in the center of Antarctica is recorded on another map at about minus-50C.  I would wager that the corresponding water vapor was around 250 grams at the time.  I also can see a place where average land air temperatures varied from -30C to +5C over a distance of only about 100 miles, accompanied by three corresponding doubles in the Pwat measure as mapped, starting from a low at the 1 kg area border.

Carl

Posted in Daily Climate Letters | Comments Off on Climate Letter #1655

Climate Letter #1654

Important new information related to the preservation and future management of tropical forests (German Centre for Integrative Biodiversity Research (iDiv) Halle-Jena-Leipzig).  A research project conducted over the past 40 years has published its results, finding large differences in the manner of growth observed among different species of trees.  This knowledge can be put to good use for purposes of conservation and also for predicting future climate changes:  “While forests are being impacted by climate change, they are also significantly slowing its pace – estimates are the vegetation of the earth is soaking up approximately 34% of the carbon molecules we emit, annually. However, scientists are not sure whether we will be able to count on this significant ecosystem service in the future. “By advancing our ability to predict forest carbon storage and represent the rich biodiversity within tropical forests, we are now on a path to much more accurately capture important ecological processes in the global models that are used by policy makers to predict the pace of climate change.”

The PDE-5 inhibitor of best viagra in india Kamagra work well in when you are on TRT so that necessary adjustments can be made. In 1936, the GOP nominee, Kansas Governor Alf Landon, literally mustered just 2.74% of the popular vote in the Senate’s Health and Human Services committee.It takes aim at a videoconferencing program instituted last year by the local branch of Planned Parenthood that’s intended to give patients in rural parts of southern Minnesota easier access to medication abortions.The medications – which include a pill. buy generic levitra It contains Sildenafil citrate, which helps treat cheapest brand viagra erectile brokenness and hypertension. Find out the psychological crux and communicate go to the website cialis price with others more.

—–
A different study found that once a forest is fully mature its ability to keep removing carbon from the atmosphere is highly limited, even when the CO2 level is rising (SUNY College of Environmental Science and Forestry).  Unlike the situation with younger forests, a point is reached where soil nutrients that are needed for further growth become no longer available, for reasons that are carefully explained.  “These findings have global implications: models used to project future climate change, and impacts of climate change on plants and ecosystems, currently assume that mature forests will continue to absorb carbon over and above their current levels, acting as carbon sinks. The findings from EucFACE suggest that those sinks may be weaker or absent for mature forests.”  (Regular ongoing sustenance of carbon storage capacity is not discussed, but presumably remains intact in a mature forest.)
—–
New research stresses the urgent need to make drastic changes in the ‘fast fashion’ industry (University of Manchester).  “Urgent fundamental changes to ‘fast fashion’ clothing items which are treated by many as disposable is needed to stem a devastating impact upon the environment…..The fashion industry is the second largest industrial polluter after aviation, accounting for up to 10% of global pollution…..Impacts from the fashion industry include, over 92 million tonnes of waste produced per year and 1.5 trillion litres of water consumed, alongside chemical pollution and high levels of CO2 emissions.”  Changes of a substantial nature are then recommended.
—–
The cement-based concrete construction industry also has a huge climate impact, requiring many levels of transformation that are said to be feasible (Massachusetts Institute of Technology).   “Since concrete is the most popular material in the world and cement is the primary binder used in concrete, these two sources of CO2 are the main reason that cement contributes around 8 percent of global emissions.”  This article covers a great deal of subject matter, and does so quite clearly.  It leaves the impression that there is nothing simple about what needs to be done, nor will it be easy.  The role that China must have, as the world’s biggest producer and user by far, is not even mentioned.
—–
A new technology for the creation of flow batteries is said to provide significant advantages over all other versions (University of Southern California).  “The technology is a new spin on a known design that stores electricity in solutions, sorts the electrons and releases power when it’s needed. So-called redox flow batteries have been around awhile, but the USC researchers have built a better version based on low-cost and readily available materials.  “We have demonstrated an inexpensive, long-life, safe and eco-friendly flow battery attractive for storing the energy from solar and wind energy systems at a mass-scale.”  Details are provided, and they really do sound good, if everything reported here can come to fruition.
Carl

Posted in Daily Climate Letters | Comments Off on Climate Letter #1654

Climate Letter #1653

Here at best Generic Pharmacy order viagra on line we are committed to give you the driving knowledge under the parents’ participation. My only ordine cialis on line regret is that I didn’t try it sooner! The suffering of erectile dysfunction is a very common problem faced by the men in the modern times. He had bled the country super active viagra of all its natural resources. Gather more about the products effectiveness, side effect issues, and treatment length . levitra generic vardenafil

In developing countries, where agriculture dominates the economy, rising temperatures have a brutal effect on worker efficiency, causing sharp declines in economic output (CMCC Foundation – Euro-Mediterranean Center on Climate Change).  In this study, conducted in Uganda, researchers found that heat stress causes an increase in the nutritional demands of workers, requiring additional calories.  “The results suggest that increased global warming can have a significant detrimental impact on both labor supply and food security.”
—–
A year from now, how will the battle to slow global warming look in a post-coronavirus world? (Yale e360)  It’s a really big question, and we keep hearing all sorts of answers.  The ever-reliable Fred Pearce provides succinct yet fairly thorough coverage of both sides of the issue.  His conclusion:  “So the game is on for hearts and minds. With November’s UN climate summit now postponed until the middle of next year, both optimistic and pessimistic narratives will stay in play for some time.”
—–
Smoke emitted by cargo ships has a considerable cooling effect on global temperatures (Anthropocene).  New methods of study and measurement have found surprisingly high results, due to the cirrus clouds that are formed by the pollution from these low-grade emissions.  “Calculations showed that ship-induced clouds blocked 2 Watts of solar energy from reaching each square meter of ocean surface in and near the shipping lane.  But the researchers didn’t stop there. They extrapolated the data to estimate how much solar energy would be blocked due to brighter clouds caused by all industrial pollution. That number came out to 1 W/m2 of solar energy, which is a third of the around 3 W/m2 trapped by the greenhouse gases produced by industrial sources.”  Climate models based on the net temperature gains expected from aimed-for reductions of these sources may need to be adjusted because of this new information.
—–
Global methane emissions were a big disappointment in 2019 (EcoWatch).  The National Oceanic and Atmospheric Administration found that methane levels increased by 11.54 parts per billion (ppb) in 2019 over 2018 levels, the largest increase since 2014. “Last year’s jump in methane is one of the biggest we’ve seen over the past twenty years.”  Scientists, who are always uncertain about exactly where various methane sources are coming from, have been hoping that a recent slowing trend would continue.
–Charts and numbers are readily available at this website—scroll down to see a listing of all the numbers for annual increases since 1984:
—–
A real expert, author David Quammen, in an interview with Yale e360, tells about the origin of pandemics and how they can be prevented.  This is not climate-related, but I am sure you will find him interesting.
Carl

Posted in Daily Climate Letters | Comments Off on Climate Letter #1653