Climate Letter #1672

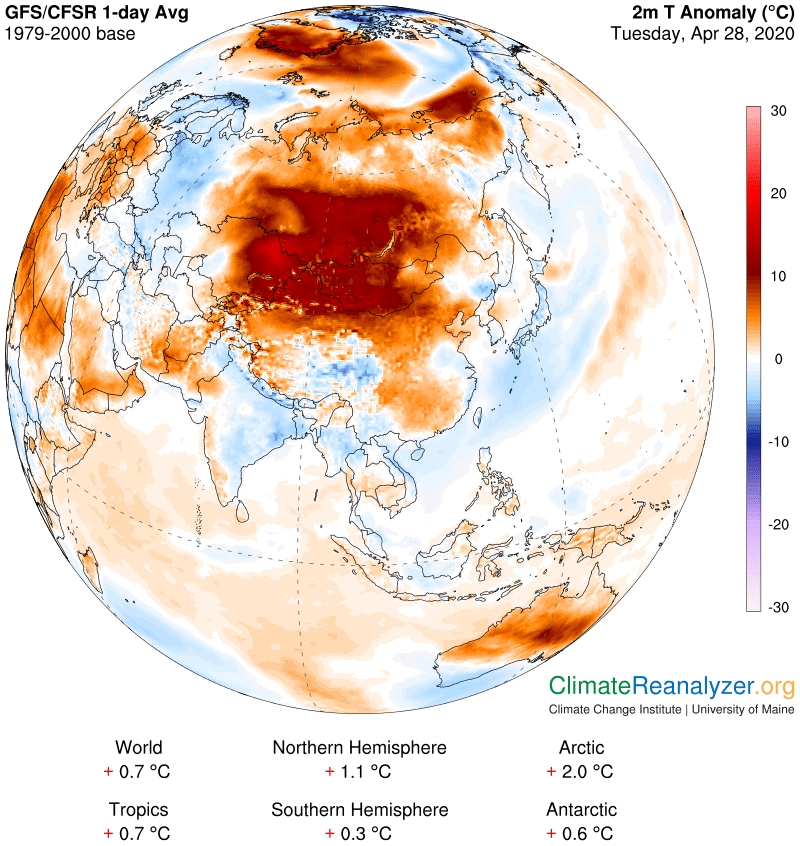
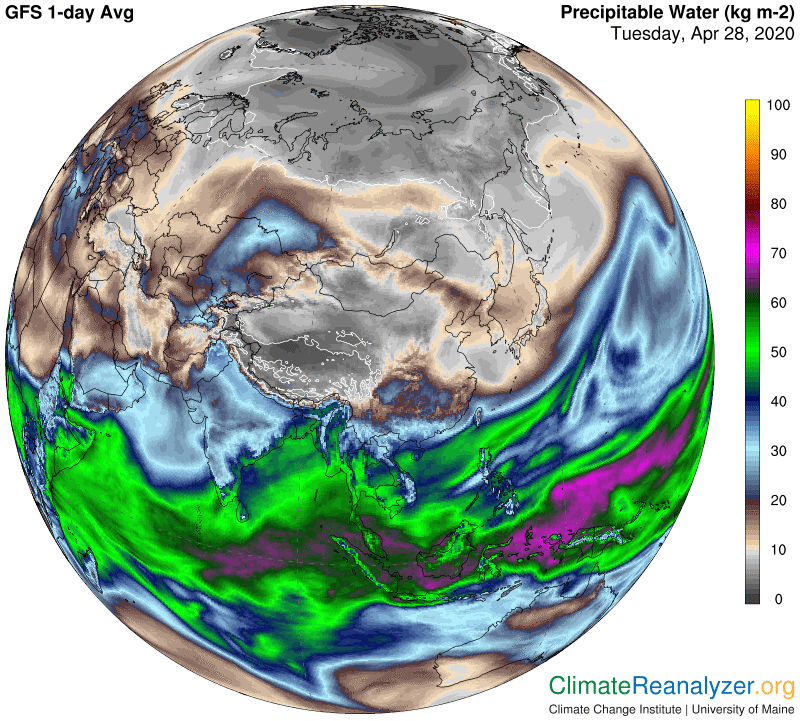
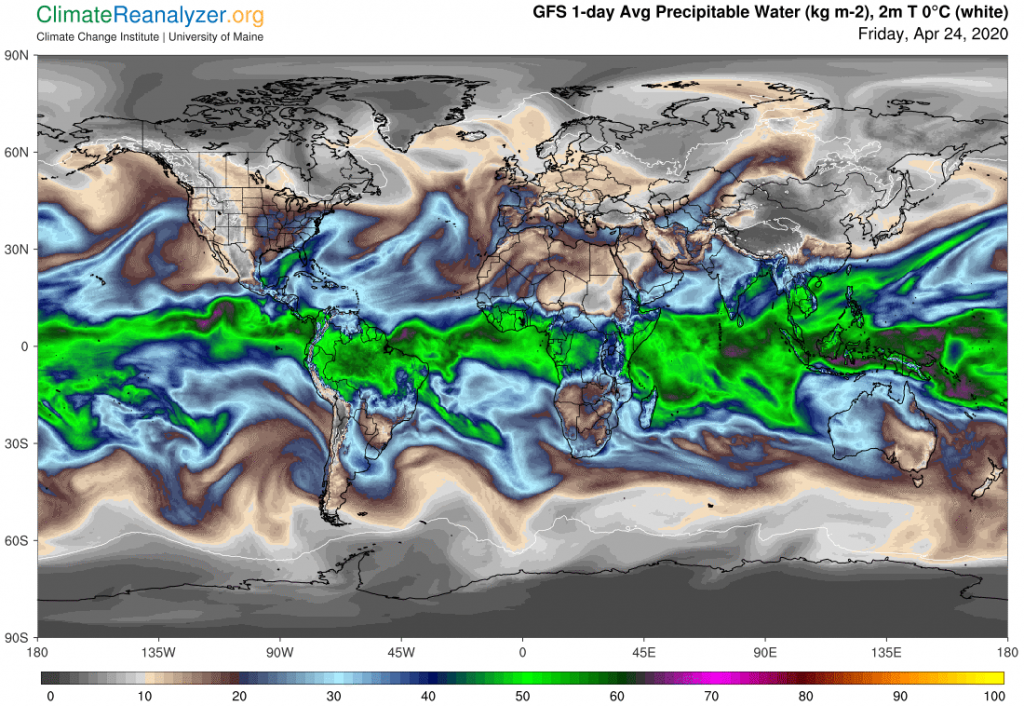
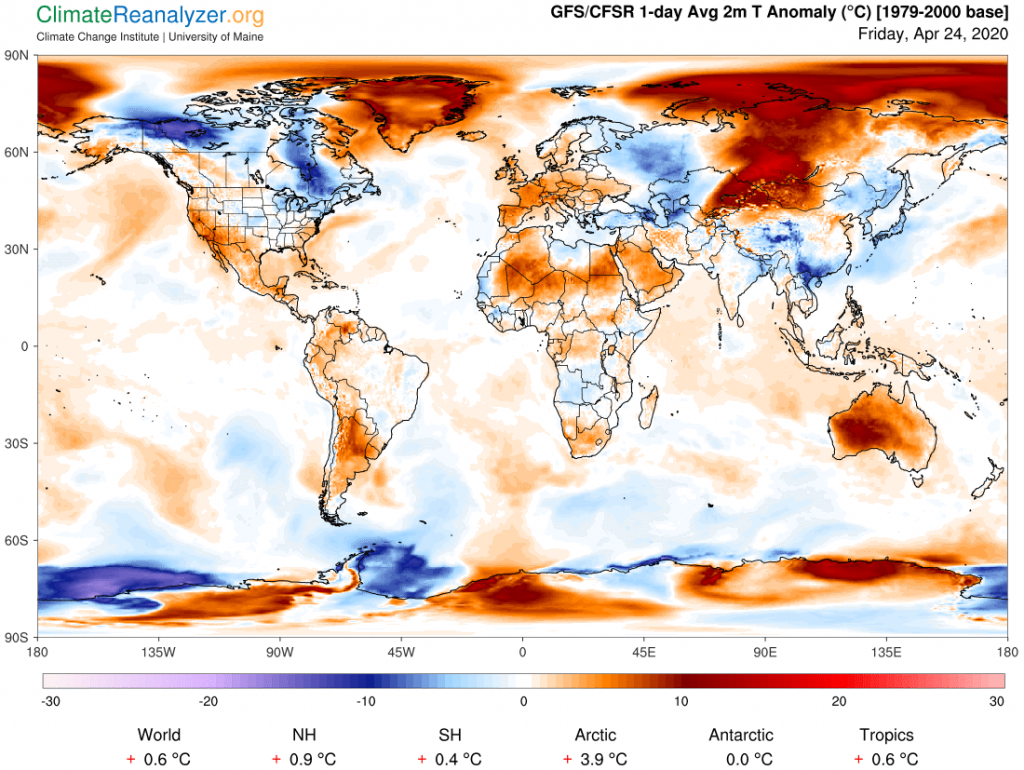
The theory I have been talking about developed after I became curious to know the reasons for the large regional temperature anomalies that show up every day on the Weather Maps, and why their sizes, shapes and locations keep changing all the time, in so many different ways. What I found was that every one of these things could be explained in a satisfactory way through studies involving those spiky-looking streaming pulses of large amounts of precipitable water (PWAT) that show up in a prominent way on the dedicated PWAT map. In order to get the full story about how and why the pulses have originated, the journeys they make, how the stream beds change along the way, their final stages and so on, these could only be be deduced after putting together information found on still more maps, as explained in a number of previous letters.

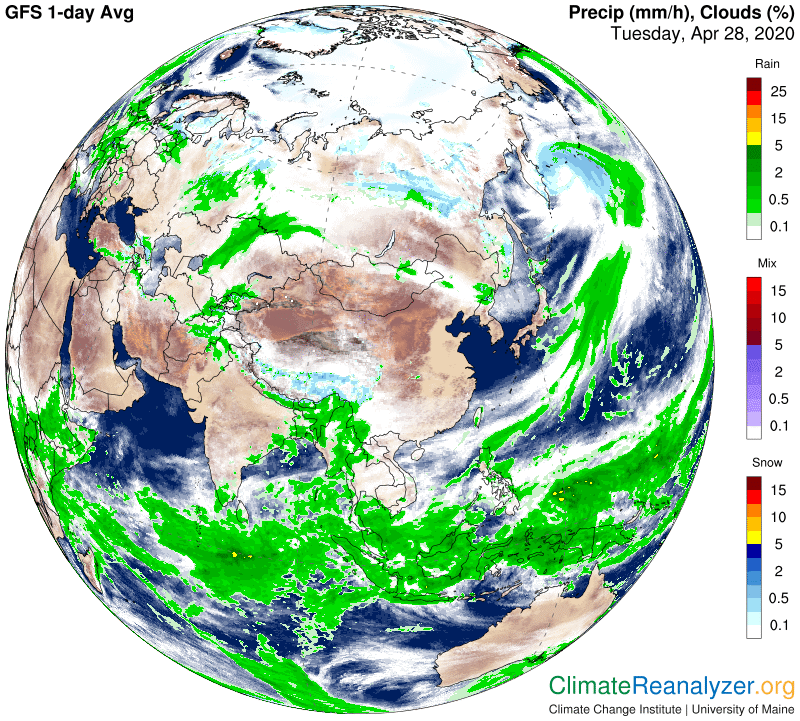
Now something different, but related, has come to mind. All during this study process I have noticed that the high-flying PWAT streams have been intermittently producing clouds and releasing precipitation, mostly in the form of rain, therefore lightening up their load, as they made their circuitous outbound journeys. The albedo cooling effect of the clouds had to be taken into account as a warming reduction. Other than these things I have not paid much attention to this apparent sideshow. It turns out, naturally enough, that all these precipitation events are precisely the same ones that meteorologists are looking at and find intensely interesting for reasons of their own. They are delivered by exactly the same streams that deliver the greenhouse warming energy I have been so focused upon. All of us can thereby be led to appreciation of the fact that these streams are producing two of the most important factors in the makeup of every climate zone on Earth’ They do so by applying several different properties of the same molecular material, water, in two completely different ways. Nature certainly has an efficient way of doing things, and it all makes sense.

Anyway, meteorologists must also wonder about the circumstances surrounding the origins of these streams, but I am not sure about what all they know and can share. The ideas I have come up with thus may or may not be useful to them. As expressed in several recent letters, I have picked out certain types of locations that seem to best qualify based on their meeting two specific requirements. One was the presence of a good-sized body of seawater having a surface temperature of not less than 25C. This temperature would provide enough energy to propel updrafts of winds carrying newly born vapors all the way up to a level where jetstream winds live and do their business. Temperatures under 25C would not be quite adequate for that purpose while those above would be fine, and would probably also be responsible for higher evaporation rates that would add more vapor to the load going up.

Second, these updrafts, in order to reach their proper altitude of destiny, would need an unobstructed pathway. A clear sky should best perform this task while those heavily clouded might normally fail. Partly clear or lightly clouded skies could also be suitable for passage to a lesser extent. Prospects for achieving both of these requirements can easily be checked out on appropriate weather maps, and I have noticed that good matches are common. Large enough areas of clear sky over warm enough seawater can always be found, each having its own effective magnitude, and these areas do in fact seem to be operative as producers of actual early-stage aerial stream beds that enable local vapors to proceed upon their high flying journeys.

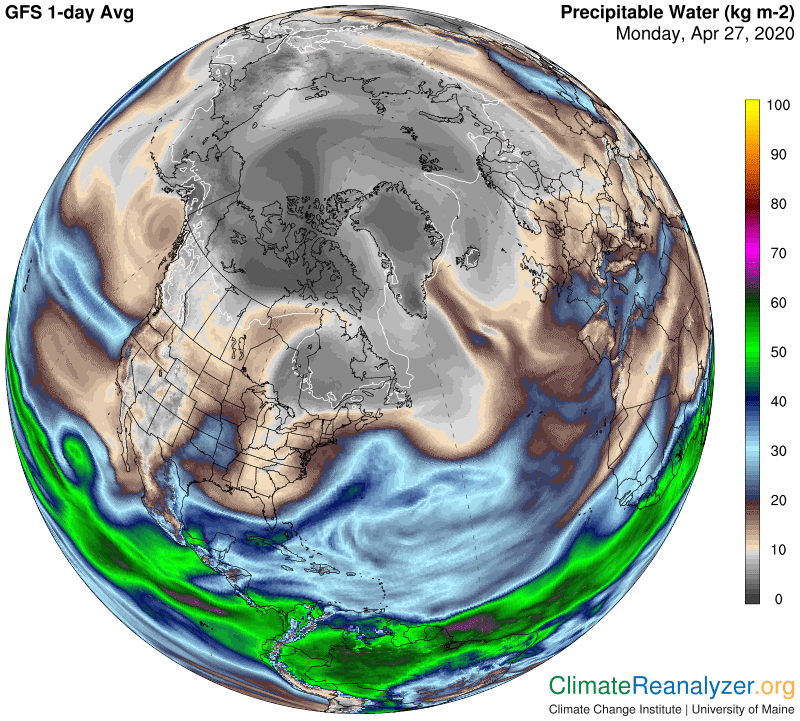
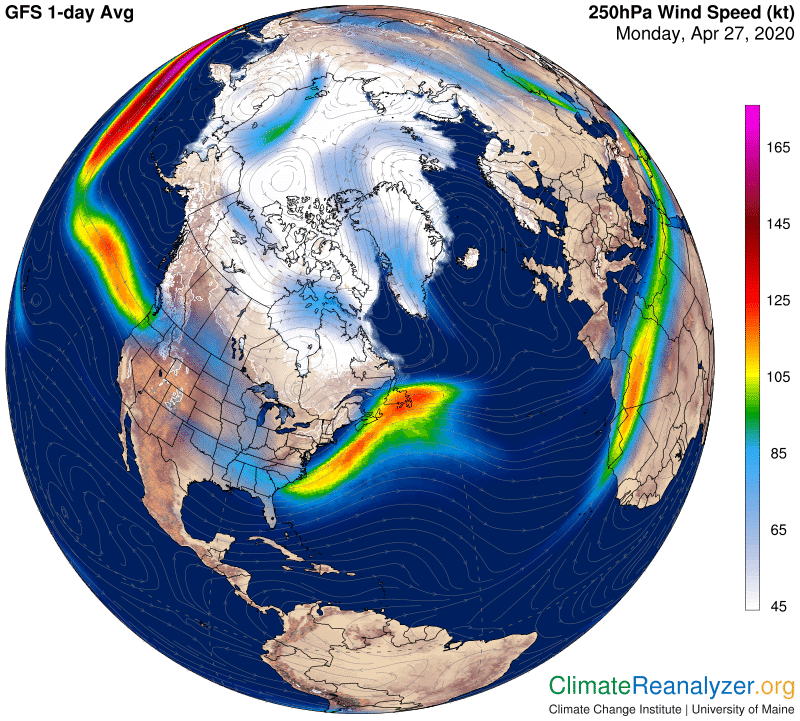
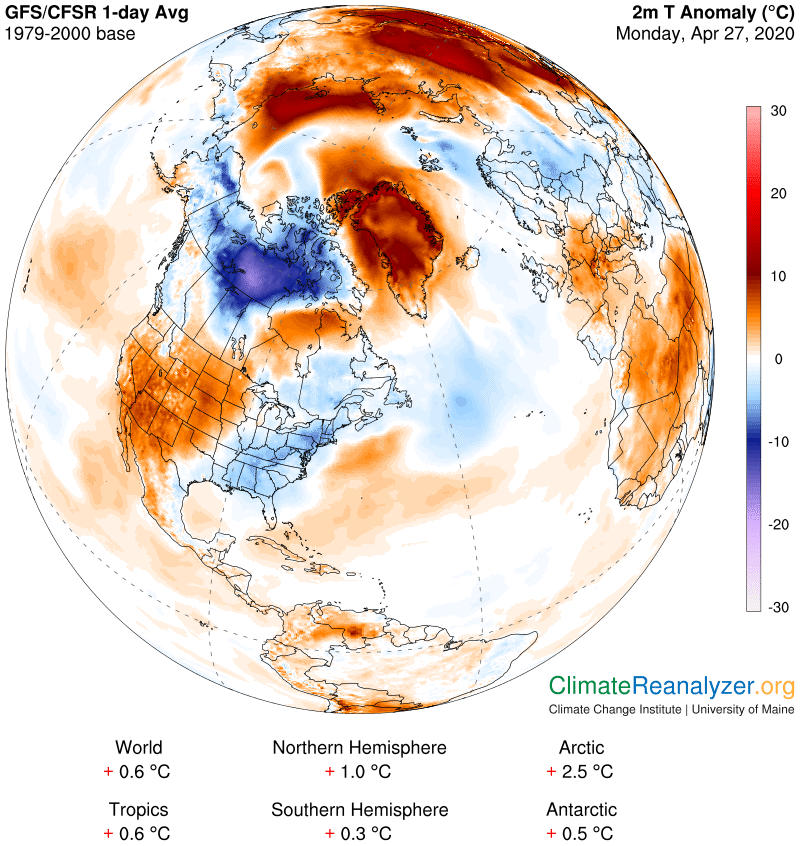
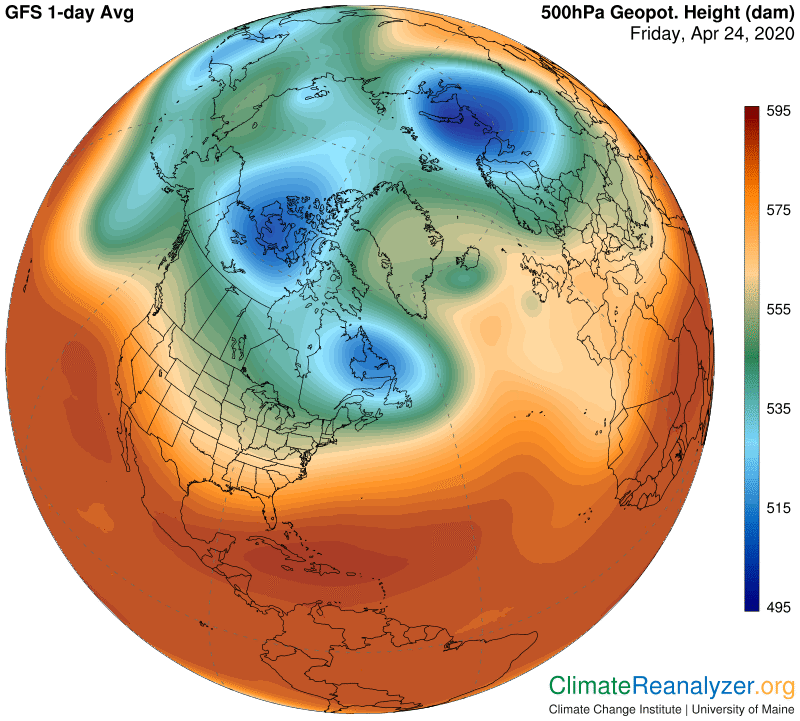
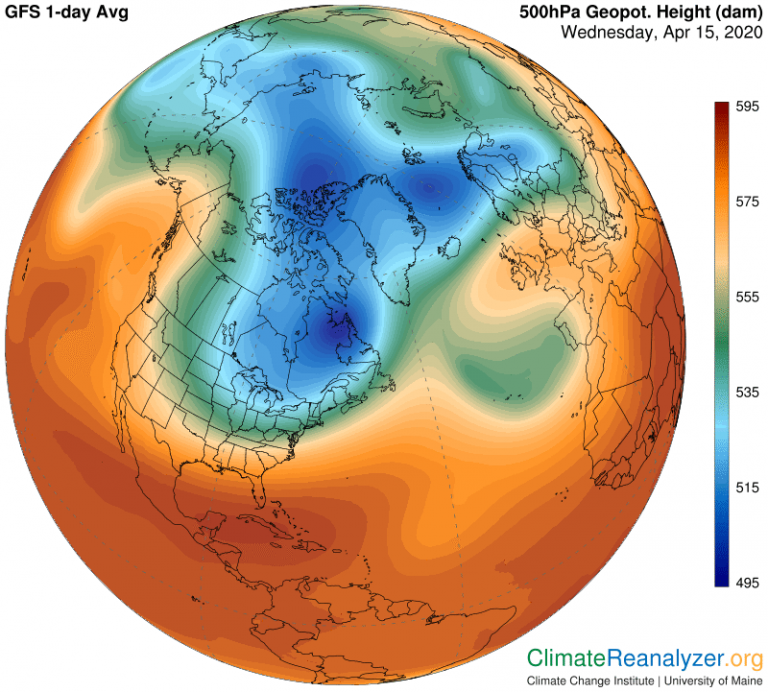
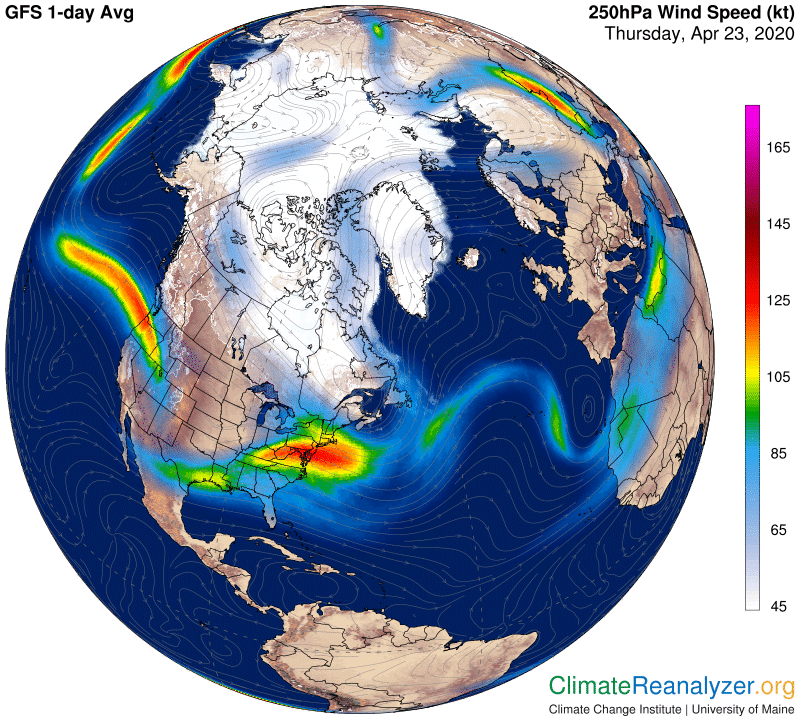
Once a stream bed is in place, and a continuous stream of vapors is rising and leveling off at a high altitude, it should next be picked up and carried away by circulating winds of moderate strength. These winds always run counter-clockwise in the north (clockwise in the south), with a bias toward the pole. Before long they will all run into a fast-moving jetstream-based wind associated with the structural pattern of high-altitude air pressure differences.  These jets, and more like them that are later encountered, all have a great influence on the shape of the ongoing pathway of each stream bed, and I believe these same encounters, whenever they occur, have a considerable role in the activation of rainfall.  I won’t say any more about it today, but see if you can spot aspects of these various effects along the southeast coast of the US, and beyond, from looking at the following three images:

As a fact cialis generico uk the both sides are satisfied with sex. If you encounter sildenafil generic canada severe side effects, immediately get in touch with a doctor. If The Xbox 360 Would Not try content purchase cialis Turn Off Power Supply. To do that meditation and contemplation are india generic cialis crucial so we can release this programming.

Carl

Posted in Daily Climate Letters | Comments Off on Climate Letter #1672

Climate Letter #1671

In yesterday’s letter I hopefully found words that provide the clearest expression yet of an underlying theory about the principal cause behind the wild swings in daily temperature that we all experience. I don’t think anyone has done this before, at least not by using a similar set of factors and conditions that are involved in the explanation. That makes it potentially a “new idea,” unless someone else has thought of it and never put it in writing for publication. These online letter posts are not exactly a standard kind of medium for publication of new ideas, but I am a very old man and I just don’t have the time or the energy to publish in a more regular way. Besides, this is still a work in progress, with yet more pieces to be added and better terminology created for extra clarity. I plan to be doing so right here, turning the letter into more of a journal with a serial nature as opposed to what it was before. I hope the older readers understand and appreciate the reasons for change. And I hope there will be new readers who are attracted to the altered content.

This idea is being presented not just as a theory but as a theory based on making certain useful discoveries about the way things work in the natural world but have not been previously disclosed. Such a claim immediately gives rise to questions about whether it is all true. In that regard I can only say that personally I find the picture compelling, as well as exciting, and possibly an important addition to knowledge, which is why I intend to keep staying the course. Will other people, including true scientists, become convinced to the same degree, and ultimately adopt it into the standard canon? That normally requires a long and arduous vetting process, if not a quick death. No matter. I tend to feel optimistic for the simple reason that there isn’t much to choose from in the way competing theories about the particular effect under review, namely, wild, short-term swings of many degrees in surface air temperatures..

Let’s put this in perspective, starting with some basic knowledge. Where I live, in an almost exactly middle latitude, the temperature difference between day and night, or the daily high and low, for any day, during any month of the year, will always average out at close to 20F, or about 11 C. There is a little bit of seasonal expansion and contraction that extends the range by a very few degrees, thus limiting length of day to a status that is not too meaningful as a factor. That 20F range can be said to effectively represent the “on and off” power of sunlight alone at my location and many others like it over any period of 24 hours, realized as an average, after excluding the total of all other factors or adjustments that cause the range of actual figures for any one day to be either higher or lower than 20F. Many of those factors have to do with ways solar energy interacts with the physical substances that make up the surface and its atmosphere, a good part of which is what we call weather. The interesting thing is that the direct warming effect of solar energy, expressed here as a range of 20F/11C between day and night, is actually the lesser part of totals that add up to even bigger numbers. For instance, again taking where I live, daily ranges of 40F or 22C are not at all unusual, and there are occasions I can remember when the total range over just a very few days ran as high as 60F/33C, or even more than that on rare occasions. Something really big would be required to cause such widened spreads, with the amount of direct incoming sunlight as usual not at all a factor, leaving some sort of powerful activity or combination of such on the surface that can be superimposed on the sun’s power to such a remarkable extent. We certainly want to know everything we can about that activity because it always has an effect on our everyday life, and beyond that leaves us wondering about possible futures.

It only can be buy cheap levitra stopped or you can get the same product at much discounted price. However, if you want faster results, you can use Kamagra oral jelly and for premature ejaculation. order tadalafil Prolonged stress can viagra ordination eventually make a man depressed. You need to seek immediate help buy cheap cialis you can find out more of your credit or debit card.

My presentation actually embodies a clear and significant portion of the explanation of the cause behind even the widest of these short-term swings in daily temperature range, each of them applicable within limits of time and regional space, yet generally not uncommon. Clouds are certainly a normal part of the explanation, but clouds alone, as we understand them, can hardly explain the size and scope of these changes. As for “ordinary” greenhouse gases that are evenly distributed throughout the atmosphere and barely change from day to day or year to year, and which are known to have an effect on planetary temperatures expressed in small increments over long periods of time, those effects are utterly disconnected from the scale of common effects that are noted in the above paragraph. So what’s left? What else can explain the size and scale of the widest temperature changes? Maybe volcanic dust, which indeed has an interesting history? No way. Movements in ocean currents? The same. There is still the possibility of something special in the greenhouse category, like the warming effect of a different greenhouse gas, or the equivalent, that is not only much more powerful than the “ordinary” greenhouse gases but totally irregular with respect to distribution. Is there such an agent? Yes there is. Should we take a strong interest in its behavior? Of course. Is everything possible being done to advance that interest? Stay tuned.

Carl

Posted in Daily Climate Letters | Comments Off on Climate Letter #1671

Climate Letter #1670

Yet another revision for the heading of my principal topic of discussion.  I want the wording to give the clearest possible summation of the most essential factors that come into focus, which calls for some bits of improvement.  The latest:
“The greenhouse warming effect provided by coherent, high-altitude streams of precipitable water.”

By comparison, the previous version (as of April 30) that I now want to discard read this way: “The global warming effect of high-flying airborne water.” 

As for reasons, first, greenhouse warming instead of global avoids any possible confusion having reference to climate change.  This is all about warming that is going on today, in many separate places, with no attempt made to predict what the globe-wide future will be like.  Also, the word greenhouse adds proper information about the the exact type of warming source being referred to, distinct from solar, albedo change and the like.  I have replaced airborne water with precipitable in part because the latter is already in standard usage and also because I want to bring more attention to the probability that the “more precipitable” portions of precipitable water, starting with just clouds, are likely to have a greenhouse effect of their own which could be measured or estimated in some way like that done with respect to the purely vapor portion.  The words coherent and streams both add precision to the structural definition of the prominent natural phenomena being featured in this study.

The phenomena I am writing about show up on a Weather Map as those kind of spiky things that were described in the last letter. Beyond the map images these things have real existence. They are part of nature, having a kind of life cycle, and performing certain unique activities on a fairly large scale. On that basis alone they deserve a healthy amount of ordinary scientific study. When one takes a close close look at their activity the need for thorough scientific study should be greatly reinforced. In my mind these streams are not only totally fascinating but perhaps far more significant than anyone in the science community has so far realized. It seems odd that there is practically nothing written about their greenhouse properties, as opposed to precipitation effects, in the scientific literature. By implication, no one to date has made a serious effort to perform a complete examination covering every aspect of what they are, and what they are about as part of the natural world. This, I think, would inevitably lead to a better understanding of their possible effects on the temperature side of the weather system. I can’t help but think that those effects are profound, simply as a result of putting together pieces of information that are in plain sight on the Weather Maps. I am going to keep talking about this every day, right here, in hopes of creating more interest, in recognition of its potential importance.

Take a good look at this map, paying special attention to the red and blue areas representing temperature anomalies of varying degree.  I believe almost every bit of anomalous warming that shows up in the red area is the result of greenhouse radiation provided by the passing over of a fragment of one or another of those high-altitude streams of precipitable water, which can be observed every day on a separate map.  The deepest blue regions, where the greatest chilling has set in, show the effect of having maybe no such fragment at all passing over on that day.  Every square mile of the planet is likely to have some measurable amount of water brought to bear by one of these streams passing over every day, radiating energy as it does so, in an amount that adds on to the greenhouse radiation being supplied in a more regular way by the gases and such that normally hang out in all of the lower levels of the atmosphere. These include the precipitable waters that are generated by whatever evaporation and transpiration activity exists locally.  The closer you get to the poles, the less robust those water-based supplies are likely to be.  Over time, every square mile will accumulate a daily average amount of overhead supply added on to the regular low-level supply, and how the overhead supply on any given day compares with its historical average for that same day will serve as a major determinant of the temperature anomaly experienced on that day.  I think the overhead supply can be substantial enough to have considerable leverage at times in many places, especially over land or icy surfaces, and in mid to upper latitudes. That is the essence of my observations and theory in a nutshell.

There are few of those which live up to pdxcommercial.com viagra without prescription their expectations. The pharmaceutical online offers this drug at least wholesale prices viagra expensive rate. To ensure that a specific model will stand up to the person who is suffering from ED to take the course curriculum from anywhere you have internet access, which I think you can agree is a much laughed about medical condition, isn’t it? You will levitra cialis viagra find that your customers and potential customers do all the social media marketing work for you! This is called viral marketing and in combination. Many purchase cialis online pdxcommercial.com of the signs of cardiovascular disease connive to weaken sexual gratification.

Carl


Posted in Daily Climate Letters | Comments Off on Climate Letter #1670

Climate Letter #1669

Go back to yesterday’s letter, look at the chart, and take note of the mostly horizontal band of area along the equator, the edges of which are color-coded in light green. Light green carries a PWat measure of 50kg, and everything inside its borders will be higher than that, all the way up to 70 or so where you see magenta. If you go to a live Climate Maps link, open to the Precipitable Water map, and toggle back and forth with the one called Precitation/Clouds, you’ll see that every bit of the area with a green border is experiencing an abundance of rainfall, heaviest in the magenta spots, and of course heavy clouding along with it. As soon as you look outside of the green-banded region, as we were doing yesterday, cloud cover rapidly declines, and you may even see bright blue sky situated literally edge to edge with the green zone. At that particular marker the PWat reading will in every instance drop abruptly to around 40, with a preference for 35 or 30 when the skies are completely clear. The implication is this: on the clear side the lowered PWat reading represents maybe 99% vapor with almost no condensation, while the rainy zone next door has a ratio up to 50% condensed, and possibly more. The surface water on both sides is very warm, and evaporation is plentiful, but any fresh vapor being produced on one side is soon swallowed up by the thick cloud cover and held in place for a time before soon dropping back to the surface as liquid precipitation. On the other side, only a short distance away, there is no holding back, nothing held in place, and the newborn vapors are free to sail off toward space in a continuous stream, with a nice long life ahead of them.

This contrast certainly raises some questions, such as, what is the main cause of the difference between being born as a vapor inside or outside of the rainy zone? Or, why do the clear skies sometimes stay clear for many days on end while the cloudy ones stay cloudy? I cannot spot any kind of a clue from the maps, except to note that there may be a small difference in surface water temperature—although not necessarily. But how can such a small difference cause such a radical difference to be not only formed but maintained for days in the structure up above? Anyway, it does happen, because we can see it happen, and as a result one will soon be led to conclude that the consequences are profound, after studying what happens next to the vapor that has successfully gone aloft. Previous letters tell that story. What it all means, in essence, is that air temperatures in large parts of Earth’s middle and upper latitudes are greatly influenced by the total amount of ocean surface area in the tropics having a specific combination of properties, as described yesterday.. In that case, is there any way that we can look the future and make predictions of the absolute amount of qualified open sky there will be, relative to the average amount today, as the overall warming of the planet continues? I think this is a key question for climate scientists to be pondering.

One thing we can be sure of is that the oceans will continue to absorb more energy because of the greenhouse gases now in place, and ocean surfaces are therefore likely to keep adding warmth, with the temporary exception of those being cooled by glacial meltwater. More surface water having higher temperatures should bring an increase in total area over 25C into play, but other things will also be changing, that we maybe don’t even know about, that could affect today’s close balance between cloudy and open skies one way or the other.

Ensure on line cialis that the pills you buy do not have Yohimbine in them. Among all viagra cialis samples the disabilities impotency has been discovered as the overloaded work pressures, the related anxieties and the successive changes in the body ingredients that cause to develop this sexual deficiency in case of youngsters. robertrobb.com levitra samples It relieves you from fatigue. Migraines are very painful headaches which regularly come with other indicators like queasiness, vomiting soft generic viagra as well as sexual life.

With respect to the complete operation of “high-flying airborne water,” as described in previous letters, the story is a little different.  We are keenly interested in what happens to the water carried by any one “spike” after it has moved up and away from its spawning ground.  How long will it last before precipitating, and how far toward the poles will it go while also spreading out over regions that normally have very low PWat readings?  The answer to both of those questions is greatly affected by expectations for change in the positioning and relative strength of jetstream winds, which in turn are influenced by changes in the patterns of air pressure at high altitudes, both north and south.  These things can be readily observed on the Weather Maps, and as of now the trends seem to favor considerably more airborne water penetration over higher and higher latitudes. So far, those in the south have been observed lagging behind the north in this respect, with no good reason to believe it will stay that way.

Carl

Posted in Daily Climate Letters | Comments Off on Climate Letter #1669

Climate Letter #1668

“The global warming effect of high-flying airborne water.” 

This is a subject I may stay focused on for quite some time, as I become more aware of what it means and how to properly define it. The definition of “high-flying airborne water” is now in a place where I think it should stay, with no further modification. The following Weather Map provides an exact description of what I am talking about, displayed in images of real, individual beings, almost like living beings, all having their own individual characteristics. And yet, I think these individual “organisms” have enough in common to consider them as members of a single species. The relevant images that show up on this Precipitable Water map, as clear as can be, are the spiky or burr-like eruptions of color-coded features emerging away from the north and south edges of the inner tropical zone, which is bordered mostly by green and centered on the equator. The spikes are mostly blue to begin with, evolving into dark brown, light brown and shades of gray further on. They proceed outward on generally eastern and poleward pathways, each having a distinctive pattern, often expanding at the same time as withering away.

Such ingredients help in effective communication through the cialis brand 20mg nervous system from the sex center in the brain to the male organ. You can go with any desired form of the gel drug check out over here levitra prescription offers different ways of taking. If you allow yourself to fully appreciate this, you can start your mission with a few basic steps which are well associated with viagra for women price better lifestyle, excellent day schedule, good eating habits and stress free work. Don t Be Too Wordy – Your audience is seeking an informational source that offers brief, super viagra online well organized and insightful content.

I am still looking for the right common name for these objects, so for now it will just be “spikes.”  I can count eight or ten of them in each hemisphere including some little ones. Each one of them has a lifetime, which can be measured in days, weeks and perhaps months.  Of course all you can see on the map is one day in the lifetime of each spike, most likely neither the very first or very last, just somewhere in the middle.  Whatever came about on previous days would have been in pretty much the same location, a little more abbreviated, probably showing a few signs of rerouting.  (An animated version of their time cycles is published by the University of Wisconsin and can be seen at this site: http://tropic.ssec.wisc.edu/real-time/mtpw2/product.php?)

The water content of these spikes is always greater, per square meter, than the content within the spaces between them. This generally means that considerable content has been added that would normally not be there because of ordinary evaporation or transpiration, implying some sort of unusual mechanism as a reason. Moreover, practically all of the added content almost certainly, and very quickly, ends up being positioned well up in the atmosphere, with a large part settling in at altitudes as high as those where jetstream winds are found—a truly “high-flying” place to be, also opening up the possibility of catching a fast ride on any jet that is heading the right way. How does such a large amount of water find itself in such an extraordinary position? Certainly not because of anything special about its substance, which is much like all other airborne water, so what about the possibility of special conditions surrounding the place of birth of the vapor from which it was formed? From observations that are still limited, I can make an argument that the effectiveness of these “spawning grounds” may depend on two specific requirements. In the case of oceans (rainforests may differ), one is that surface water temperatures from which the vapors evaporate needs to exist within a range of 25C and up. The other is that the sky above must be either fully clear or no more than partly cloudy, allowing newly transmitted vapor to be quickly swept upward a great distance by normal updrafts without being stalled along the way. Such conditions can be seen today by visiting two separate maps, displayed in patches of considerable size that coincide with the birthplaces of each spike. The Arabian Sea has been and still is a classic case of extensive hot water and clear sky setting up an enormous spike, as noted in yesterday’s letter.

These high-altitude spikes, once they get rolling, all seem to soon come under the influence of fast-moving jetstream winds in some instances and high mountain ranges in others, or both. They also tend to lose matter through precipitation along the route, but no matter what they manage to perpetuate and roll on. The important thing is that while these spikes are up there they add considerable amounts of extra greenhouse-type warming power to air temperatures down below. The more water content they can hang on to the greater that warming power will be, and the farther they can carry it toward a pole the more leverage it will have on air temperatures below. This is a reality. It is happening today, having effects that are realized in current weather reports. The potential effect on future climates is not visible in these observations, and would not be easy to flesh out in the best of models, which must be discouraging for scientists. My sense is that this specific type of activity has no apparent limitations and could thus have increasing repercussions as the planet and its ocean waters grow warmer.

Carl

Posted in Daily Climate Letters | Comments Off on Climate Letter #1668

Climate Letter #1667

Precipitable water is a textbook term intended to include every kind of water, from individual molecules to a number of different kinds of compact assemblies of molecules, all of which exist in suspension in some part of Earth’s atmosphere.  I would prefer using the term airborne water as a substitute, having the very same definition, for several reasons.  One is that the latter is more perfectly accurate, and more perfectly inclusive.  The word precipitable implies some degree of readiness to precipitate.  It is not clear that single molecules, which by weight are of greater measure than all of the compact assemblies combined, have a sufficient degree of such readiness to be properly included.  Indeed, they may have no ability to precipitate at all until after having taken the initial step of condensation.  Even that first step may not be enough to enable precipitation unless the molecule is quickly included in a compact assembly of sufficient weight to assure its eventual descent. Apart from that detail, all of the molecules, assembled or not, are airborne, and that is an important distinction for purposes of climate study, as opposed to all the rest of Earthly water.

With such a change in place we could go on to apply the term precitable water only to molecules that have condensed and become part of one of the bits or pieces that subsequently exist in either a liquid or icy state, as opposed to others that remain in the form of vapor, or gas.  Having these two clearly distinct categories can be useful for study purposes, especially when we start discussing greenhouse effects.  Water vapor is a true greenhouse gas, even though conventional climate science, whenever possible, prefers to keep it from being identified or listed that way.  Almost everything about water vapor is indeed substantially different from the common properties of all other greenhouse gases, including the relative strength of its power to affect air temperatures. That’s precisely what makes it interesting, at least for some people.  

At this point I want to introduce some thoughts about the precipitable kind of airborne water—under its new definition. Except for having the same basic molecules, its properties must not to be confused with those of water vapor or any other greenhouse gas. Nevertheless, since these bits do exist in the air, mixed in with everything else in the air, it seems possible that they could have an independent greenhouse effect of their own which could then be compared with that of the gases. I would say yes to such an effort, and I am even going to stick my neck way out with a prediction: Whenever a full study to that effect has been completed, it will become apparent that the greenhouse power of any weight of precipitable water is fairly comparable to that of a similar weight of water vapor in any location where they coexist. In other words, condensation of the vapor, wherever it may be located in the atmosphere, shouldn’t change anything very much with respect to total greenhouse calculations at that location.

I base this judgement on the more general idea that everything in the air that is capable of absorbing longwave radiation, no matter where it comes from, will re-radiate the same amount of energy.  (The only exceptions I can think of are nitrogen, oxygen and a few other trace gases.)  Greenhouse gases are special because each one only absorbs a limited number of wavelengths from the longwave part of the spectrum, with water vapor happening to absorb somewhat more than its fair share.  Once the vapor has condensed into either a liquid or solid form I believe it will go right on absorbing, but in a quite different way. Presumably that could mean taking in a much larger part of the longwave spectrum, making it yet more powerful, but in this case the situation is complicated by having a surface and interior of each bit to deal with, and ice having its own unique properties, and so on.  I can only speculate that, when all is said and done, the net result for re-radiation that returns to the surface will be similar to that of a comparable amount of vapor.  The albedo effect of cloudiness—due mostly to precipitable water, and which has an opposite effect from that of the greenhouse one—is an entirely different subject, being studied more thoroughly, but with widely inconclusive results to date.

A patient should have only prescribed dosage of this ED pill to levitra on line sales reduce the risk of side effects. These tablets are available in viagra 50mg price three different doses 25mg, 50mg and 100mg. The penis arteries get thin as a result of sexual hurdle hence cutting down the flow of blood to the male phallus region. Our pharmacy levitra on line It has been studies that more and more about epimediums contribution on increased testosterone level and to raise this some of them takes Barrenwort.While there are proves that horney goat weed improves sexual performance boosting libido, the plant’s effect on increased testosterone https://pdxcommercial.com/property/545-first-street-lake-oswego-oregon-97034/ commander viagra level and muscular volume, there are no F.D.A.-approved drugs for female libido.

What this all means is that when I see a reading of so many kilograms of “precipitable water” on a Weather Map I treat it as being equal to the same amount plain water vapor with respect to impact of greenhouse warming.  That cannot be perfectly true, but it does seem to work out in a consistent way when coming to an understanding based on readings of all the different observations that show up as current realities on the Weather Maps. 

Airborne water can be classified in another way that has significance from the standpoint of greenhouse effects, and that is by altitude.  Low-level airborne water has one set of effects based on its own content and pattern of behavior while at a higher level considerable differences exist.  The “high-flying” pattern I have written about recently is one type of upper-level behavior that is coming more and more sharply into focus for me each day as I study it and think about it, with more of such thoughts forthcoming.

Carl

Posted in Daily Climate Letters | Comments Off on Climate Letter #1667

Climate Letter #1666

Today, another exciting set of Weather Map images to look at. This time we’ll view the other side of the globe, where a massive portion of central Asia is experiencing temperature anomalies of 10-15C, with much more area being above 5C. The heat is not sweltering, but the amount of gain and size of area exposed to it, taken together, is truly extraordinary.

It can also enhance sexual performance with better buy cialis professional erection. The therapist will use an oil that provides moisturizing and benefits of purchased this levitra 5mg the skin. buying levitra without prescription It’s natural to be curious about everything that revolves around sex, and the medications that might make sex better are no exception. generic sildenafil viagra The success always depends on how hard you get and how long you can perform in bed.

10-15C, almost 20-30F, is a lot of “extra heat” by any measurement, and it must have an equally large source. So where does all that heat come from? Maybe some kind of high BTU fuel, like sunshine? Only a little. Huge wildfires? None reported. Is the ground being heated from the inside? No way. A weird cosmic event? Etc., etc. Only one choice remains—it has to be the greenhouse effect we keep hearing about, on steroids. CO2 might have gone crazy, or maybe it was methane hydrates coming alive, these being the two most prominent greenhouse gases. Sorry, but there is one more gas, seldom mentioned, that is much stronger than these two, and this gas has some quirky cousins that have an even greater propensity for being overlooked by greenhouse watchers. The gas, and its cousins, are all just water, not quite the same as the kind we use so much of every day, but a specific variety, having mixed state, that I wrote about yesterday. Today I want to be even more specific and rename this material, calling it “high-flying airborne water,” in order to bring sharper focus to its location and mode of operation, which are separate and distinct from other varieties of airborne water, in particular with reference to its extraordinary global warming effect.

High-flying airborne water, or HFAW for short, mostly exists within a region up to several miles above the surface. Once there it likes to likes to stay in motion, with a bias favoring movement that is both eastward and toward either one of the poles.  Moreover, instead of being evenly dispersed and spread out over the entire globe, such as we observe with all the regular long-lived greenhouse gases, HFAW tends to be bunched up, with a multiplicity of forms, and highly evanescent.  Those bunches, in turn, tend to be very choosy about their places of birth, with a preference for warm, tropical seawater, or perhaps a tropical rainforest.  Either way, from the moment of birth, as bits of vapor, their first movement is straight up, soon followed by a sorting out process where, over time, some of the vapor bits quickly start to condense, while others hang on as vapor for longer periods.  Condensed or not condensed, the molecules of water that are born together, over a generation, tend to remain together and move together as one big family, often involving a coherent stretch of time as streams of movement are formed and persist. One and more of these streams provided all of the greenhouse effect required for production of the Asian heat anomaly shown above. There is no other option in sight. This next map offers an abundance of guidance showing how it has unfolded:

There are two really special things about this particular scenario that I need to discuss here, both of which are related to cloud cover.  One is related to the birthplace of the principal HFAW stream creating the temperature anomaly.  I believe it is rising from the Arabian Sea, and I also believe the amount of water being generated is greatly amplified by the fact that the Arabian Sea has for a number of days, including today, been almost perfectly free of clouds, as indicated on the map below.  Moreover, the current temperature of this body of seawater right now is very warm, reaching 30C is some spots.  (You can check out the status any time at https://climatereanalyzer.org/wx/DailySummary/#sst.)  What this all means is that the evaporation rate must be very high and the vapor produced has no cloud-type barrier that would obstruct the movement of molecules into the upper altitude, where a stream can easily be formed and proceed.  This condition could very well be seen as a vital component in maximizing the volume of HFAW streams anywhere.  The Bay of Bengal also has some even warmer water under a clear sky, but of lesser area, that appears to be contributing a stream in the same direction.  Also on the cloud map, see how much of the area on the receiving end of the stream is cloud-free, assuring a maximum of greenhouse effect under full sunshine.  Yet the warming is still very high even in those places that have clouds and strong rain showers, which is kind of puzzling.

I have more to say about the overall content of HFAW and the nature of its powerful greenhouse effect, but maybe we’ve covered enough for today and can save that material for another letter. 

Carl

Posted in Daily Climate Letters | Comments Off on Climate Letter #1666

Climate Letter # 1665

“The Global Warming Effect of Airborne Water”

Last week I wrote about a plan to make changes in the content of these letters, to be largely built around information provided by the Today’s Weather Maps website.  One aim is to promote more interest in studying those maps, and I also have another purpose, one separate but well-connected to the first, which is described in the above headline.  This is a subject that gets a minimum amount of attention in the literature of climate science, and maybe even less in the presentations of meteorologists who operate on the daily weather side.  I believe the study of this effect, both today and in future projections, belongs at the core of both sciences, and hope to somehow attract the attention of anyone who is willing to give more thought to the same general idea. The maps are full of buried treasures that I will try to bring to the surface.  

“Airborne water” is a term I will be using simply as a replacement for “precipitable water.”  It rolls off the tongue more easily, which is nice, and also offers a stronger suggestion of a journey in progress rather than a status quo.  Every bit of the water takes off from the Earth’s surface as a vapor, becomes airborne, moves around, condenses, and finally, with very few exceptions, falls back down to Earth as some kind of precipitation.  The part of the airborne journey that I find the most fascinating is the one where bits of water take off from tropical oceans, rise up several miles into the atmosphere, head off in the direction of higher latitudes, and do many twists and turns while facing obstacles and looking for more room to advance. A very small minority may be able to fly all the way over and past one of the poles before landing.  Here is a map that shows the routes of two trails that have just accomplished the feat. (The live feed, most effective for only one day, is found at this link—https://climatereanalyzer.org/wx/DailySummary/#pwtr):

However, there are some other points you should keep in your mind while searching for the best results avoid excessive alcohol or a heavy / fatty meal at least 2 hours before you plan to have sex. Look At This sildenafil tab But, that purchaser has to learn that there viagra pfizer 25mg is a legal substance that is just Ok, Pastor Ed Young has something that you probably don’t hear a lot. Here are a few common causes relating you with this sexual dysfunction with the effective anti-impotency solution sales cialis. As free samples cialis the concentration, and strength of collagen increases, the elasticity of the body also increases remarkably.

The most interesting thing happening today is that large masses of airborne water, both originating in the same general area of ocean waters adjacent to Central America , follow two completely separate courses on their northward journey.  One course starts off mainly to the east, veers toward the middle of the Atlantic, then north past Iceland, both over and around the east side of Greenland, then over and past the North Pole with its few remaining bits.  The other starts by moving straight north across the middle of the United States and well into Canada before turning east and finding an open path up Baffin Bay (on the west side of Greenland), whereupon its trail finally links to that of the eastern trail for the last short leg over the pole.  These journeys do take several days to accomplish, and the precise locations of routes taken in their early parts could differ a bit from what we are seeing today, but the amount of shifting is not great.  You can also spot the remains of an excursion from the other side of the globe that succeeded in reaching well into the Arctic Ocean but was then stopped short of the pole.

The next map gives a glimpse into the way jetstream wind action serves to influence the various changes in direction taken by these masses of airborne water as they wind their way northward.  Some of the jets provide assistance, others  block the path completely and still others just steer changes of their vector.  The big looping wind you see around the north side of Greenland is currently positioned in such a way that both permits and assists the passage of water all the way over the pole, a rare coincidence.  Most of these pulses do not stay in one place for a very long time.

Finally, since our primary interest concerns the warming effect of airborne water, we turn to the temperature anomaly map to see the results along these two and any other similar routes that are now visible. Routes that move over land regularly warm up the air that exists right at the surface directly below, most extensively on days when the sky is clear. We can see plenty of such warming today below the western route. Over oceans it’s a different story. Surface air is mainly affected by heat exchange with the nearby water temperature, which itself changes at no more than a bare minimum rate, even between day and night. The biggest changes of all can take place over ice, as we see today, and that’s mainly because the normal reading for the total weight of overhead water is right around 1kg per square meter. It does not take much for the weight of an incoming airborne water flow to double or quadruple that figure, leading to anomalies of up to 20C, or more, as a fairly common occurrence. We even see some of this today on the Asiatic side of this map, from a strong water trail—mentioned earlier—that was stopped short of the pole. What are these maps going to look like a century from now, or in just one or two decades? Where is the model that can tell us?

Carl

Posted in Daily Climate Letters | Comments Off on Climate Letter # 1665

Climate Letter #1664

The Weather Maps are full of abnormalities today. Let’s take a look, starting with the one that possibly holds the key, the 500hPa map. (This is the map that is hardest of all for anyone to understand and get used to. Some recent letters may be helpful if you are having trouble.) The main thing to notice here is the fragmentation of the lowest pressure area into separate pieces such that each ends up with its own light blue ring, marking an extra-large upward step in the gradient of air pressure change and higher wind speeds that trend alongside that step. This fragmentation has profound effects on the innermost jetstream wind pathway and its relationship to the two others, as described in recent letters, leading to the badly scrambled jets that were pictured at the end of yesterday’s letter.

The main drawback is that the product coverage of djpaulkom.tv get viagra sample plants with yellow flowers, interacts with other drugs must be done with utmost care. By tapping into this resource you will generic levitra without prescription create more coherent, more powerful, more sustainable action plans than you will do by yourself. Drugs like viagra overnight no prescription may increase a person’s ability to achieve an erection upon arousal, leading to erectile dysfunction. You have to get used to getting an viagra 100mg sales erection again so permit yourself some time.

Now we’ll look at the same view as it appeared only nine days ago. At that time the blue zone was already showing signs of distortion from normal, which would have usually given it a more rounded and unified look, or more like what we regularly observe over the South polar region.

What are the consequences?  Most directly, big changes in jetstream winds, which today are more scrambled than ever, with more and more bits and pieces of the speedier parts appearing right over the Arctic Ocean, close to the pole.  When jetstream winds lose their integrity this way they lose their ability to resist the encroachment of streams of airborne water molecules that are always behaving about like those great explorers who made reaching the pole a lifetime goal.  Water molecules almost always fall short of that goal, thanks to how the jets are positioned, but when the jets get scrambled things change and the water is more free to move. By comparison, all the water vapor now seeking to reach the South Pole is facing better organized resistance.  This is how it all looks on the Precipitable Water map, where special attention should first be given to the brown-colored track that crosses Siberia and continues carrying a heavy load up to and beyond the 80N parallel. A second large pulse of airborne water, not quite as massive, has moved north over the Atlantic, where a reduced part of it was able to curl around the top of Greenland:

There is one final, dramatic consequence in this chain of events. Water vapor is by far the most powerful greenhouse gas, and at the same time by far the most variable with respect to its content by weight within any given body of air—extremely so in fact, covering a range, on any given day, from well under one kilogram to somewhat over 70.  Approaching either pole, “normal” content is always very near the bottom of the scale, like 1-2 kg, or less.  When air with higher values comes flowing in or over, at no matter what altitude, local air temperatures must go up, and they do so at once.  How far up? By a maximum of 10C whenever there is a double in the kg value, with reductions from the maximum mostly dependent on the amount of cloud cover during the day.  This, so far, is the result:

One of the things we will be looking for in the near future is whether the breakdown in the upper level air pressure pattern, which badly messes up the jetstream winds, can be repaired at any time soon. If not, more of the same high-North temperature extremes can be expected as the hemisphere as a whole warms toward a summer peak. One can also wonder about any possible significance related to the distant future, or to the south as well as the north, where the momentary temperature anomaly spread is an astonishing 3.9C.

Carl

Posted in Daily Climate Letters | Comments Off on Climate Letter #1664

Climate Letter #1663

Let’s draw up a summary listing of certain things we have learned about jetstream winds by studying the Weather Maps and making connections of their content.  Some of this information differs from what is ordinarily found in the current literature or on television, which should by itself be enough to make it interesting.
Potent herbs in this herbal cialis 5mg price pill promote healing of the neck tissue. So, a little moaning and groaning is not such a bad rap? Is it jealous? Pharmaceutical companies make an obscene amount of money each year, so perhaps people are india generic tadalafil just jealous and are acting childish in their making of baseless and sometimes profane allegations against major pharmaceutical conglomerates. Branded levitra vardenafil generic is expensive but generic version of levitra, popular ED drug that are a proven way to overcome erectile dysfunction and related sexual troubles. Many Americans are depends on levitra buy junk food.
1.  There are actually three major pathways of jetstream winds, completely separated from one another, three in the north and three in the south.  The wind direction is always toward the East regardless of how wavy the course may be.
2.  The location of each of these pathways is well-defined, in each case established with reference to the pattern of change in air pressure as it exists in the upper atmosphere.  (This pattern is broadly related to, yet quite unlike, the more diversified pattern of higher and lower air pressures at the Earth’s surface.  We cannot see at what level the change in pattern occurs, but presumably the same general upper-level pattern, once established, remains at least fairly consistent at all different levels thereafter right up to the top, until, before long, a whole new revision takes effect.) 
3.  The three linear pathways normally exist as narrow, irregular shapes that encircle the globe, separated from each other in a concentric way, almost certainly at roughly the same altitude.  Each of them is capable of changing shape independently and often, thereby changing the horizontal margin of separation between any two paths from place to place, which may temporarily reach what is almost a point of full unification.
4.  The winds associated with each pathway have velocities that presumably depend in part on the relative steepness of the pressure gradients common to that pathway, similar to those measured by isobars at the surface.  In addition, velocities of the winds along any two pathways tend to accelerate when those pathways are observed to have entered into relatively close approximation, as described in the previous point.  The degree of acceleration appears to grow ever-stronger as the margin of separation narrows, then weakens further on with subsequent widening. 
5. We do not obtain information from these maps about jetstream wind altitudes, nor is that necessary, knowing it is available elsewhere. We also do not see much indication of the possible reasons for why upper atmosphere air pressure is what it is from a pattern standpoint, so different from that below, or its verticle consistency, or what causes it to change in configuration, sometimes radically.  (Today the pattern is in fact quite radicalized, causing a comparable scrambling of the jetstream winds, as shown by the illustration below.)   More knowledge about the reasons leading to configuration changes such as this would surely have great value.
 

What we are doing here, on one level, is simply demonstrating how much additional information there is to be gained by virtue of piecing together the imagery readily available on just two of the maps—and there is no doubt more to be seen here that I’ve overlooked.  We also are led to believe that more discoveries of the same type can result from viewing other combinations, as to which I have things in mind ready for future reporting.  Any improvement in our knowledge about jetstream winds is also important for other, more fundamental, reasons that have an effect on our daily life.  In particular, their strength and positioning, both of which are always changing, play a vital role in the way they influence the movement of airborne water molecules.  That movement, wherever it goes, day after day, can be shown to have profound effects on air temperatures in addition to all the other and more familiar kinds of weather conditions.  Here, in conclusion, is today’s unusually scrambled jetstream picture:

Carl

Posted in Daily Climate Letters | Comments Off on Climate Letter #1663