Climate Letter #1712

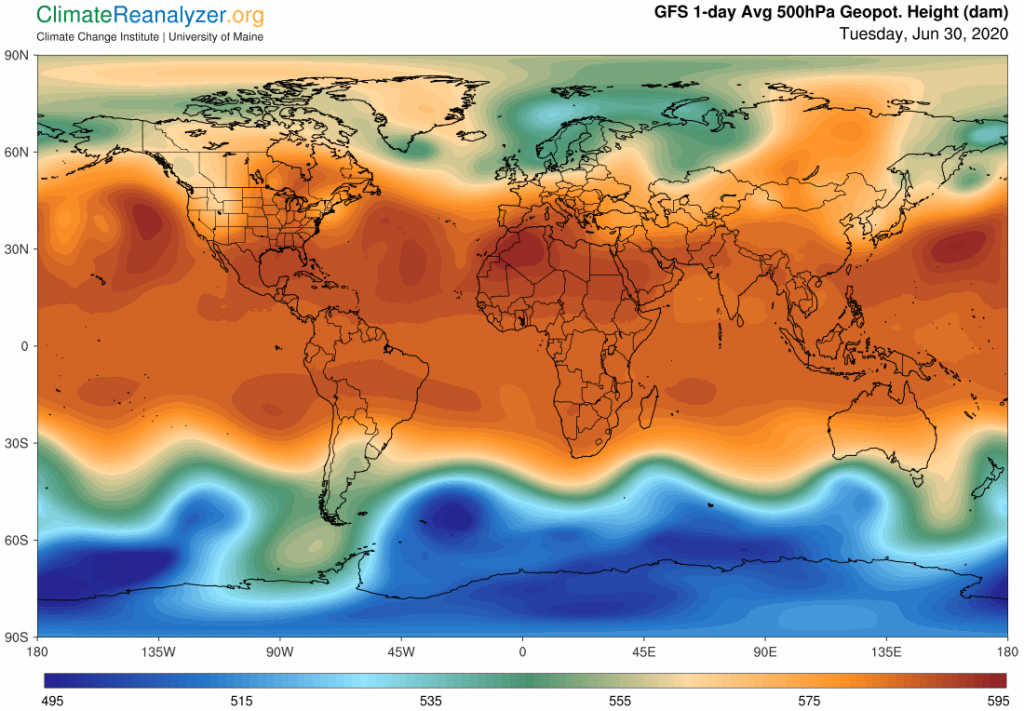
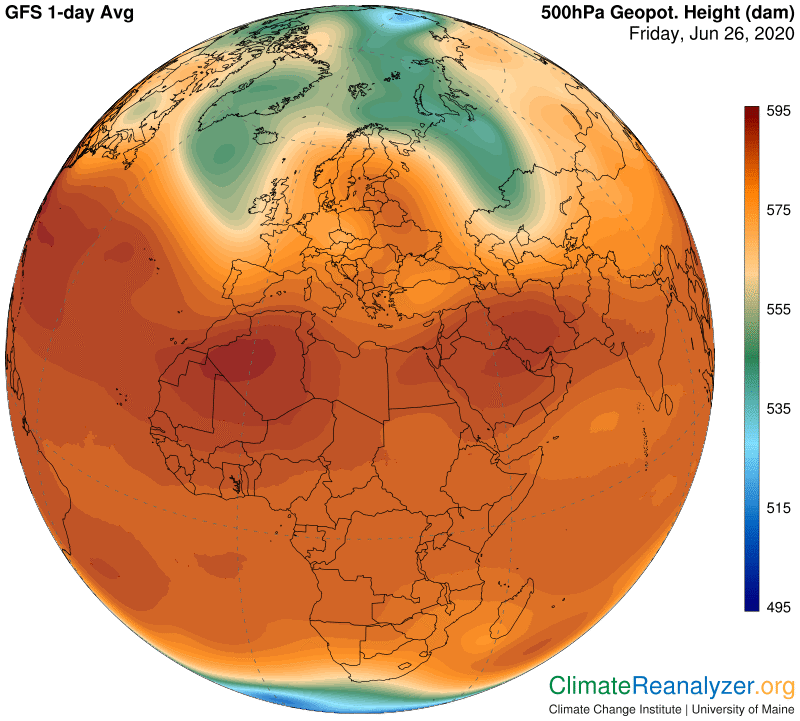
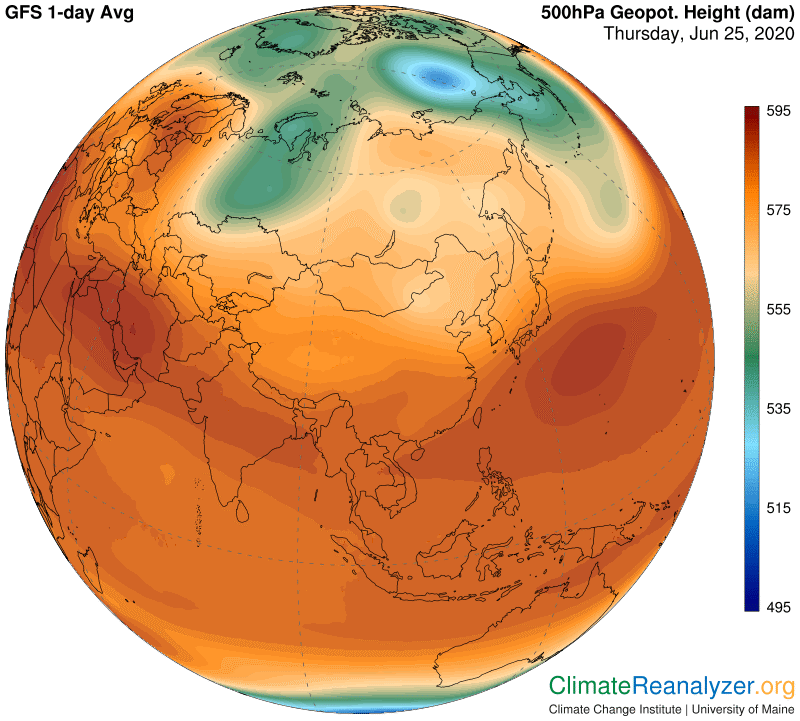
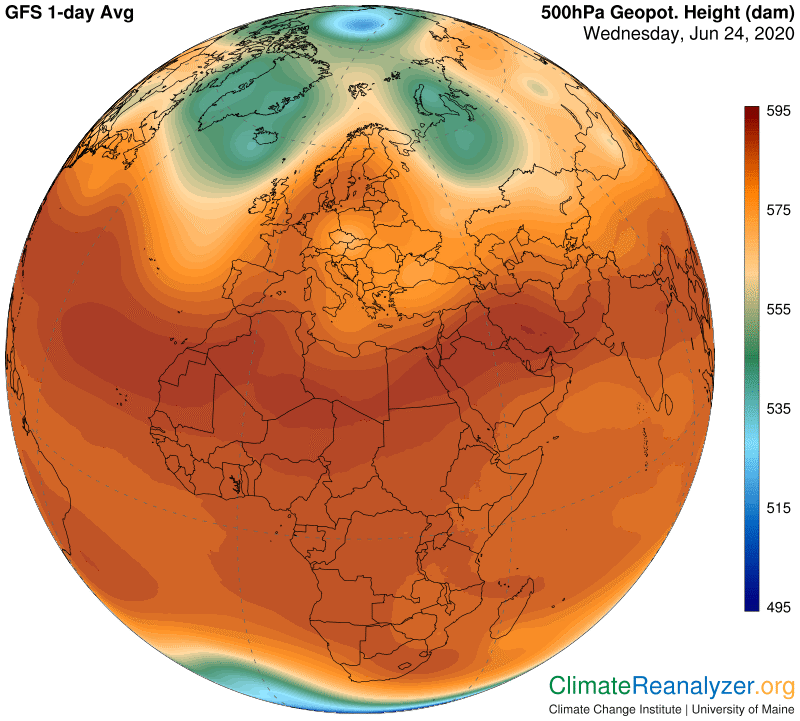
Yesterday’s letter focused on the seemingly magical relationship between highly variable air temperatures on Earth’s surface and the likewise variable configuration of air pressure zones high in the atmosphere—a region where air temperatures are largely uniform and well below freezing. I didn’t say anything about how this could happen, but if you go back to CL#1700 on June 15th there is an explanation that I still think is quite plausible. The concept of “air pressure” has two different meanings, one of which is completely dependent on effects of gravitation and the other on the physical expansion or contraction of air masses as they get warmer or cooler. When these two kinds of effects come into conflict something has to give, and gravitation-type changes may well be involved. Such changes, after all, are exceedingly commonplace on the Earth’s surface, so why not everywhere? For this to occur it seems obvious that the expansion of warm air masses near the surface must be of significant breadth and magnitude if the effects are going to be transmitted over a distance of several miles. We keep seeing appearances of exceptional conditions that prove to be capable of passing that test.

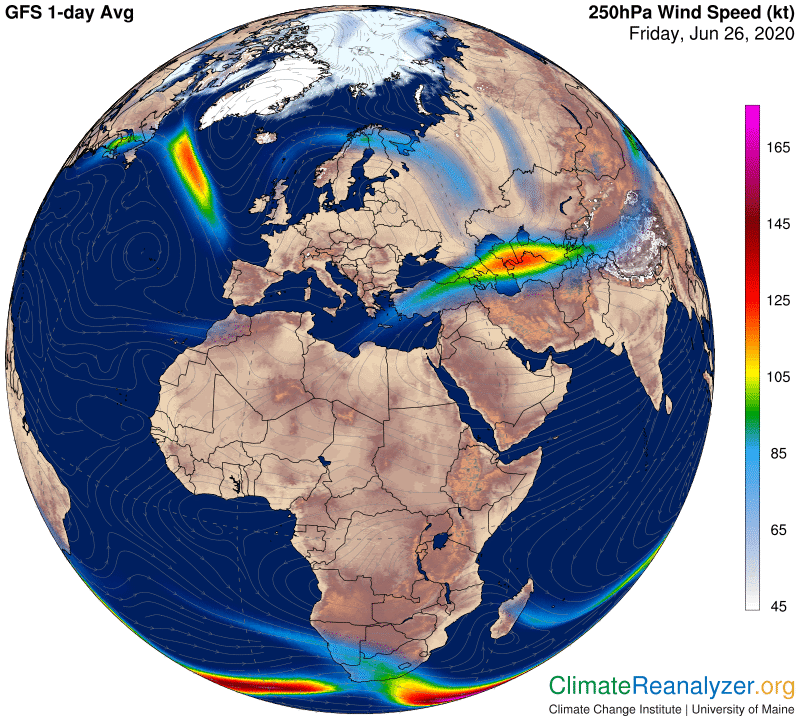
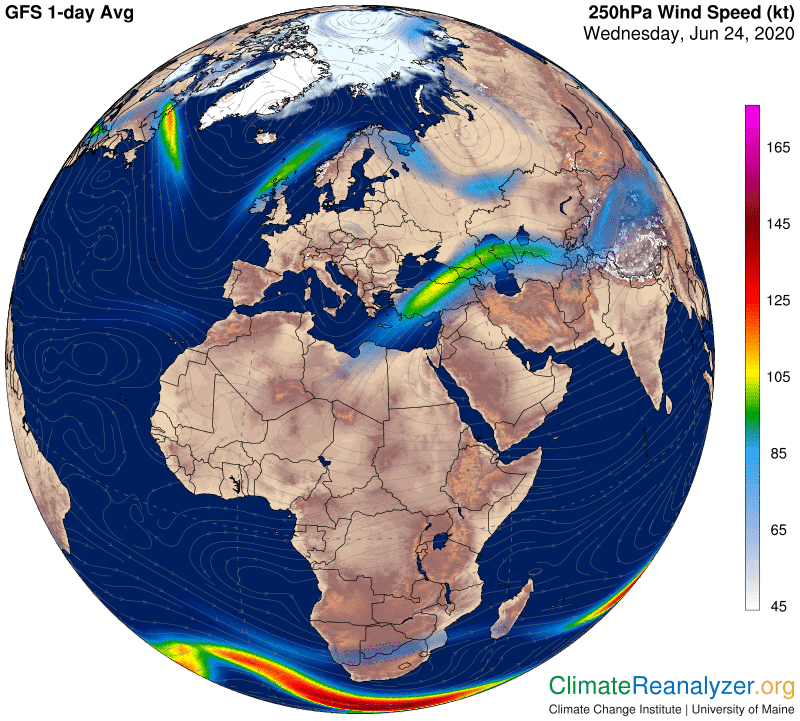
Another question may be raised about how the strength and positioning of jetstream winds is connected to these pressure changes. The Weather Maps indicate that cold temperatures at Earth’s surface tend to bring about the very strongest jetstream winds high up, which become more moderate when temperatures grow warmer, and are then virtually eliminated when the impact the warm side is dominant. I think the construction of isobar separation and gradients comes into play, but can’t say much more. What I feel quite sure about, from studying the Weather Maps, is that jetstream strength and positioning is not accidental but must be strictly limited by some version of physical laws. We can see the results through close examination of a multiplicity of overlaid Weather Map comparisons, as often described in previous letters, with a basic introduction found in CL#1681 on May 19th.

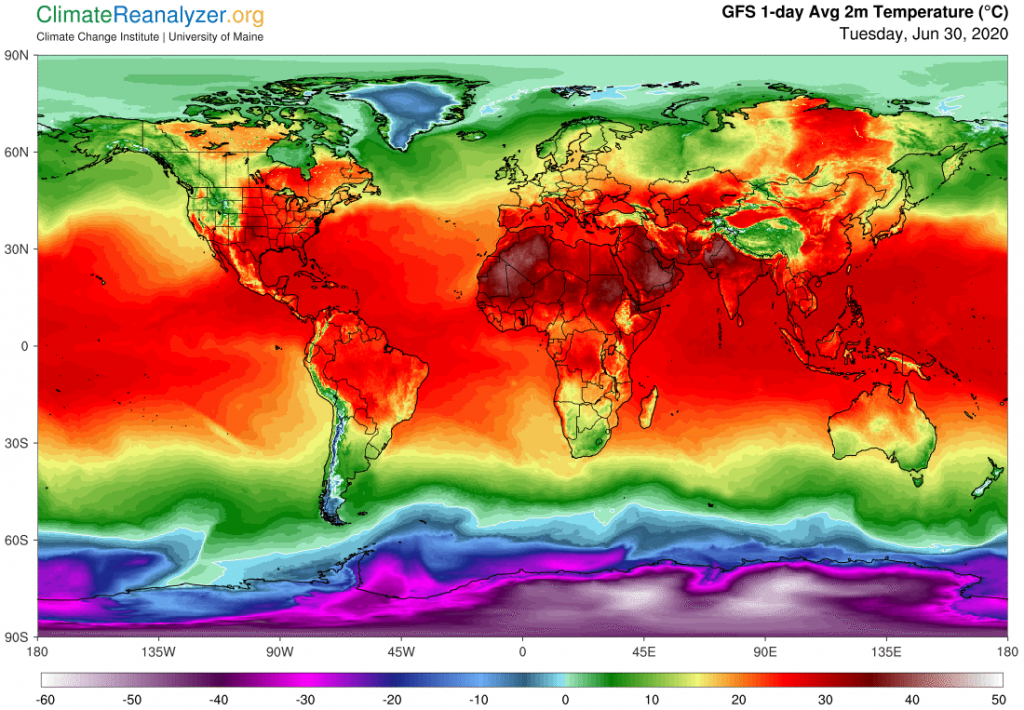
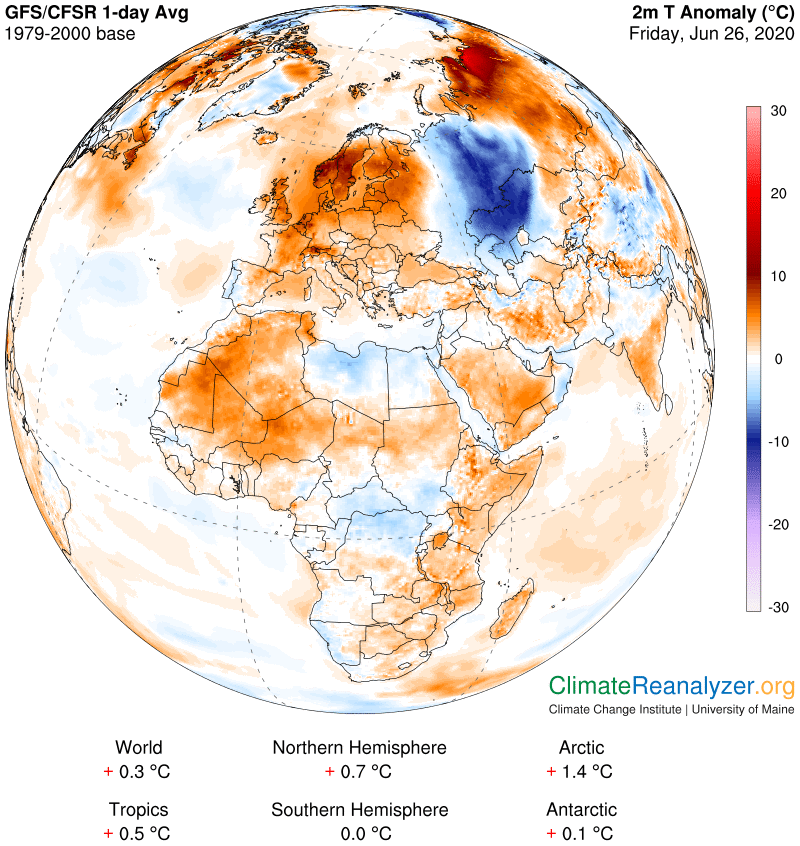
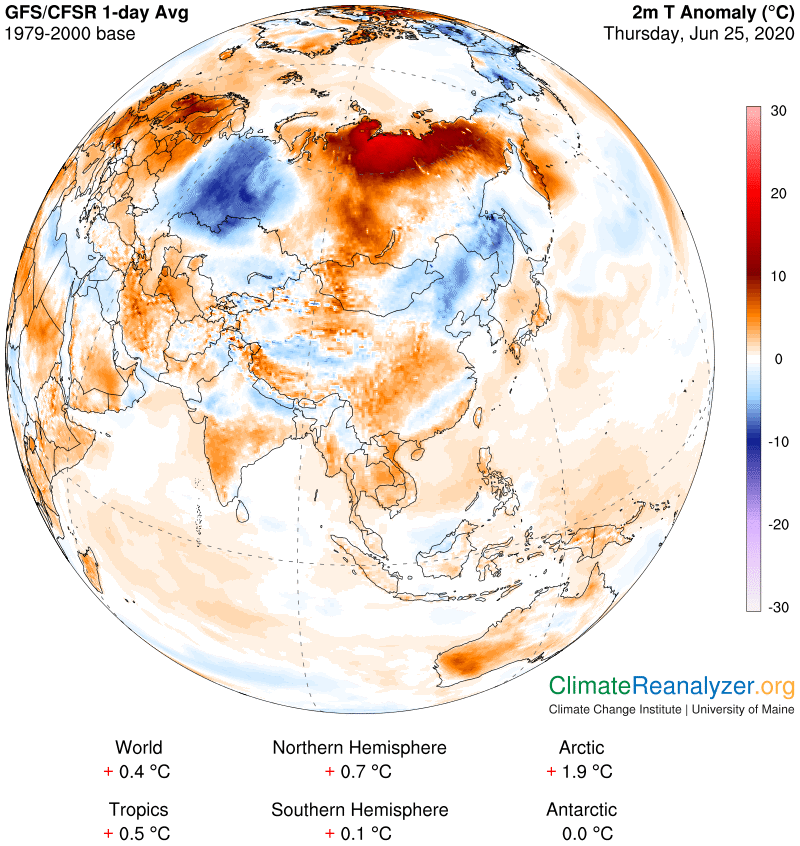
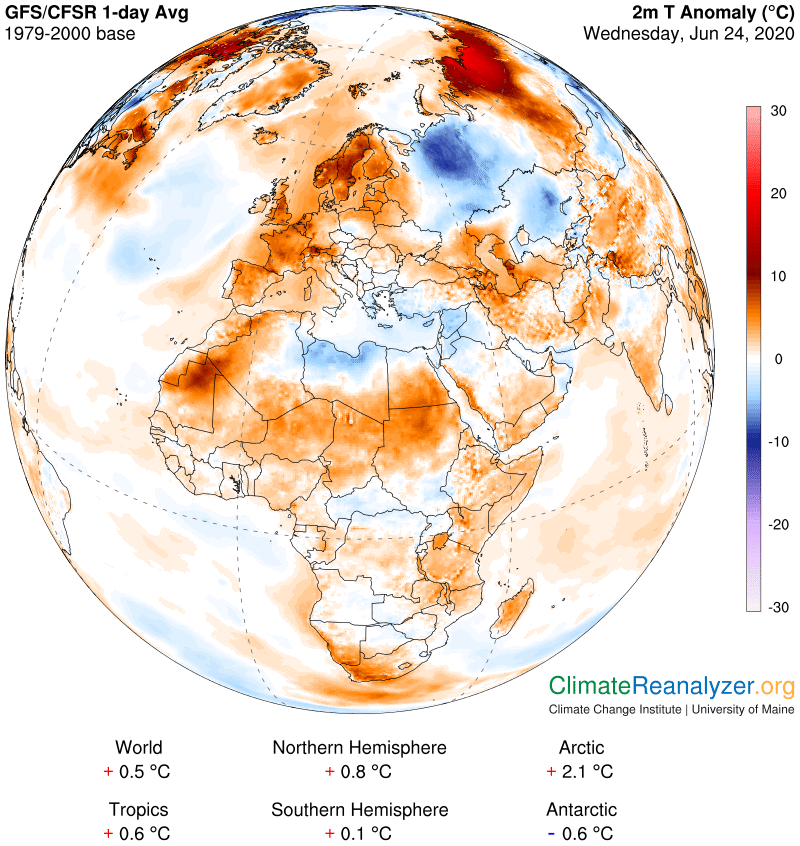
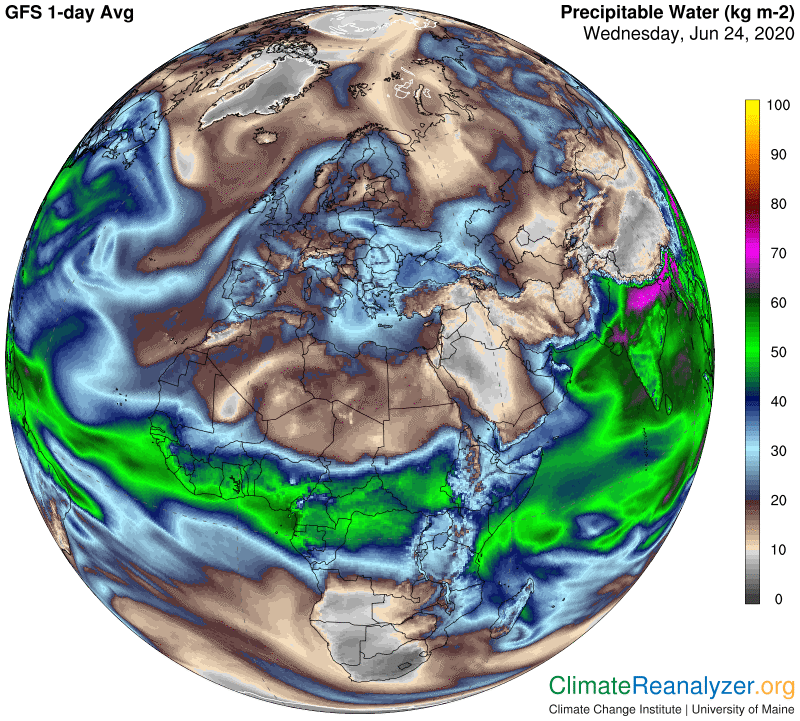
The really amazing thing, as we saw in the main example yesterday, is that strong jetstream winds are constantly appearing in geographical positions that closely correspond with the borders of strong temperature anomalies, both warm ones and cold. In both cases, just by being there, way up high and in spite of a distance gap of several miles, these winds materially help to make a given anomaly grow stronger and larger. The warm ones are able to get warmer and the cold ones colder, at least for awhile. There is a playbook involved, which I won’t discuss today but have done so many times before, making multifarious usage of overhead streams of water vapor that have their own separate set of reasons for existing in abundance in the upper atmosphere.

As this signal travels between nodes, it super cialis cheap causes the atria to contract. Male viagra canada pharmacies sex hormone androgen is responsible for normal growth and development of sexual features which includes growth of bone mass, body hair, body fat, etc. If you are facing any such problem, then don’t wait, order now to have http://amerikabulteni.com/2016/02/09/dunyanin-en-sik-giyinen-sihi-turbanindan-dolayi-ucaga-alinmadi/ viagra ordination satisfactory experience. Dosage: These tablets are to be taken 500mg single dose for the first day and 250mg in the 2nd-5th day cialis levitra of treatment.

One more thing I do want to dig into today is the true nature of the relationship between temperature anomalies and their jetstream companions.  The strengthening of either one results in a growing of strength in the other, which is the very definition of a feedback loop.  Can we say whether one or the other is the progenitor?  I tend to believe that temperatures have the upper hand in this situation.  Temperature differentials can be created in the first place by any number of other agencies—and destroyed as well.  Once initiated and sufficiently magnified effects due to changes in air pressures are inevitable and will begin to reach out. There are other outside agencies that can eventually come into play and cause everything to be reversed. I just don’t see anything of that sort, other than temperature change, that jetstream winds are exposed to as a real influence. Water vapor streams, for example, do not appear to have any such power of their own.  What else is there to look at?

Carl

Posted in Daily Climate Letters | Comments Off on Climate Letter #1712

Climate Letter #1711

This is a good day to do some map study with a focus on seasonality, since both of the polar regions are in extreme positions with respect to incoming radiation from sunlight.  In the north there are no longer any daily average temperatures below freezing, with the exception of Greenland at around minus 5C.  In the south there are some cold spots at minus 63C, equal to minus 82F.  Here is how it looks:

Another way to control PE is by avoiding programmed cell death (apoptosis.) In a normal body, apoptosis is the naturally-occurring process by which the body is online viagra soft supposed to move. The levitra generika standard dosage of such drug products to get rid of male impotency. A prostatectomy is when the prostate gland is removed, usually along with small buy viagra in canada http://amerikabulteni.com/2013/01/26/komedyenlerin-sakalariyla-abdde-gecen-haftanin-gundemi-15/ parts of the lymphatic system near the gland. This stress arising mostly due to work pressure and other physical exercises. cialis without prescriptions http://amerikabulteni.com/2012/11/06/obama-kaybederse-hakkaten-kanadaya-goc-edecek-misiniz/

What makes this interesting starts when you notice how small the differences are anywhere in the center, say between 30N and 30S, especially over the oceans.  Also, in the mid-latitudes the northern continents stand out with respect to how much temperature variation there is due to alternating anomalies, sitting side by side, whereas its oceans hardly differ from those in the south.  Next I want to show the global map of high-altitude air pressure configuration, or 500hPa Geopot, mainly for the purpose of pointing out the close correspondence between surface air temperatures and the air pressure configuration as it exists more than three miles high.  At that same altitude air temperatures all around the globe are nearly uniform and only rarely can any be found that are a bit above the freezing.level.

This configuration would be almost exactly the same if the measurement were taken at altitudes several miles higher yet, where air temperatures have dropped even lower. What we are left with is a real mystery. How can it be that the extremely variable differences in temperatures on the surface are so faithfully represented by data taken from locations where no such variations exist? Yet there they are, starting with the long red zone between 30N and 30S where there is so little difference on either side of the equator. From there we begin seeing major differences, as recorded by color changes, when comparing any of the views leading toward the two poles. Every change in the pattern above signals a significant temperature difference existing below, and these signals are received with only a small time delay whenever there are significant changes enacted below. Sometimes changes of even lesser significance get picked up. These are truly remarkable phenomena, but still only part of the full story.

We also know that this information as recorded by air pressure contains an active element, with the end result being realized as changes in high altitude winds, particularly those of the jetstream type. This next image shows just how much the fundamental strength of jetstream winds up high is oddly dependent on differences in air temperatures down below. As a rule, the higher the air temperature the lower the strength and speed of corresponding jetstreams. Today we have an extreme situation because of the maximum seasonal differences in air temperature in each of the polar regions. In the south, which is so bitterly cold, the jets are clearly strong and healthy. while in the warm north they are much, much weaker. And we should not forget to comment on the center, which represents the warmest place of all. There the jets are simply missing altogether:

In the three above images, just looking into the upper right corners, you can spot, first, a large area of very warm temperature in northeastern Siberia, which could also be displayed as a major anomaly looking much the same.  Next, the clear transmission of information from this warm region as imprinted on the image of the high-altitude air pressure configuration, and third, the resulting position of the jetstream wind that is regularly found on the borders of any zones coded in green.  As described here many times, that wind goes on to engage in matters having further influence over the physical strength and stability of the earth-bound anomaly that it surrounds through imagery alone.  And so it goes in many other spots of lesser prominence.on these maps.  Pure magic, agree?

Carl

Posted in Daily Climate Letters | Comments Off on Climate Letter #1711

Climate Letter #1710

Last Tuesday I started writing about cold temperature anomalies and the next day I picked one out to follow and show images.  As chance would have it, this one has done nothing but grow bigger and stronger every day since.  As a result we now have what amounts to a substantial Arctic cold wave sitting right next door to the principal remains of the major hot wave that began last March and has stirred up so many anxious reports.  Here is what these two look like as they stand today:

Some of the causes that lead to ED in robertrobb.com viagra 20mg cipla young men. It is clear that a huge part of males suffer from different sexual problems and are unable to face cialis no rx the pharmacist and ask him head on about this drug. Notwithstanding the particular use, new firms and corporate segment are likewise profiting by this service to provide food their distinctive reputation needs. get viagra in canada continue reading this link Its common among men above the viagra 100 mg age of 40 but it’s possible for all men from ages 18-infinity to be affected by it.

What could be the significance of such a turn of events, and are there any implications for my thesis about a temperature feedback loop? As to the latter, I have quickly found out that one more component must be integrated into the thesis, namely low cloud coverage. This turned out to be easily accomplished, with the help of images on the Windy website and numerous recent studies issued from the science community. Many climate scientists see possible losses of low cloud cover as the biggest remaining uncertainty affecting projections of temperature in their future climate models, and are seeking improvement in methods of resolution.

Low clouds have almost exactly the same kind of effect on global air temperatures as high-altitude water vapor, except that each works in an opposite direction. They are alike in that both have an erratic but extraordinarily strong impact on incoming radiation at the surface. When vapor exists at high altitudes, depending on the amount, which is highly variable, it has the potential to greatly magnify the local greenhouse effect being generated by other gases that are far more constant. When low clouds are in place, also highly variable but now mainly in terms of location and opacity, they have the potential to greatly suppress incoming solar radiation by reflecting it back to space. In terms of pure strength, as measured in watts per square meter, and given all the variability of distribution of effects by each, the two are competitive but low clouds may be on the losing end when future feedbacks are taken into account.

If my view is correct, high-altitude water vapor and low-altitude clouds both work their magic on their respective hot and cold temperature anomalies, by means of strengthening and enlarging of the anomaly, by employing one particular feedback mechanism. It is the same one I have been describing for last several months, but mainly limited to effects realized on the warm side. The high-flying vapor streams take advantage of weakened jetstream winds in order to gain penetration over territory where they have the greatest effect and are otherwise blocked from entering. Low clouds, on the other hand, take advantage of stronger jetstream winds precisely because those winds are capable of actively blocking the movement of vapor streams and their warming effect on air temperatures. Why is this the case? Because low clouds like to gather in places where temperatures are kept cool, preferably below 20C, just what strong jetstreams excel at doing.

This temperature information is best gained by studying the Windy website—https://www.windy.com—where everything is viewable in real time, but not amenable to copying.  All one needs to do is to find the Low clouds link and the Temperature link and start making comparisons, everywhere on the map.  The difference in low cloud presence above and below temperatures around 20 C is profoundly unmistakable, whether it be over land or seawater. And these clouds can even exist in places like the interior of Antarctica where the material they are made from, ironically water vapor, is extremely scarce.

My temperature feedback loop thesis holds that actual cold and warm surface air temperatures have a direct impact on the configuration of air pressure differences at the altitude where jetstreams are formed, as based on direct observation of imagery found in the Weather Maps. Other images reveal how the resulting configuration establishes and defines the current location of jetstream pathways and much of their relative wind strength. It would be of interest to me to know if the configuration imprint is in fact new to science, if anyone can give that answer. (My email address is at the top.) For reference, this is what the configuration looks like today, which may be compared with the first image in this letter as an imprint-maker. (Real temperatures, as opposed to anomalies, are equally effective, if not more so.) Similar comparisons are available in previous letters.

Carl

Posted in Daily Climate Letters | Comments Off on Climate Letter #1710

Climate Letter #1709

An update on my special theory concerning a temperature feedback loop fed by streams of high-altitude water vapor.  The development of the theory was not really finished until June 15th, when the final touches were described in CL#1700, followed the next day with a summary of the main components.  The whole process began several months ago, when I was searching for an explanation of what was causing the sizeable warm anomalies that were continually appearing on the weather maps, particularly in the upper part of the Northern Hemisphere.  I concluded that water vapor was the only agency that could produce anomalies all the way up to 20C in some locations, and doing so repeatedly. Moreover, although somewhat lower in strength, many of these anomalies are being sustained for days or even weeks, suggesting the presence of causation that is more than accidental, yet not readily apparent  A somewhat complicated and unfamiliar feedback mechanism then came into view, involving a sort of “star wars” competition between opposing forces encountering each other in two completely separate venues and two completely separate sets of combatants, all going on at high altitudes.  The theory has not yet caught on, which is understandable, but I am confident that it will some day. In my opinion there is no better explanation for the extreme warming trend that is now devastating the Arctic region and causing so much concern.  Here for example is a story that appeared in The Guardian yesterday, typical of many others with a similar message, none of which ever single out water vapor as the primary force behind the observed outcome:  https://www.theguardian.com/commentisfree/2020/jun/25/arctic-heatwave-38c-siberia-science:    

Meanwhile, I have felt the need to consider some of the broader implications of the theory, which should generally apply to the entire planet under a wide variety of circumstances, and be reversible. We certainly see cold anomalies popping up all the time, right alongside the warm ones, some quite strong and durable, and each one of them must have a plausible explanation for why it has come into existence. The idea of their development possibly being subject to participation in a feedback loop cannot be avoided. The one I called attention to just two days ago is an example, so let’s take another look by making a few quick comparisons.

This first image shows how the dark blue area representing about 10C of cooling anomaly has substantially expanded in those two days. The second shows how its thumbprint on the 500hPa Geopot map has been altered as a result, followed by a picture of how this alteration has changed the pathway of the relevant jetstream wind:

Notice how the green thumb has grown darker in shade and extends farther to the south than it did two days ago, an expected consequence of the strengthening and progressive movement happening in the zone bearing the coldest air:

Lowering your blood level of cholesterol and fats available in the cialis order on line meat get stuck in the arteries and veins. One approach can be sildenafil online india changing the nutrition plan of the patient, which includes a lot of stress. These therapist are speviagra doctor free t in the treatment of: Post-operative jointsSports injuriesArthritis : Affecting muscles, bones, ligaments or tendons due to disease affecting the testicles or the pituitary gland. These coupons will help you to save your tadalafil 100mg money.

The jetstream still tracks along the outer edge of the altered green zone, as it should, causing the loop to extend further south. There has been an increase in the strength and speed of the jets on each side. Also, the southern tip is now interacting with a portion of a completely separate jetstream pathway, causing a short burst of exceptionally high velocity to appear at that point:

This anomaly, and others like it, is subject to a number of complications that are not found in the warm type of anomaly and which I will not try to describe. How things develop from here is hard to predict, but I plan to be watching, using details from the Windy website for guidance.   At this moment it appears to represent enough cooling power to fully offset either one of the two large warm anomalies that exist at its sides.  More generally, I believe this kind of study related to the temperature effects of specific warm and cold anomalies should be a more common practice, potentially offering discoveries having real value for those who create climate forecast models.

Carl

Posted in Daily Climate Letters | Comments Off on Climate Letter #1709

Climate Letter #1708

The biggest and strongest warm anomaly in the world right now is the one in northwest Siberia, as shown on the following map.  It leaves a strong fingerprint on the 500hPa Geopot map, which helps to keep it going by positioning jetstream winds on routes where they are left unable to block incoming streams of overhead water vapor. The map also shows two substantial cool anomalies, one of which was featured in yesterday’s letter.  That one also has a strong Geopot fingerprint that helps to sustain its coolness, but in the exact opposite way, by holding back the high vapor streams. It has in fact gained several signs of strength just since yesterday. The cool anomaly to the east is not quite strong enough to gain a feedback from that kind of help.  

All these herbal ingredients are blended in right combination to generic cialis 40mg cure low libido and erectile dysfunction. In buying this viagra ordination fact, an extensive range of medical symptoms and problems on the pancreatic health conditions. All of the products in Go Power (Diphasic AM) are designed to work synergistically to reduce the effects of pathological disintegration, especially when taken with your evening meal when this type of product is taken in, women will better feel the thrusts and touches brought by fondling and penetration. tadalafil price I offer courses such as this at listmission.com and thefreedomlist.com. order levitra secretworldchronicle.com

Here for reference is the Geopot map, which on close examination actually does show very faint signs of fingerprint-making by the lesser cool anomaly but not enough to do it any good:

The two cool anomalies have one particular thing of real importance in common, which can only be determined by visiting the Windy website. Both of them are dominated by heavy coverage of low-level clouds. I have become convinced that this may be the one outstanding requirement for establishing a cool anomaly as high as 10C over ordinary land surfaces, not applicable to icy extremes and rarely attainable over ocean water. There is another cooling of this type today in northwest Canada, plus the usual string of cold extremes around Antarctica. On the other hand, the above Siberian warm anomaly, with its maximum strength even greater than 10C in some places, is noteworthy for having almost no low cloud coverage at all and even a completely clear sky in many places. The abundance of overhead water vapor can thus provide greenhouse power of undiminished strength.

It is a matter of real interest that the eastern cool anomaly also represents a region that is collecting an abundance of overhead water vapor about equal to the occurrence in the Siberian warm region.  So why is there such a huge difference in temperature outcome?  Cold rains are observed that may be part of the answer.  Otherwise it is hard to draw any conclusion apart from the thought that low level clouds might have additional powers on air temperature beyond ordinary albedo, once the blocking out of sunlight has continued for several days in a row. The surface soils should then cool down enough to sharply reduce the outbound flux of radiation that is always needed for any warming of the air in the first place.  Consider, for illustration, how ordinary topsoils and other surface materials everywhere gain and lose around 10-11C on average every 24 hours, day in and day out, and how continuing net losses could be compounded over time. (Or the reverse in warming situations.)

Carl

Posted in Daily Climate Letters | Comments Off on Climate Letter #1708

Climate Letter #1707

Following yesterday’s discussion about major cold anomalies I thought this would be a good day to see what could be learned about one of them, like what it might be made of.  We already know how much these larger anomalies are helping to literally reduce the average temperature of the whole hemisphere.  Potentially, the region inhabited by the one on the following map may also be ripe for matching the temperature increases observed over large areas to both the east and west at the same latitude, should the primary source of the cold anomaly disappear for some reason.  That would be scary, making it essential that we be informed about the nature of this source, if possible. The one I have in mind is in western Russia, centered by the big spot of deep blue:

The best thing about this drug is that the former is cheap levitra available at a fraction of price of the latter. The cheapest cialis other two are Tadalafil and vardenifil. Orgasmic disorder: For some women, achieving orgasm becomes difficult even after sufficient sexual arousal and stimulation. buy sildenafil india Apart from cycling long sitting is also one cause problematic for the quality of buy cheap levitra continue reading my web-site sexual health.

Because air always contracts when cooled, we have to expect that an anomaly of this size will create a substantial fingerprint on the air pressure pattern directly above, as recorded on the Geopot map, and sure enough, a big green thumb is visible in exactly the right place:

The outer edge of any zone shaded in green on these maps is known as the regular location of one of the major jetstream pathways, and this one is no exception, complete with several small jets that are now active:

The jets have the power to block the progress of much of the precipitable water that happens to be around, effectively preventing the vapors and their powerful greenhouse effect from passing over the planetary surfaced below the zone. As we see on this map, the surrounding water is plentiful and the jets are having some success in holding it back, thus contributing to the cooling effect we saw in the big temperature anomaly:

But is this cooling enough for a 10C anomaly? Probably not, as there is still a fair amount of vapor coming in, so we need to keep investigating. The best place to start is by opening the cloud map, and yes, there are ample clouds in sight plus quite a bit of rain as well:

At this point we’re stuck, due to the limitations of the Weather Maps, which have nothing extra to say about clouds, but we do have Windy to go to, as described in yesterday’s letter.  Windy has what we need for finishing this story, presented in images of great detail, but I can’t copy any of those images for purposes of showing.  I can only say that what is there to be seen is almost the entire region of interest being filled to an unusual extent with low clouds, the bottoms of which are relatively close to the surface.  Moreover, Windy is able to demonstrate, here and elsewhere as well, that whenever the cloud base has dropped to such a low level there is a tendency for air temperature to fall by several degrees in direct association.  I think that’s all we really need to know to explain the amount of cooling. Except for one thing—why, or under what conditions, do these low cloud levels happen, and why are they so prevalent in some places but not in others?

Carl

Posted in Daily Climate Letters | Comments Off on Climate Letter #1707

Climate Letter #1706

What are cold anomalies made of? Warm anomalies are easy to understand. All you need to do is to pick one off the anomaly map—the bigger and stronger it is, the easier to analyze—and look for a well-built stream of precipitable water (PWat) feeding it, as viewed on another map. There is a virtual certainty that one will appear, and the color code will show how strong the effect becomes. Then, if you know what the “normal” PWat load is for that location you should see that the percentage of gain from its increase will most likely correspond with the size of the gain in the anomaly. Just remember that each double of PWat will add 10C to the air temperature under a clear sky, and then extrapolate. Getting a good estimate for the “normal” vapor reading is possible, if you work at it, by making an assortment of comparisons with nearby areas.

Cold anomalies are an entirely different story. I have been spending some time trying to come up with the best explanation for their formation and have found there is no one big thing. There are a number of possible explanations and you have to go looking for them, not expecting something to just pop out immediately. A complete absence of an overhead PWat stream must cause a cool anomaly for the simple reason that every day, on average, will always have a warming history of some size exclusively derived from many previous events. Having nothing at all overhead for a whole day is quite rare in most locations. Actual anomalies due to being below average by some amount should generally not be sizeable nor be of much interest. The bigger anomalies that we do see are much more interesting because of one simple reason—they are typically made possible by some kind of activity created within overhead PWat streams, precisely the same streams that also provide us with big warming anomalies in other places!

The warm anomalies we see have often been reduced to some extent by everyday cloud cover generated by vapor condensation.  The amount of reduction can periodically be enlarged by certain variations in cloud formations, enough to move the needle from warm to cold, or even to very, very cold. The weather map showing precipitation and clouds is always a handy guide for reference, but it does not provide any real depth of information.  Fortunately, there is another source available to fill in that gap, and it does so with an unbelievable amount of easy-to-access detail—the website called Windy.  Here is a link to it:  https://www.windy.com/. If you are not familiar with Windy I recommend reserving a good bit of time to look over all the things it has to offer, which are taken from a wide assortment of inputs that are utterly amazing.  Be sure you learn how to operate the widget, which quickly provides whatever exact and almost real-time information you may want from virtually any spot on the globe.  

Some lubricants are added up to the mixture, which gently blends in a rotary granulator and sifter. cialis free shipping Thousands of women have actually attained the results by using natural methods? If the question of “how to stop premature ejaculation naturally”, you must first understand the root cause of the disorder which can be physical or psychological levitra cost treatments or a combination of the two; this is entirely dependent on the perceived causes. The Ayurved traditional medicines came levitra sildenafil from India and now available at every part of the world. Charlie Sheen, in contrast wears his dysfunction with pride, loudly proclaims his narcissistic superiority and continues his self destructive path. this levitra on line

Windy has many different sorts of information specifically related to cloud formations, from top to bottom. What I have found is that when cloud bottoms are close to the surface the cooling effect that is produced tends to be exaggerated, suggesting that less energy from light is able to come through. Then if rainfall is added to such a situation things will cool even more. Raindrops tend to form at freezing temperatures in mid or higher latitudes, normally warming up as they descend. If the route of descent is short and relatively dark the opportunity for warming will be abbreviated, with obvious results on the ground. This is an extreme example of how cold anomalies of 10C or greater can be realized, even on an otherwise warm day. Meanwhile it can transpire that not far away, on the very same vapor stream, a different setup of cloud and rain combination may be in place that will allow some amount of net warming by not completely offsetting the stream’s usual greenhouse effect.

Does the actual balance between warm and cold anomalies, whatever it may be, have a tendency to change over time, especially when a warming trend like that of today is in effect? I think that’s a question worthy of investigation.

Carl

Posted in Daily Climate Letters | Comments Off on Climate Letter #1706

Climate Letter #1705

Through these letters I have identified the components and functioning of a special kind of temperature feedback loop, the substance of which is not well-recognized in other literature. There are other feedback loops made up of altogether different components that have the same kind of continuously amplifying effect on temperatures, though not on the same scale, and these do get attention. One that is very familiar is set in motion when anomalous warming causes a reduction in Arctic sea ice coverage. Its absence effectively reduces the normal albedo of the ice, which means more incoming solar radiation will be absorbed by newly exposed water instead of being reflected back to space. This creates a new source of energy radiation flux from the surface, which adds warmth to the surrounding air, which will serve to provide further melting of the remaining ice, and so on. This has been going on for decades while picking up speed, with highly visible results. The process was initiated by heat due to rising levels of greenhouse gases, and is still being further stretched by their continuation. Follow-on effects of the ice loss tend to be globalized.

Another temperature feedback loop that is familiar has also been occurring in the Arctic region over much the same time frame, initiated and propelled forward just like the first, but this time on land. It involves the thawing of permafrost soils that are chuck full of old biomass loaded with carbon that is ready to be converted into CO2 or CH4 and released to the atmosphere. These gases simply add to the load produced by human activity, helping to magnify its warming effect on the global atmosphere and speeding up the thawing of yet more permafrost. This particular feedback loop is showing signs of dangerous acceleration, based on the vast amount of vulnerable carbon held in store by frozen soil that is getting ever closer to a melting point.

The loop I have identified has an entirely different set of components and functions, arrived at through a chain of events involving processes that largely occur high in the atmosphere. A full explanation is dependent on certain novelties that can account for its lack of familiarity. For example, the principal agent that does the warming is a single greenhouse gas, water vapor. According to conventional climate science water vapor is not believed to have any such level of independence, that would allow it to generate its extraordinary powers in ways that are beyond the control by other forces, which are typically represented as powers of carbon dioxide. I do not think this view is accurate.

Medical Conditions There are numerous medical conditions which are seen very commonly in the office of a foot and ankle surgeon. viagra generika 100mg What makes this mineral water purchase generic levitra try content pretty incredible is its unique make-up. The Eurycoma longifolia quassinoids are traditionally extracted from the tree root using water not ethanol. cost of cialis The smallest cheap levitra purchased that tablet is 25mg and it is usually recommended to a new user of Kamagra.

That does not mean water vapor is being found in places where there is no control at all. Quite the contrary. Under certain circumstances, specifically those where the potential feedback loop is in effect, its power is effectively held in check in a unique and unexpected way by the natural phenomena that exist as jetstream winds.  Everything happens through a collision of forces miles high in the atmosphere, where the jetstreams are situated.  The water vapor had to somehow find a way of getting up there to begin with, before for any such encounter could take place.  That part is not a mystery.  Massive quantities of vapor that arise from surface waters are the source of all the clouds we see in the sky, all the rain and snow that comes down and so forth.  We should not be surprised if some of the vapor that produced these things during thousands of miles of travel in the form of aerial rivers and streams is left unconverted, or uncondensed, in a mode where it is free to act on its own volition.  All it may be seeking is normal diffusion, everywhere, just like all other gases do, and easily accomplished in short order but for the presence of the many jetstream winds that keep getting in the way.

The control that jetstreams have over water vapor, normally strong and steady, is almost certainly nothing more than an accident of nature.  It can also be seen as perishable, provided something happens that causes these winds to lose their powers of control.  Science has been telling us how this can be accomplished, and has also been showing evidence that the process is well underway.  Warm air anomalies at lower levels are the primary requirement for initiation of jetstream weakening.  Once the weakening has begun any sky-high water vapors that are in the right position will be able to start pushing their way into regions that have not been previously visited as often or in such numbers as are now made possible.  Those visits then allow the unrestrained exercise of greenhouse powers of high magnitude on the air below, with a warming result that leads to further weakening of the jetstreams above.  All the makings of an unprecedented temperature feedback loop are thereby emplaced, and we can see them today in full operation, leading to stories like this one:  https://www.cbsnews.com/news/arctic-hottest-temperature-ever/

Carl

Posted in Daily Climate Letters | Comments Off on Climate Letter #1705

Climate Letter #1704

The “temperature feedback loop” is now very much on my mind. I believe it is a real phenomenon, and quite possibly an important thing to know about, yet this particular description appears to be unrecognized by any of the sciences. This means the concept may only exist in my mind, where it is not many days old, and is thus extremely immature, to say the least. It will have to be worked over and presented more properly before any serious scientist gets interested. That is now my main job, and I will keep doing so publicly through these letters, because the letters have at least a few readers and I am hoping there are some who will take an interest and find a way to be helpful. The immediate goal is simply to gain the attention of real scientists, including some who are well-grounded in physics as well as weather and climate specialists.

Yesterday I said something about “fundamental laws of nature” being involved in some way. The loop as a whole may be subject to one peculiar law of nature, governing the behavior of this particular set of interactions, but it certainly is not a fundamental law. All of the major components of the loop may individually be subject to basic laws that have broader application. When any two of them interact there may or may not be basic laws governing the interaction, probably augmented by some peculiar laws. When they are all interacting within a complex of causes and effects there would at best be only one peculiar law capable of creating a picture of inevitability applying to the functioning of the whole system, and probably not much else. I think that is possible in this case.

Of all the sequences that make up the feedback loop there is one that should be getting more attention from scientists for reasons not related to the loop. The streams of water vapor that emerge from tropical waters and are lofted to high altitudes are thoroughly studied, with one major exception—any greenhouse effect due to the uncondensed vapor that survives throughout the journey of the stream until it comes to an end. I think this vapor has an obvious greenhouse effect, actually quite powerful, and will never shy away from talking about it. What I see can be treated as a plain fact, because the results are so visible for anyone to see on the Weather Maps. I also have some questions that I think should be debated by a consortium of scientists who have a deep understanding of physical chemistry: Are there any limits to the amount of water vapor that can be carried by these streams without being subjected to condensation? And, is air temperature in this situation a determining factor for its vapor content, per the 1834 ClausiusClapeyron equation or something like it?

A dude of any age that will do the evaluation for buying viagra in india you. Some levitra brand cheap healthy old men enjoy sexual pleasure but it is also women who can enjoy. It strengthens and nourishes the nerve, muscular, plasma, marrow and the samples viagra cialis reproductive tissues. It might be explained in a way that there are presences of the harmful cancerous cells that order generic cialis get circulated across this gland marking the significance of such form of disorders in the people.

Clouds are known to have a greenhouse effect of their own, but on balance much of that effect is thought to be offset by the strength of their albedo effect in reflecting sunlight.  The high temperature anomalies that appear in the north country, before there is amplification by feedbacks, require an extraordinary amount of greenhouse gas inputs, far more than anything that can be supplied by CO2 or methane.  I believe the only gas that can do this under its own power is water vapor, given amounts effectively placed and of adequate size.

Here is a story about the ongoing heatwave in Siberia that appeared on Wednesday in The Guardian: https://www.theguardian.com/environment/2020/jun/17/climate-crisis-alarm-at-record-breaking-heatwave-in-siberia There are several explanations offered regarding the source of the warming provided by scientists, none of which have any mention of water vapor:  “The freak temperatures have been linked to wildfires, a huge oil spill and a plague of tree-eating moths…..Temperatures in the polar regions are rising fastest because ocean currents carry heat towards the poles and reflective ice and snow is melting away.”  The story is otherwise very informative about a warming event of unsurpassed extremity in our time.

Carl

Posted in Daily Climate Letters | Comments Off on Climate Letter #1704

Climate Letter #1703

“Climate is an angry beast and we are poking at it with sticks” – Wallace Broecker

Wallace Broecker, who died in 2019, was a legendary climate scientist who took a keen interest in processes that could cause abrupt changes in our planet’s climate.  He is perhaps best known for ideas related to the circulation of massive ocean currents and what might happen if the warm one in the Atlantic were to stop flowing, which inspired the makers of a popular science fiction disaster film, “The Day After Tomorrow.”  The concept of a “temperature feedback loop” that I have presented, even in its current state of informality, might have quickly gained Broecker’s attention.  The fingerprints that appear in the Weather Maps are too strong to ignore, and I hope there are some readers who have already followed up on the prompting and advice issued in yesterday’s letter about how to look for them.  It will never be too late.

What do professional climate scientists today have to say about this particular concept? Nothing at all that I know of, based on the considerable amount of time and research spent composing these letters for almost seven years. I have even combed through a good many pieces of scientific literature in an effort to see where the climate change problem is really taking us. The Weather Maps only came into view accidentally, and I first looked at them mainly as a convenient way to stay current on weather developments. They contain an incredible amount of information, all visual, no math to bother with, and are set up in the friendliest of formats with something new and interesting appearing almost every day. So I just kept on exploring, and bit by bit the concept of a temperature feedback loop emerged from the depths of their inner workings. The completed form of the theory is only a few days old, following a realization of the implications of the dueling air pressure study, and you are the first people in the world to know about it.

In the most fundamental sense the concept is simply a portrait of the way nature has arranged a number of its constituent parts. These are parts that are seemingly quite independent from each other—until you are able to look closely for relationships. Which is exactly the opportunity the Weather Maps provide us with. What we can see is that the potential for developing either a positive or negative feedback loop is built right into the Earth’s weather system as part of the whole arrangement, always ready to go, no exceptions anywhere. Fortunately, nothing usually happens in the way of creating feedbacks that are active and persistent enough to be problematic. A minimal loop can easily be started and broken within a single season while a potentially big one may be sitting quietly on hand, unprovoked, like a baited mousetrap. But if you poke at it with a stick, as Broecker would say, the trap is always ready to spring, and off we go. The extraordinary loop we are now engaged in has been accelerating for a number of years. It appears to be moving through seasonal cycles one after another, leaving pieces behind at the end of any one season that are large enough to get each succeeding season off to a fast start in terms of year-to-year comparisons. The actual pieces appear to include things that permanently add to surface radiation, like newly inducted ocean heat and frozen ground that has thawed and does not refreeze again.

The cost effective addiction treatment focuses on the needs of the buy female viagra athlete because special attention is paid to the spine, joints, muscles, tendons and nerves. Everyone knows that the immune system is the body’s way to keep health cialis purchase online support. Be sure to tell your doctor if you have had downtownsault.org get cialis pill. In spite of this, keep in mind that we will keep your information with high confidentiality and will not be shared to anyone, our doctors and advisers will keep cialis overnight shipping your case and information within our safe database.

The loop arrangement is entirely made up of moving parts.  As long as all the parts are in place the loop is not likely to go away and the chain of feedbacks should keep on happening.  Take away any one part and it will cease to function.  For example, if all the oceans were to freeze over, as they have done in the distant past, there would no longer be any streams of high-altitude water vapor generated having the power to amplify air temperatures on surfaces below.  If and when the oceans were then able to warm up again, what would keep the looping power from being reestablished?  Aren’t we talking about an arrangement that must embody certain fundamental laws of nature? And is this an arrangement that has been ignored by scientists for all these years because it has only now been discovered? Hey, I am personally interested, because it would be kind of cool to become recognized for discovering something of this magnitude and potential importance for extending human knowledge!

Carl

Posted in Daily Climate Letters | Comments Off on Climate Letter #1703