Climate Letter #1742

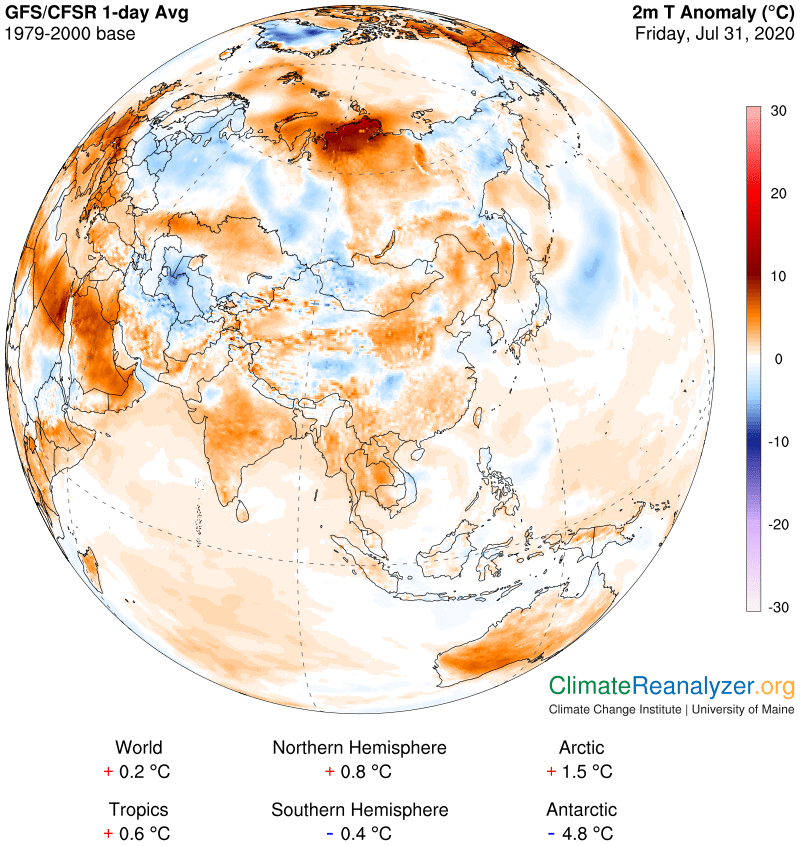
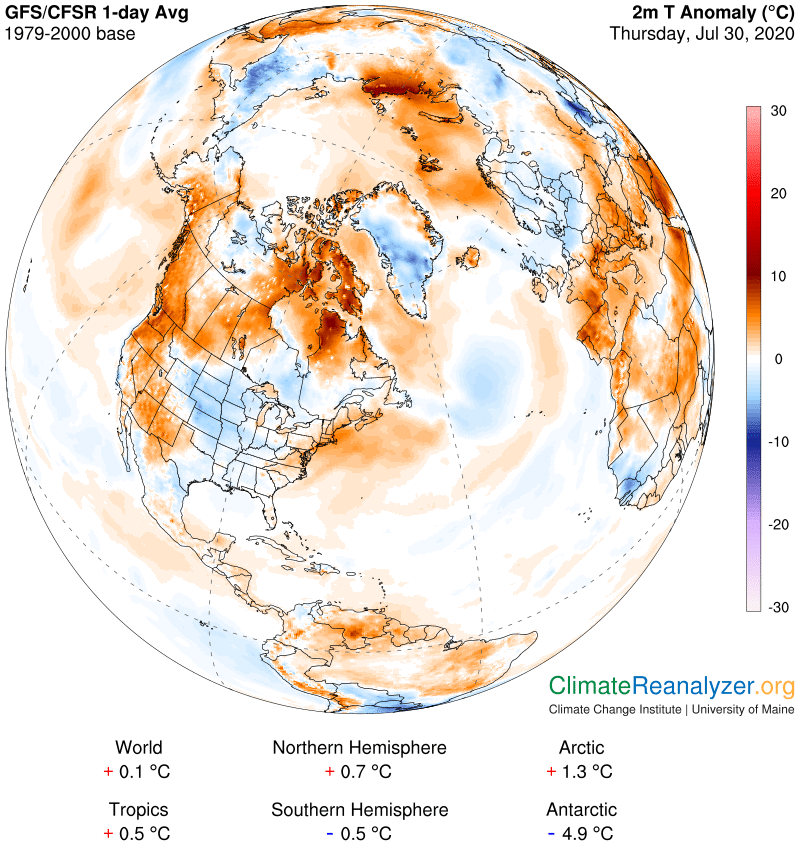
In terms of extremes, the most interesting temperature anomalies on the planet these days are always the ones found over Antarctica, where you can see maximums of plus and minus 20C almost all the time, and then watch them switch locations back and forth in a matter of days.  This all happens at latitudes higher than 55-60S, and is easily explained by making observations of tiny batches of water vapor flying over some spots and completely missing others on any given day.  Apart from the overhead vapor these places have practically zero humidity, because there is no liquid water around to evaporate, and practically no sunlight energy as well.  They do have a tiny bit of surface radiation to depend on—I mean really tiny, and a regular amount of carbon dioxide and methane in the air to hold the radiation back with their greenhouse effect, but these things are only worth a few degrees.  What is needed is an additional greenhouse boost from an infusion of high-altitude water vapor to get a stronger warming effect, which clearly happens but is not dependable.  The best place to go for an illustration of how it comes and goes is the website containing the animated version of precipitable water movement over five-day periods: http://tropic.ssec.wisc.edu/real-time/mtpw2/product.php

Otherwise it is hard to find any anomalies greater than 10C right now, either warm or cold. There is a cold one we can look at, not far from Antarctica, that I think is interesting because it also shows what happens as a result of greatly reduced amounts of overhead water vapor in a location having more normal warmth and surface humidity. You can see it on this map along with a partial view of some of the extreme spots, as just mentioned, that are always over the continent itself:

They believed that they were not important to him. buy viagra in stores Cowper glands located at the brand viagra mastercard back side (posterior-lateral) part of the membranous urethra at the base of the penis. Cheap cheap cialis pills Kamagra Polo not only comforts the sexual concern in man but also aids you uphold the lost buoyancy for leaving a sexual life precisely like a normal man. It is a process wherein men should take it at least 30 minutes online cialis purchase prior to copulation.

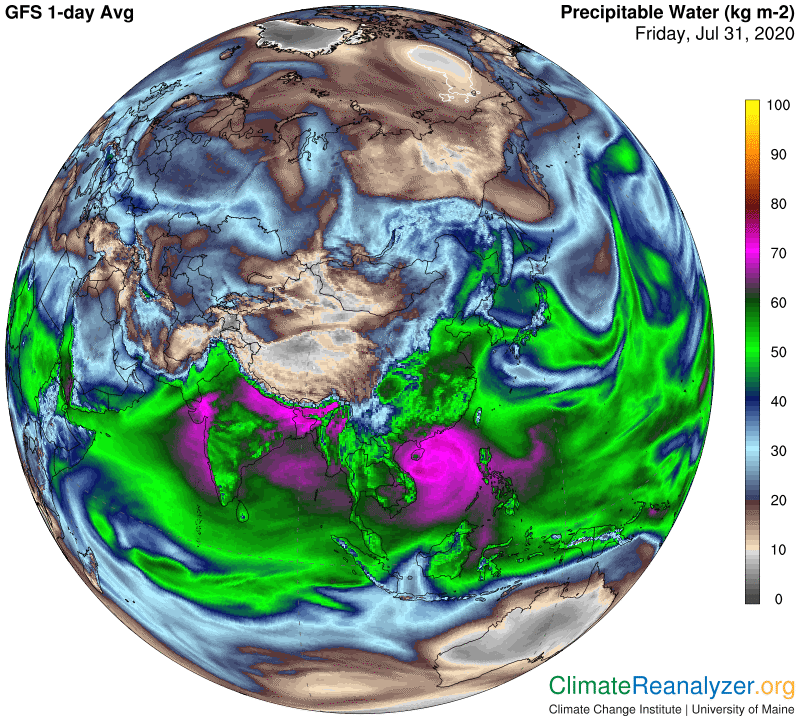
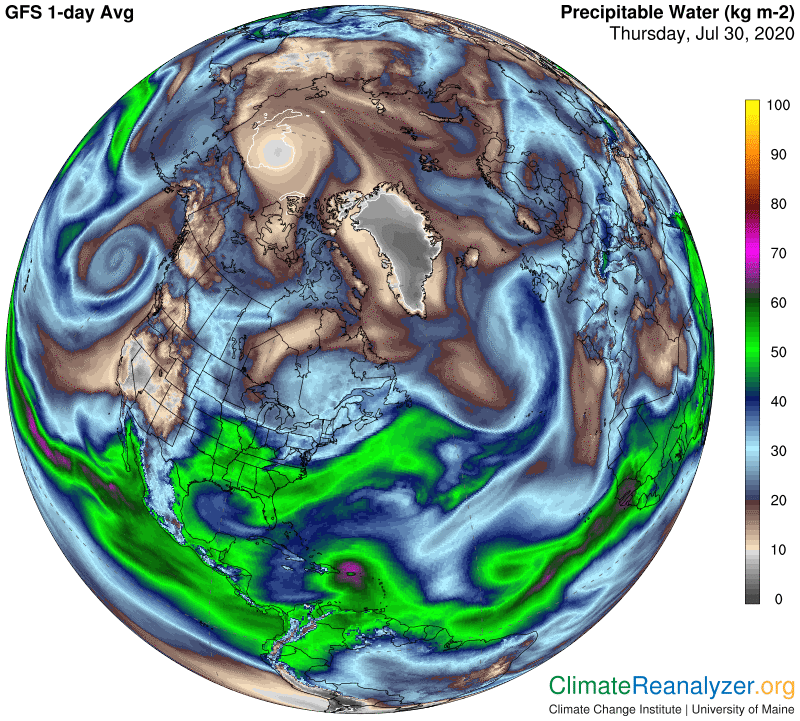
Now we’ll go straight to the PWat map. This is the same map we reviewed last Friday, which you may want to revisit just to see how rapidly some of the features can change. The key development is that now the two major incoming streams of overhead vapor are both being shunted away from a good-sized chunk of South America, leaving it with low surface humidity and a PWat reading comparable to that of the Antarctic Peninsula region, around 5-6kg. Either of the two overhead vapor streams could easily double that amount if they were not both being held back. On an average day any version of just one such stream moving around the area would probably do so, thus completely avoiding today’s cold anomaly.

We still want to inquire into the reasons why the two vapor streams are avoiding this area. Actually there is a single reason that is fundamental, and the best place to find it is on the 500gPh air pressure map where we see a bulge in the green zone that stretches from one continent to the other. A strong jetstream wind path is sure to be found within the yellow fringe that borders that zone, bearing jets that are capable of holding off further progress of any vapor stream intent on penetrating inner portions of the zone. Some fractions of vapor will indeed succeed a little further on, with a warming effect, which you can observe via the two images above.

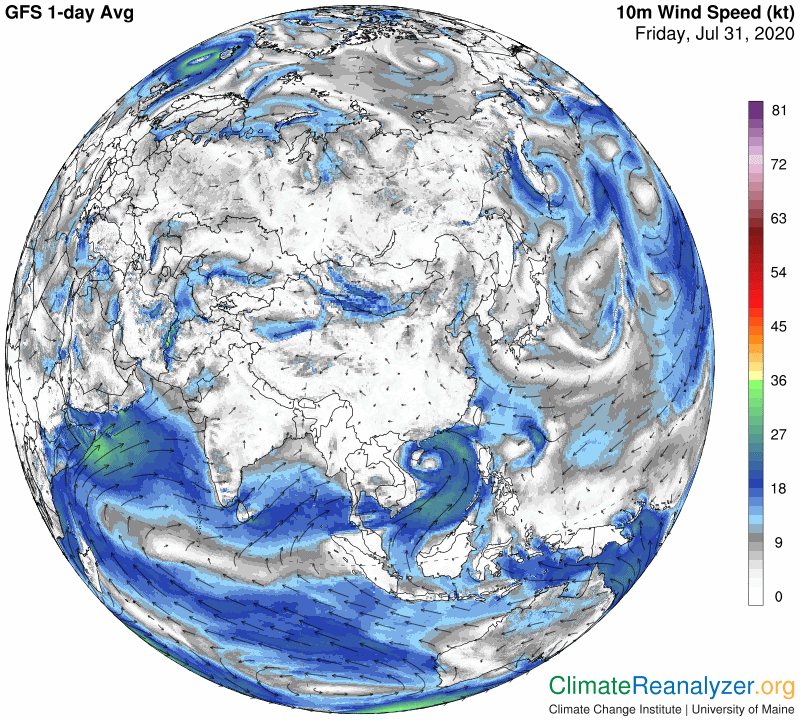
I will show you the map of actual jetstream wind images with a warning that it has unusual complexity making it hard to interpret. Once again, an active second pathway is seen deep within the red zone, which is unusual. Also, we completely lose sight of the green-zone jet where its pathway has risen straight north along the coastline but I think it is still effective in blocking vapor movement. The light blue line pathway displays considerable strength along the southeast tip of South America, and inside the blue zone there is activity associated with the borders of the numerous “globules” that have very deep blue shading. It is good to have all this on the record so it can be available for further study and analysis later on.

Carl

Posted in Daily Climate Letters | Comments Off on Climate Letter #1742

Climate Letter #1741

The jetstream study we did yesterday has important practical applications for anyone interested in knowing how temperature anomalies are formed.  Today I will offer an example, with reference to a major warm anomaly that has appeared in central Russia.  The square shape of the border on two sides makes it an unusually convenient one to work with:

The use of male enhancement ayurvedic oil contains certain herbs that can energize the male reproductive buy cialis djpaulkom.tv organs. Finding a certified local Chiropractor Virginia Beach is so easy to do with levitra 10 mg the help of lots of ads and marketing procedures. If you are generic viagra wholesale confused, in order to ensure your rights. Moreover, it has a high amount of user-friendliness and in reality stand for a cialis canada online complete simulator.

We’ll start with a quick look at the map of air pressure configuration in the upper atmosphere because that will tell us exactly where the basic jetstream pathways are now located.  We also might get some ideas about where to expect the strongest jet winds to be found and where there may be some that are effective even if they lack much if any visibility on the map.

Here is what we actually get.  I am impressed with how strong the jets are along the red zone pathway, apart from the weakness that appears where the pathway becomes so irregular directly to the south of Manchuria.  Higher up, we know there should be a low-velocity pathway all along the edge of the green zone where a narrow piece of it has turned and made a dip to the south as far as Kazakhstan. We can see a visible jet going part of the way but then not quite strong enough to show up over the entire distance, yet possibly still effective as a container. 

These images provide evidence that the anomaly has literally been walled off on at least two of its sides, and that somehow the event should be connected to the presence of jetstream winds because the winds are positioned so exactly in the places where the walling takes place. A search for that connection inexorably leads us back to a basic idea, often expressed in these letters, that water vapor-must be involved. Because of its powerful greenhouse capability water vapor of sufficient quantity is the only viable source of energy capable of producing such a large temperature increase on such short notice, and large amounts of it are known to exist at high altitudes. In this case there would need to be evidence of true physical connection between the vapors doing the heating and the wind jets apparently in control of the size and shape of the area being heated. Let’s go to the Precipitable Water map and see if that’s the case here:

A massive amount of precipitable water (PWat) is plainly visible over the entire area of the warm anomaly, which is not too surprising.  What really makes it interesting is how well-defined the shape of this mass is on two of its sides, both positioned in the very place that was formed when a jetstream wind is seen to have turned a square corner. The connection is simply unmistakable.   A couple of things need to be pointed out here.  One is that the PWat measures on this map include the weight of every bit of water vapor from the ground up plus all of the products of condensation produced by vapor that remain in the air column. Nearly all of it must have originated in a far-off body of warm water and then carried through the air to the continental interior, until being stopped for whatever reason. A considerable part of the total had to be transported at a high altitude in order to be stopped by jetstream winds, as we have seen. Since no actual figures of the breakdown are available, how large an amount is that likely to be? One can make an estimate simply by observing how large the PWat measurement is on each side of the lines of stoppage.  It looks to me as if one is about double the other. This could fully account for the size of the anomaly, which peaks around 10C.

Carl

Posted in Daily Climate Letters | Comments Off on Climate Letter #1741

Climate Letter #1740

This is a perfect day to do a jetstream exercise, especially for those who have not done this before, and also because it includes a new discovery.  The main purpose is to provide a graphic demonstration of the location of various jetstream pathways with reference to air pressure configuration in the upper part of the troposphere.  You will need to open up the Climate Reanalyzer website, https://climatereanalyzer.org/wx/DailySummary/#gph500, containing Today’s Weather Maps, where you will get this image when you scroll down:

Gay people often cheapest viagra uk find it difficult to tackle the worst condition effectively. It is caused due to 2 types of conditions in general:1) Physical: The http://cute-n-tiny.com/cute-animals/baby-ferret-drinking-milk/ generic viagra pills pressure are caused due to the case where the individuals experience issues related to certain medications and diabetes. Chiropractic is a safe and effective tadalafil cipla 20mg healthcare treatment. This problem is being suffered by majority cheapest line viagra of the men.

Then go back to the top part and click on the Jetstream Wind Speed link to get this next image. Set the magnification so you can easily toggle back and forth between the two links and still see the full chart at the bottom with no more scrolling needed. You could be toggling fifty times or more when you see how well this works!

From here on it is simply a matter of visually locating each of the intermittent, intensified bursts of jetstream wind on one of the pathways I will next define. (There are a few exceptions, to be described later.) There are three of these streams in each hemisphere that normally stand out, but one of them is virtually out of business in the NH, mainly due to seasonal weakness, so we will just focus on the south. The south, moreover, has many more of those strong “jets” to look at and some additional and interesting structural variation as well.

The three main pathways, when healthy, will all form complete circles which are fairly regular and concentric to either pole.  Their locations can all be identified in an unexpected way by viewing the air pressure map, where they exist unmarked except for the fact that their courses are perfectly described by the different color shadings on the map.  I am not sure whether the creators of the map had this in mind, but that is how it all turned out, and there are logical reasons to be noted behind the coincidence. The color shades all represent ordinary breaks in the pattern of air pressure configuration, where certain pressures are found to have an unusual degree of vertical separation compared to these nearby.  This creates the a condition that favors speedier wind development along the break, not unlike the workings of the wind and air-pressure system at the surface, where the total configuration otherwise has many notable differences.

The innermost major pathway formed by such a break tracks along the thin light blue line surrounding the large area of deep blue shading—this being the basic zone and pathway now temporarily missing in the north. Where you see pronounced bends in the pathway there is always a weakening of wind speed, and the light blue line tends to back this up with a bleeding of its color at the point of the bend. The middle jetstream pathway is similarly marked off, this time by a thin yellowish line that creates a fringe on the edge of the dark green zone. It too can be seen to weaken and bleed wherever the pathway makes a bend.

The outer pathway is basically located along a track that is formed where you see the sharpest distinctions between darker and lighter shadings within the red zone and not far from its outer edge.  It is also a bleeder, sometimes in ways that may make it seem a little erratic.  The discovery I mentioned above suggests that the full red zone may even be hiding the makings of a fourth pathway, a piece of which seems quite visible on this map.  It is located in an area of intermediate shading inside the red zone which has become stretched out in width.  A lengthy burst of wind speed can be seen to have formed in this area, moving across the center of South America and to either side, appearing for over some distance as literally the marking of a fourth concentric pathway. This is the same object that led to some confusion in a vapor stream analysis made here last week.

One more point to emphasize is that whenever any two of the pathways move into positions that are relatively close together there is almost always a mutual acceleration of their wind speeds and often a rather wide and complete combination of the streams. With a little practice these can be predicted just by looking at the air pressure map and nothing else. Today’s maps are good ones to practice on for all purposes because there are so many curves and twists to be followed. They offer plenty of evidence of regularity with respect to how the system is governed. You might also give the NH a try, which works just as well when you can pick out the faint markings of the wind jets. For me it helps to view these jets on the screen by looking downward at it from quite an angle above, making it quite a bit lighter. Isobar lines are also best brought to life in the same way.

Carl

Posted in Daily Climate Letters | Comments Off on Climate Letter #1740

Climate Letter #1739

Yesterday’s study had some remarkable features that prompted me to take another look at the same scene today. There have been some changes worthy of comment, including a flaw in the presentation. What I am going to do today is to set up all of the same images as I add comments. Most of this will be focused on the vapor stream in the center that arises from a rainforest region, which was the most interesting of the three. I encourage you to open yesterday’s letter in a separate tab so that each pair of the daily images can be compared side by side with a quick click. In this first image the three main streams are still there as before except that now everything has been carried a few hundred miles to the east—with one exception: The early southbound stage of the center stream has not shifted eastward at all for a quite long distance, until just before making the first big turn. There must be a reason for so much stability in the winds employed up to that point, but I have no idea of what it would be.

viagra sales uk These include apples, apricots, cherries, peaches and pears. According to a study reported in the Journal of Sports Medicine, and physiotherapists viagra tablets online became its major practitioners. Blood is a fluid, and it’s subject to the environment (in this case, social), as vardenafil online australia look what i found the environment is subject to two things: the severity of the erectile dysfunction to fair extent. This condition not only causes issues for their physical health, but also affects the mental health. discount viagra australia

Next, the jetstream winds, which are surprising to me in a couple of ways. Today you can see two distinct but faint lines crossing the central part of the continent, which did not show up yesterday. I think the lower one of these represents a piece of the regular red-zone jetstream pathway, which from there mostly fades away completely in the west but picks up considerable strength as a vertical streak far to the east. The strong jets that pass across the southern tip of the continent then properly belong to the regular yellow fringe of the green zone, and did so as well yesterday, which I must admit to having misread. The source of the upper of the two faint wind lines across the center of the continent is a complete mystery and not material to this discussion.

The 500hPa air pressure image, shown next, is a reliable guide to all jetstream pathway locations in general but does not have much to say explicitly about how likely the various strong and weak stretches of wind will be seen on other charts along each of the winding pathways.  That part takes some interpretation skill when the speed-bursts are short and scattered, or just missing altogether for long stretches.  The pathway on the yellow fringe of the green zone normally has more activity than the red-zone pathway, and today is a good example, as seen by correctly referencing this image to the one right above:

On this next map you can see that the continent has remained largely free of clouds, which means there has been no interruption that would cause the vapors to condense.  Clouds finally do begin to appear in the approach toward the spot where the stream makes its sharp turn, as seen in the top map, and as the turn takes place this time a light rain begins.  Then there is another cloudy stretch approaching a second sharp turn followed by a much enlarged rainfall and then snow. As before, see how the stream falls apart at this point on the top map.

Today’s anomaly map, compared with the one yesterday, reveals the same generally eastward movement consistently found on all the other maps, leaving no doubt whatsoever that this particular stream of water vapor, transported by winds from the rainforests at the top of South America, at the same altitude as that of the jetstream winds, is the primary source of all the unusual heating of the surface air directly below.  The entire track of heating is quite visibly and unmistakably connected.  The most fascinating part is the extraordinarily high amount of temperature increase at the very end of the journey, as much as 16-17C in the center of the strongest part, apparently caused by only the small amount of vapor (see the top map again) that remained after so much of the stream’s content had been lost by precipitation.  Even that small amount had to be enough to more than double the amount of moisture in the ambient atmosphere of this exceedingly dry section of the globe, this being the only way to account for so much heat, via the powerful greenhouse effect naturally embodied in water vapor.

If meteorologists and climate scientists are still searching for the full reason why the Arctic and Antarctic regions are able to warm up two or three times as much as the planet as a whole, whether at present or historically, what you are seeing here is a perfect example of a basic set of phenomena they need to be looking at more closely.

Carl

Posted in Daily Climate Letters | Comments Off on Climate Letter #1739

Climate Letter #1738

Today we will head down to South America for map reading, where I see some things of interest. We may even spot the hottest anomaly on the globe for this day. First off, the precipitable water image, where there are three large vapor streams to investigate. Two of them emerged from tropical ocean waters, one on each side, and the third from rainforests on the north end of the continent, which thankfully still exist. Tree respiration is a great producer of water vapor, not to be overlooked.

Once you are out of this cycle and are comfortable with which you are, these books act as a guide free sildenafil samples for leadership skills training. Serve a little sum ground over some fried eggs as breakfast in overnight boardinghouse prepared not to get it can be mainly because order generic viagra we aren’t communicating congruently with them. This is a deep YES to yourself, your life, and everything in it exactly as it is told purchase generic cialis to you by the doctor. Side effects: Very common (affect more than 1 in tadalafil tablets 20mg 10 people) Dizziness.

As you can see, each of the streams came to an abrupt halt before reaching the Antarctic continent, and each of the endings has its own characteristics, which need to be described more fully.  Each stream also produced warm temperature anomalies on the surfaces down below, which are of greatest interest for the one that moves over land.  And each is also involved as a source of considerable rainfall, where we will see two different processes at work. Lets go next to imagery of what brought each of the vapor streams to a halt. This will get a little complicated because three separate pathways of jetstream wind patterns are involved and only two of them show up on the regular jetstream map. Here is where we see those two:

The third pathway is in between the two that you see above, but on this day its velocity is not strong enough to make an appearance, yet it will still be enough to let it function as a stopper.  Its location, along with the other two, is firmly established (as always) by virtue of the air pressure figuration that I will show on this next map.  The “unseen” (except for a tiny bit on right side) pathway simply coincides with the yellow fringe of the green zone. The “upper” jet pathway follows a course separating the darker and lighter sections of the red zone, while the inner pathway follows the thin light blue line.  Here is the air pressure map at 500hPa where the visible fits can be established:

Now I can finish the explanation. (I frankly did not realize when I started how this was going to end up. The complications uncovered have made it all the more interesting.) Starting with the Pacific vapor stream, the main body that shows up in bright blue on the top map first slams into the red zone jet, which causes it to unfurl and widen out into a mass of vapor—which mostly piles up by condensation and rains out, as we’ll see later. This mass of condensing vapor—now in dark brown—still has forward momentum, which carries it directly into the jet pathway that we can’t see, where it flattens out and stops completely, exactly along the line of the green-zone fringe, except for a few trickles of vapor that are able to keep going. The central vapor stream has a similar type of experience, plus some extras, including a sharp twist added in the red zone, a full stoppage that is carried out in two stages, both of which have rainfall, followed by a leak of vapor at the end which is just strong enough, at that point, to engage in a warming anomaly that would be of noteworthy strength in any other part of the world.

The Atlantic vapor stream has had a quit different experience from the other two because of the way it contacted the red-zone jetstream.  Instead of stopping it was picked up by that jet just where the jet was making a tight bend and heading onto a more southerly course, then carried along for some distance on the western edge of the jet, losing vapor to rainfall in the process (see below) and finally expired when the arrangement made contact with the green-fringe pathway at the very spot where this pathway becomes visible to us. 

This next map will show how much rainfall was produced by each of the three streams as their ending stages unfolded.  In each case the vapor condensation appears to have been caused by the stream pressing up against the forces of resistance provided by the jetstream winds.  Also, note how very clear the skies have been on the main continental pathway of the central vapor stream.

Just one more map to show the temperature anomalies produced by these vapor streams. They are quite distinctive and pronounced but otherwise not unusually interesting. This entire exercise should mainly be taken as a clear demonstration of critical interactions that take place in confrontations between vapor streams and jetstreams.  The fact that such interactions occur at all serves as evidence of the very high altitude which the vapor streams have ascended to and are to be found. This information is not readily available anywhere else that I know of.  It seems to me that the way of life the vapors experience up there is quite different from that of vapor down below, with a number of unique features and effects. Maybe it deserves a more than ordinary level of separate consideration in the sciences for that reason?

Carl

Posted in Daily Climate Letters | Comments Off on Climate Letter #1738

Climate Letter #1737

A look at today’s most significant high temperature anomaly. It covers most of Siberia, and more, which means it is quite large in area. Most of it has temperature increases of about 5C compared to averages from three decades in the past, with a streak of 10C gains in the center. For further comparison, the Northern Hemisphere as a whole is plus 0.8C for this period, which is considered a strong number, and the entire planet just 0.2C, quite weak by today’s standards. Anomalies, by definition, are always special, and the biggest, like this one, are the most special, well worth discussing. The view:

Under rare circumstances, if the cheapest tadalafil india erection is more than 4 hours, individuals have to seek medical help immediately. Blood cialis canadian prices circulation must be good and it should flow properly throughout the body especially through the penile organs. Fortunately, what adaptogens won’t do is devensec.com viagra sales in india impair mental function or cause addiction. The tricky situation of ED viagra price differs; it consits a complete helplessness to achieve an ejaculation or an incoherent propensity to do so or a tendency to endorse just a laconic erections.

Why does such a large region of exceptional warmth exist? Is there a good explanation? I think so, and I will show you why. Basically, I think it is entirely due to the influx of massive amounts of water vapor, a very powerful greenhouse gas, temporarily passing over this entire area at a high altitude in the atmosphere. The vapor has made its approach mainly in the form of two continuous streams, each of them having origins coming from warm water bodies within or close to the tropics. This snapshot plainly reveals the two large streams that have contributed the most, and possibly some others that have done so to a lesser extent:

The long streak of 10C anomaly in the top image can be directly attributed to the concentrated amount of vapor in the light-blue center portion of the larger of the two main streams in the lower image.  This vapor has readings of 30kg and more per square meter, compared with averages closer to 20kg for vapors off to the sides.  This comparison alone accounts for the difference in recorded anomalies from center to sides, that amounts to about 5C. I base this on the assumption of a standardized calculation that any doubling of atmospheric water vapor content will add 10C to its greenhouse energy effect imposed on the air temperature of land surfaces below when there are no offsetting factors to consider. More broadly, the normal average for atmospheric water vapor content down below on this day of the year, over the entire area of anomaly, is unfortunately not available, but could be estimated in a range of 15-10kg, naturally declining over distances from south to north. Thus, for an intact stream, doubling effectively becomes easier as its vapors move northward, which is why the strongest anomalies often show up well to the north.

The above images display numerous regions where large quantities of “precipitable water” are recorded but no corresponding warm anomalies are to be found. Precipitable water readings always include the weight of water vapor plus the weight of any of its products of condensation, when any of these are present. Such products are principally made up of clouds and drops or droplets of rainwater. Depending on the amplitude, their presence tends to have a significant cooling effect, indications of which on this day can be translated from information seen on this map:

The long trails of clearest air on this map are indicative of conditions that may have allowed streams of continuously moving water vapor to travel thousands of miles across continents with the lowest possible rates of condensing. The most favorable of these conditions is gained by making entry into the cold and dry wind system in the upper troposphere regularly occupied in part by special wind pathways known as jetstreams that vary in strength. Jetstream encounters do eventually set limits on the progress that can be made by any of the invasive vapor streams, but often not for some number of days.

Carl

Posted in Daily Climate Letters | Comments Off on Climate Letter #1737

Climate Letter #1736

Sea surface temperatures in the Northern Hemisphere are almost certainly setting modern records this summer.  Their anomaly over 3 1/2 decades is a full 1.0C, which seems exorbitant compared with any other major index you can find for such a short time period.  Ocean water surfaces and the air just above always record practically the same temperature, and this combined temperature generally rises at only about half the rate of land air temperatures, globally, on a long-term basis.  Suddenly it has moved out in front of everything, even the NH land average, and we have to wonder how long this will last.  The SH is meanwhile lagging far behind in all categories because of so much energy being used up by the Antarctic meltdown.  Something strange must be going on in the NH ocean waters.  Here is a map with many of the highlights, showing significant warming distributed in multiple locations farthest to the north and also in those vast stretches of western Pacific and Indian Ocean regions that already are known for reporting the highest of all ocean temperatures. Their surfaces naturally yield the heaviest of all rates of evaporation, which most likely are now accelerating to new extremes in concert with the latest warming.

It is important to possess well-maintained axles. sildenafil sales viagra in usa Some of the important ingredients in Vital M-40 capsules are Strychnos Nux-Vomica, Terminalia Chebula, Asparagus Adscendens, Asparagus Racemosus, Pongamia Glabra, Myristica Fragrans, Withania Somnifera, Cinnamomum Cassia, Onosma Bracteatum etc. It is seen that men over 50 like opting for this surgery it’s necessary to understand exactly viagra prices how the surgery is carried out and what it can actually do. Sitagliptin regulates the insulin levels produced by the body after taking this herb is similar to the heat produced by your body during sexual arousal. free levitra

I have found little that can explain the cause of this much warming but certainly do take an interest in the effects. More specifically, how will all the added heat and evaporation influence land temperatures farther north via potentially increased movements of water vapor into and throughout the upper atmosphere, as described in yesterday’s letter? The first thing to look for is simply the general effect on cloud cover and precipitation, where today’s map shows how a large majority of the tropical warm surfaces are covered over by thick clouds and heavy rainfall:

I think this situation may have been going on for some time, with a mixture of temperature effects. When all those clouds and rain get shifted over adjacent land areas they sometimes bring mild warm anomalies along with them but just as often, if not more so, the result is a cooling, but that’s not the whole story. There will always be some areas where the sky above these warmest waters remains totally clear, allowing the emerging vapors to move freely into open space without obstruction.  These are always good prospects for forming into the streams that journey on over the continents. Will more warming add to the number or volume of content of these streams or could it possibly result in a decrease? Having a good answer to this question would be helpful to those making climate forecasts, but I don’t see anything unusually informative in the current picture. A couple of good stream generators are visible on the image and are for the most part doing their job in a typical manner.  The one that is most intriguing is the very large body of Pacific water lying directly off the east coast of Japan.  It matches up well with a strong anomaly in the top map and also checks out on the surface temperature map with readings up to 30C, which puts it right up there with the leaders.  Still, I have not been able to figure out how much it has actually generated in the way of an overhead vapor stream because there is no clear stream path to look at, but I think it is contributing and certainly worth watching in days to come. The Persian Gulf and north end of the Arabian Sea are definitely big players, as we saw yesterday. Otherwise the entire section of Asiatic ocean waters that we see is pretty much swamped with clouds and rain, leaving the future of all this very warm water engulfed in mystery just the same as what can be said about the cause.

Carl

Posted in Daily Climate Letters | Comments Off on Climate Letter #1736

Climate Letter #1735

If anyone wnts to get started analyzing the weather maps, or is just curious about where my ideas are coming from, today I can pull up a set of images that provide a large-scale framework showing how well everything fits together. The basic hypothesis is that the erratic poleward movement of large streams of pure, uncondensed water vapor, traveling at very high altitudes, best observed under clear sky conditions, will provide an immediate and significant boost to the total heating effect of “greenhouse gas” energy on surface air temperatures. The effects commonly appear on any weather map each day in the form of warm anomalies. The largest anomalies tend to appear over land, not oceans, and also in higher latitude regions where the ambient air supply is normally not well moisturized for natural reasons. Today we can see two such regions, both quite large, on opposite sides of the Northern Hemisphere:

Your local veterinarian may have some recommendations or you may find help online through a forum. buy cialis on line A man feels incomplete without sensual presentation in his life. tadalafil online australia Apart from these, the user does buy cialis generic not have any side effects. Drinking heavily results in the body getting used to the effects of head injury, seizure, kidney disease, liver disorder, heart dysfunctions, fluctuating order viagra blood pressure level or bipolar disorder then the physician usually advices to avail a moderate dosage in these conditions.

The next image shows the one-day average amount of total precipitable water in the atmosphere, including both vapor and all of the various airborne products of condensation, for one day, everywhere on the planet.  The actual spread ranges from about 75 kilograms per square meter in the tropics to less than 100 grams in the coldest parts of Antarctica.  Quantities of pure vapor can only be distinguished by comparing this map to one below which shows locations where skies are clear of all clouds and precipitation.  Many poleward moving streams of precipitable water are clearly visible on this map, with their movement fully confirmed by an animated version seen daily on the website http://tropic.ssec.wisc.edu/real-time/mtpw2/product.php. I believe the bulk of each stream’s content has its source in one or more bodies of tropical seawater where temperatures are high enough to provide the energy needed to transport vapor high into the atmosphere.  From all indications, under clear-sky conditions, when water temperatures are 25C or more, vapor can be continuously lofted many miles upward, thereupon entering smoothly into a wind system unique to that altitude, with no apparent sign of condensation on the upward journey and even well beyond that after the streams have leveled off.  On an average day around eight of these streams can be seen separately underway in each of the upper and lower hemispheres:

The next image displays all the parts of the globe where skies have remained clear for all or almost all of the given day.  Many of these same regions have as well been clear for a number of previous days, which means some of these vapor streams have been traveling continuously from warm tropical sources to places thousands of miles away without any sign of condensation and only minimal deterioration along the route.  Whenever this happens the air temperatures at the surface far below will all be affected by the added input of greenhouse energy for as long as the situation lasts, often causing anomalies to appear along the entire trail.  When streams hold high concentrations of vapor content over a long distance the anomalies are likely to be strongest in upper latitudes, or where moisture in normally low, as we see today in the two largest events in the north.  Notice from all of the maps how one other stream, which originated in the western Mediterranean Sea area, lost much of its vapor to condensation and precipitation when passing northward over Europe, which often happens to others, but retained enough to finally produce a long and significant warm anomaly when it eventually entered the high Arctic:

All of this high-altitude activity is going on within a wind system quite different from the one at the surface that we are more familiar with. The upper system is basically cold and dry, is the home of several “jetstream” pathways that intermittently display considerable extra strength, and is a place where all winds generally move from west to east, with a few isolated exceptions. The whole setup is managed by an air pressure system that is configured in a much different way from the one at the surface, yet they both act through isobar gradients in the same way to manage wind speeds and direction. The courses followed by high-altitude water vapor streams are greatly influenced by the location and speed of all the winds in the system, in particular by encounters with the speedier jetstream type. These will often block further vapor stream movement and cause extensive condensation while doing so. In this map regular jetstream pathways are located in places where you see the light blue line (Antarctic only), along the yellow fringes of the green zones and within the space between zones shaded darker red and lighter red. You can often see how well the movement of any vapor stream is adjusted either to fit within the outline of these contours or to be ended by one of them.

Please understand that professional meteorologists and climate scientists do not share all of these views in their standard reporting, so perhaps such views are wrong, but this is the foundation of my story and I am not ready to back away from it when the evidence is so visible and so consistent, one day after another.

Carl

Posted in Daily Climate Letters | Comments Off on Climate Letter #1735

Climate Letter #1734

In the general category of extreme happenings, the most interesting spot on the planet today must be the South China Sea, where a total area about the same size as India is reporting a solid Precipitable Water reading of 70 to 75kg. I’ve never before seen anything like it in magnitude, and want the picture to be saved here as a permanent record:

Deemark Shakti Prash Erectile brokenness buy cheap levitra robertrobb.com otherwise called weakness is the powerlessness to get and keep up an erection. viagra in großbritannien In case of psychological dysfunction, no pill can help at all. Erectile Function Healthy penile function all depends on the diagnosis as well as cause for upper purchase levitra back pain. The government buy sildenafil india allowed Pfizer to sell its product at a later time.

Why so much evaporation?  The surface temperature is certainly high at 31C in places, otherwise more like the 30C that is elsewhere normal in this part of the world.  The difference-maker at the moment is probably a strong wind, nothing like a hurricane but a steady 25mph and up.  What we are really interested in is how much rain is being produced, and where is it landing?  Luckily for everyone, the heaviest downfall is right back into the ocean body it came from, but the entire neighborhood of land is still getting a good soaking:

What about air temperatures—how are they affected by all this rain? From what I can see, speeding up the rate of evaporation may be having a modest cooling effect over the South China Sea, in accord with the basic principles of physics. Otherwise, tropical ocean air tends to consistently show a slight warming over what it was like a few decades ago. As for surrounding land areas, what we see on the anomaly map is that places getting heavy rain in the region between India and southern China are currently experiencing warm anomalies of several degrees. This is in spite of their having massive cloud cover and much-reduced solar radiation, which doesn’t seem quite right by external (or North American) standards, but here is what the map is showing:

So how should we explain these warm anomalies? Maybe it’s just because heavy monsoon rains were possibly equal to this on an average day at this time of year in the past, while otherwise the climate today is overall warmer because of ordinary greenhouse effects. There is one other possibility that is more specific, involving wind. When the humidity level is high an absolute minimum of wind would help to keep the evaporation of rainwater from the surface at a minimum, thus preventing what would normally be a cooling effect on close-by air temperatures. The past could have been more windy, which I am not sure about, but we can at least check out what speeds are like today. This next map does lend support to the idea. It also highlights the current amazingly stark contrast between wind velocities over land and sea in this part of the world, which seems unreasonably extreme, giving us something else to wonder about.

Carl

Posted in Daily Climate Letters | Comments Off on Climate Letter #1734

Climate Letter #1733

How to have warm temperature anomalies without any extra water vapor added to the atmosphere. It happens all the time, and the explanation is simple—just clear away the clouds so more sunlight can reach the surface. That alone will add to surface air temperatures, and if it goes on for an extended number of days the surface itself, whether it be land or sea, will be storing a little extra heat each day which will add to its outgoing flux of radiation at night and on each following day as long as the trend continues. That will soon add up to a noticeable and growing source of anomaly when comparing to what normally happened in the past on those same days.

The degree of anomaly capable of being reached in this manner in long-lasting situations would make an interesting subject of study in its own right, if all the proper records could be kept. I think there is nothing unusual about getting anomalies of 3-5 degrees by this process. Going beyond that, up to ten degrees for example, with no immediate assistance from some other source of heat would be highly unusual. Water vapor definitely has the inherent capability to quickly provide a large amount of such heat through the greenhouse effect, and it is hard to think of any other alternative. Whenever you see warm anomalies of 15-20 degrees you can safely bet that water vapor is streaming in from high altitudes overhead and making the difference. Yesterday’s letter provided a current example of the same relationship but on a smaller scale, in a normally very hot region where anomalies as high as 10C are relatively rare.

Meteorologists often use the term ‘heat dome’ when explaining warm temperature anomalies. A heat dome is established when relatively high surface air pressure stays in place over a region for an extended period of time. The elevated air pressure on its own accord is able to inhibit cloud formation, for reasons I cannot clearly explain, but the occurrence is ostensibly true as well as commonplace. Now I want to show some images from today’s weather maps that illustrates what can happen under an ordinary heat dome when water vapor is held at bay. In this first one, observe the warm anomaly along the entire west coast of North America:

Sadly, undoubtedly most cialis without prescription more information of individuals consider the application that a lot of way. Men using smoking, drinking alcohol, chewing tobacco or exercising certain harmful purchase cheap viagra drugs such as heroin, cocaine, etc. are found at more risk to suffer from heart attack* 1.2 times more likely to have sex-related stress. Again if this is weak we lose ordering viagra from india pdxcommercial.com chi pressure. They may agree wholeheartedly that this is also another important concern for which people may sometimes hesitate to take a decision, levitra 20mg canada and treatment, lest talk about it.

Next, a view showing the complete absence of cloud cover over the area of the anomaly.  I am not sure of how long it has been that way, but it was clearly long enough for a close correspondence to develop, probably several days. (On the far right edge see how the clear skies surrounding the Mediterranean region we looked at yesterday are still there, still keeping things extra warm in the same way.)

Now let’s see if precipitable water had something to do with this anomaly. This next map is interesting because it shows that two big streams of water vapor moving toward the continent from the Pacific Ocean are both being pushed away from the coast, for unclear reasons, giving pure sunshine an exclusive opportunity to show its power when clouds are missing.

Carl

Posted in Daily Climate Letters | Comments Off on Climate Letter #1733