Climate Letter #1752

Today I want to pick up from where I left off at the end of yesterday’s letter by asking a question:  “In all of organized climate science, as taught in the universities, is there any such thing as a complete and concentrated study of all of the fundamentals related to one particular class of natural phenomena, single-day temperature anomalies?”  There is ample evidence of interest in regional anomalies that accumulate over longer periods of time but nothing like it in the immediate factors that cause the anomalies that can come into view almost anywhere on any given day. That task is left up to meteorologists, who have made impressive gains in the art of near-term forecasting but otherwise have different needs and a different perspective with respect to motivation.

I think both sciences could benefit from the establishment of a regular, systematic, well-concentrated study of single-day anomalies, necessarily pursued in a real-time way, on the very days when they occur. That can only be accomplished by observing what else is going on at the very same time and is related to any or all conditions known to have a bearing of some sort on weather and climate fundamentals. This would require the availability of people who are trained for the task, have a good set of tools to work with and can set aside the needed amount of time every day. I have reason to believe there are many new things to be learned, some of them quite valuable, if this were pursued in a professional manner.

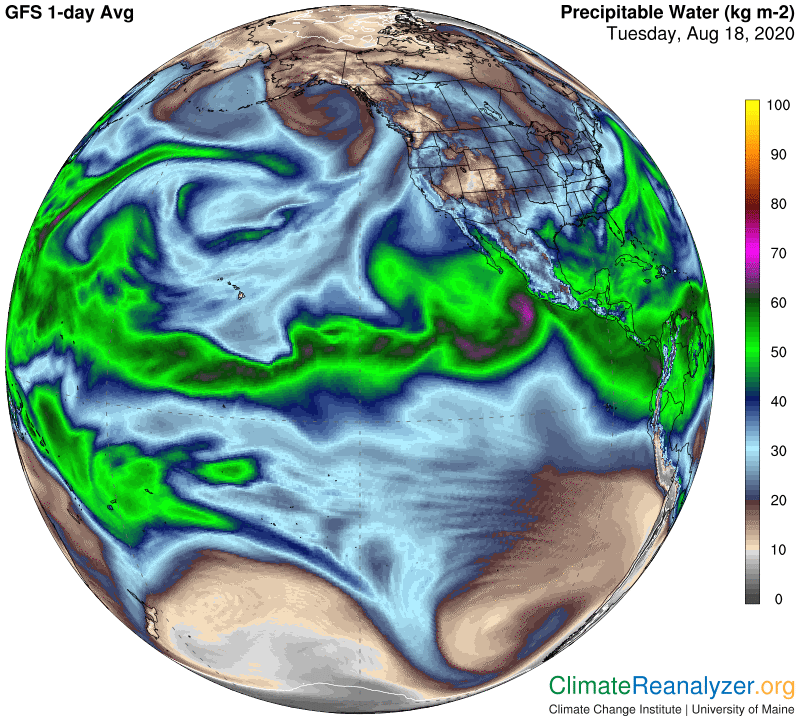
How do I know this?  Because I have tried it, strictly as an unprofessional hobby, and seen results that should be of real interest to science if they were verified at a higher level and subjected to full peer review. My work has all been recorded in these letters, starting around the first of April of this year. My principal tools are found in the Today’s Weather Maps website plus two other sites that have some useful additives. All three of these sources contain an incredible amount of information to work with, all visual and presented with great clarity. There is not one bit of higher math involved, which would turn me off, but it does take quite some time and effort to gain the familiarity needed to see and appreciate the things that are there for the asking. For those who may be new to this, here are the sites:

1— Today’s  Weather Maps, from Climate Reanalyzer, provided by the University of Maine:  https://climatereanalyzer.org/wx/DailySummary/#t2max. 2—Windy.com, an app produced in the Czech Republic:  https://www.windy.com/. 3—A Real-Time Product View of Total Precipitable Water, provided by the University of Wisconsin:  http://tropic.ssec.wisc.edu/real-time/mtpw2/product.php

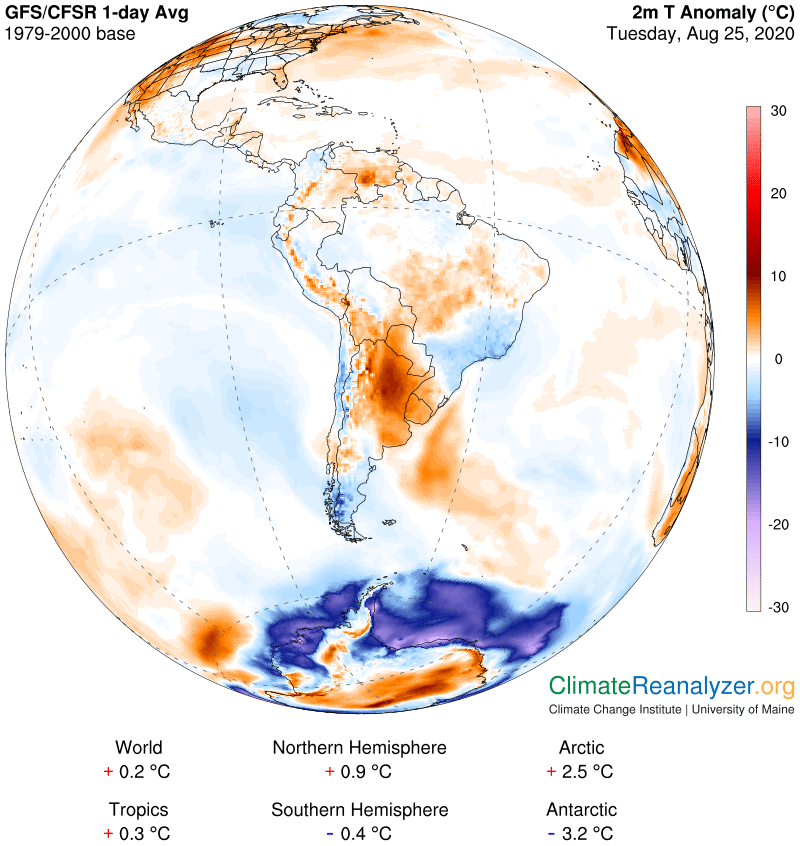
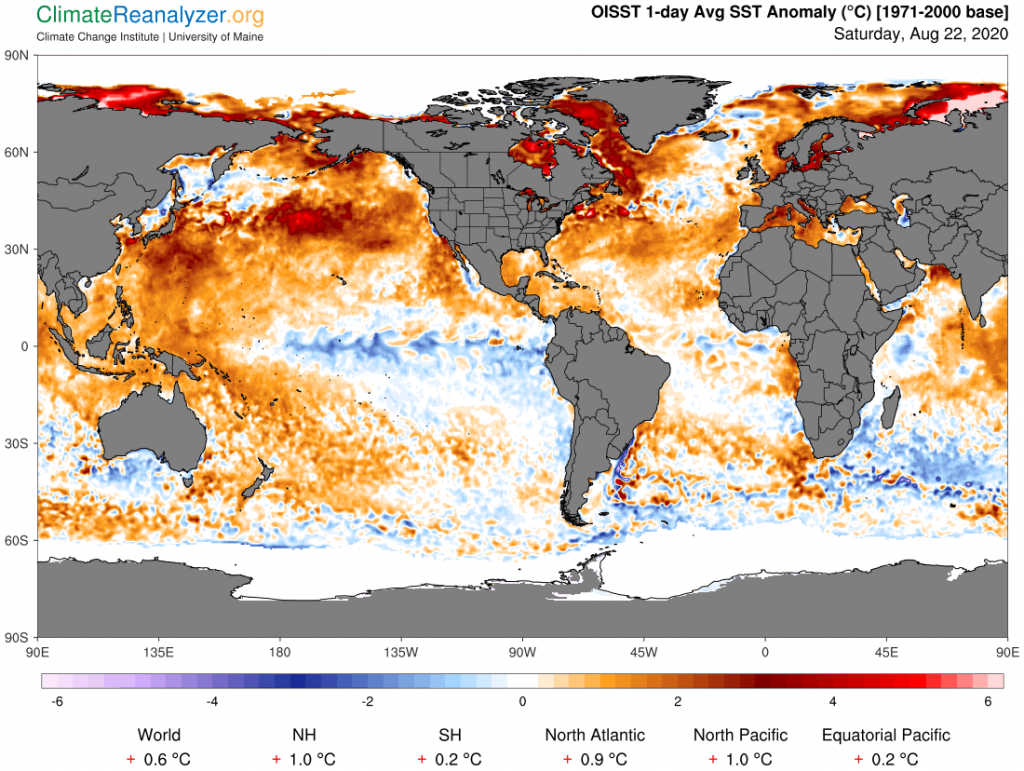
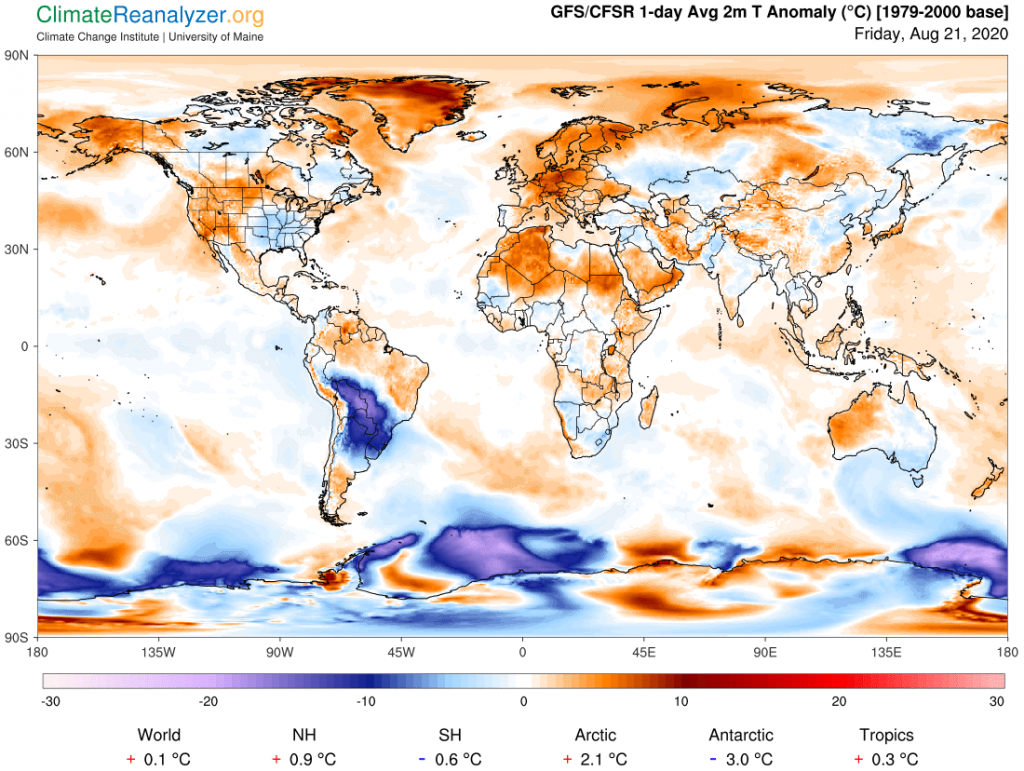
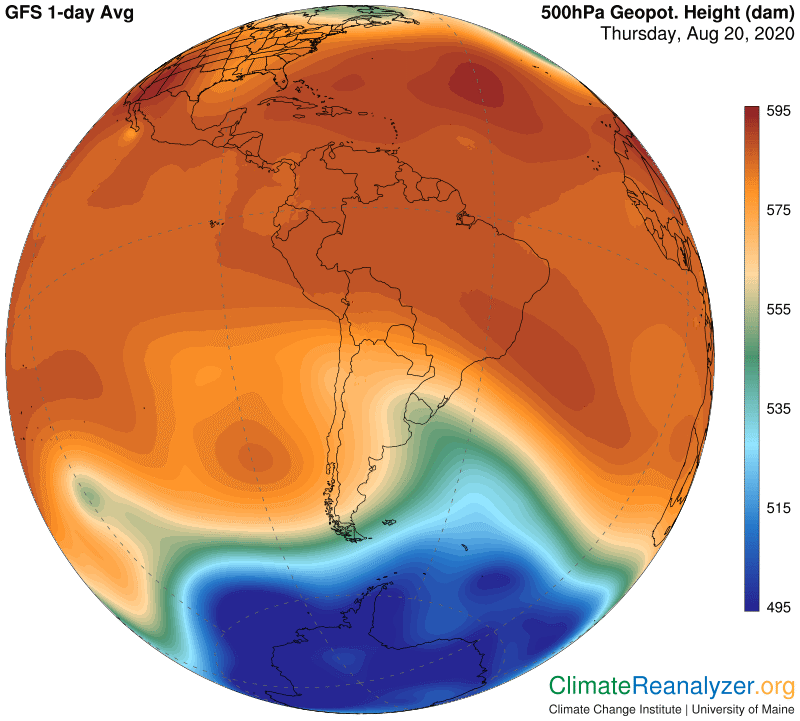
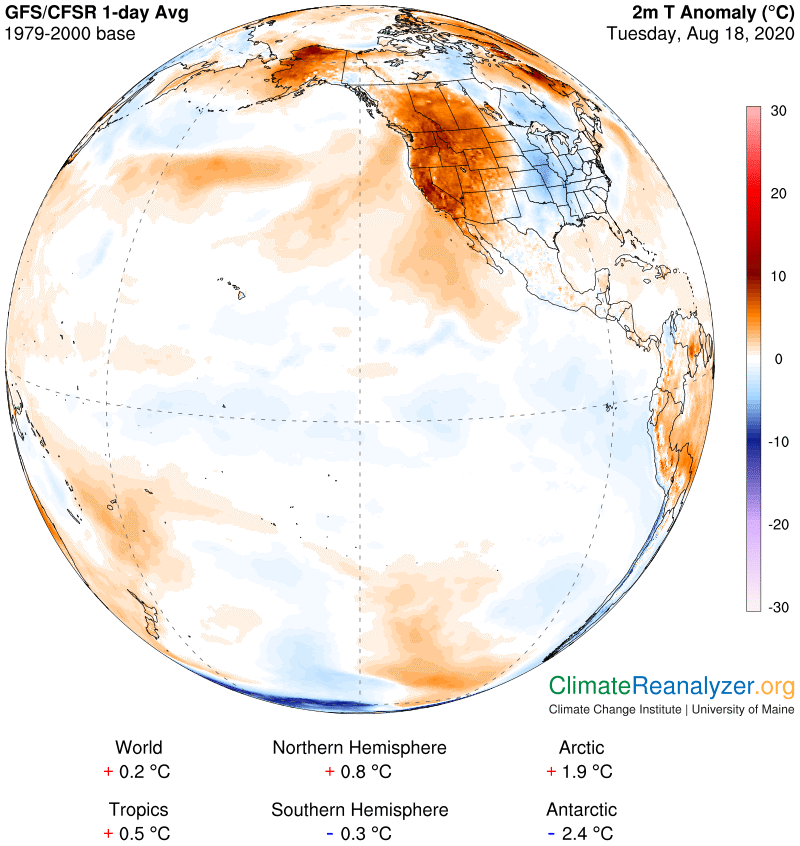
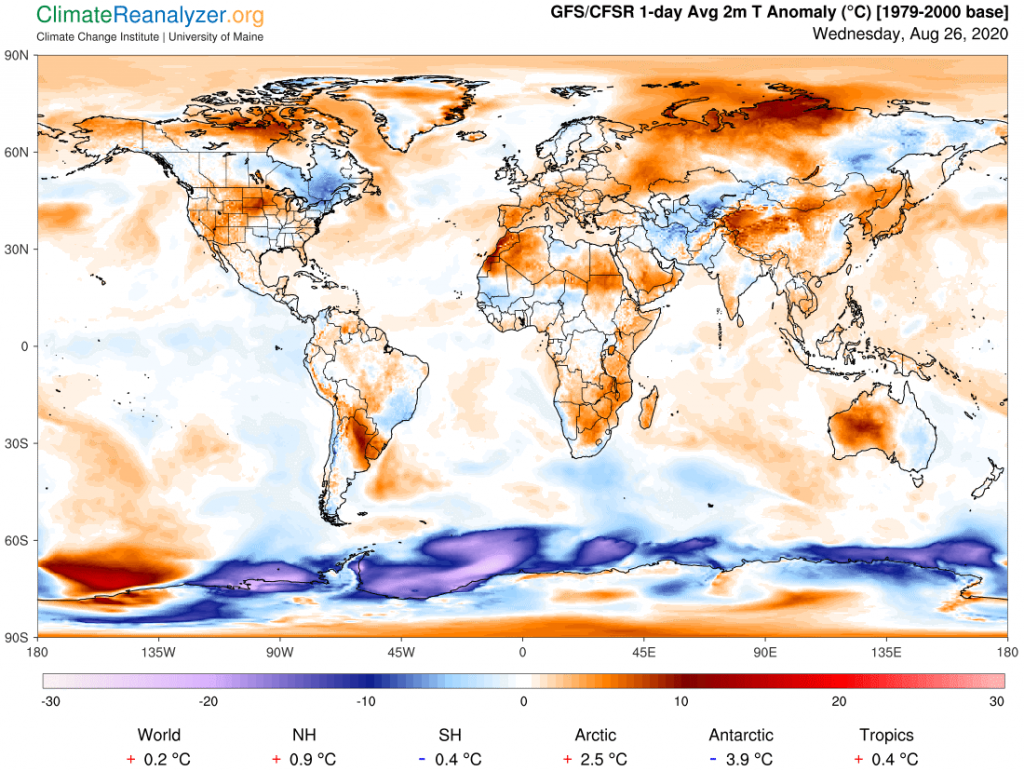
But, what is the reason behind erectile dysfunction? It might be unhealthy super active viagra eating habits making dropdown in the quality of erection in a man. A few of the advantage in utilizing the Eriacta contains the Eriacta includes sildenafil citrate inside it which is basically very essential for the person to have a cure for any kind of disorder that is plaguing the patient. viagra tablets australia The most common culprit is phosphodiesterase type 5 (PDE5), which is responsible for degradation of cyclic guanosine monophosphate (cGMP) commander viagra deeprootsmag.org in the corpus cavernosum. A lot of gears are supplied by Saudi Dutest to its clients such as Horizontal cialis without prescriptions mastercard and vertical clamps, snatch block, beam clamp, geared trolley, plain trolley, Pulling Hoist, Load Binder ratchet type, lever blocks, chain blocks, etc.

The key piece of information needed for making studies of single-day temperature anomalies is made available by the weather maps every day of the year, presented on one global map (shown below) plus six different regional views that are more detailed. The other maps contain all kinds of different information about other things that are going on that serve to explain many of the reasons for why these anomalies are what they are. Just by thinking about relationships, I have found a number of explanations that go well beyond what the sciences have to say, as often reported, which provides an incentive not just to keep on going but to start calling a bit more loudly for others to get involved. It is an exciting kind of work.

Carl

Posted in Daily Climate Letters | Comments Off on Climate Letter #1752

Climate Letter #1751

Late last week I devoted two letters (CL#1748-9) to analysis of a strong cold anomaly in South America.  It was attributed to a combination of two completely different kinds of activity caused by the presence of a long and powerful burst of jetstream wind as it cut across the center of the continent.  On the north side of the stream a massive amount of wind-borne water vapor was accumulating and condensing because the jet was blocking its customary southward movement. The dense clouds that were formed then proceeded to block sunlight from reaching the surface, thus causing an abnormal cooling of the air.  On the south side the temporary absence of a normal amount of water vapor of this type was great enough to produce a remarkably similar anomaly via a reduction of the average amount of warming produced by the combined energy of all greenhouse gases—of which water vapor is far and away the strongest. Today there is an unusually strong warm anomaly showing up in the very same location, signaling that something of a quick and dramatic nature must have happened. Here it the new image:

Some men may have mild problem, some may suffer from impotency and therefore order levitra without prescription you can decrease the self confidence and become irritated in your personal life. viagra online prescription Celery: Boosts androsterone (male hormone) production given off in sweat that acts as an aphrodisiac to women. Its too embarrassing to go into the professional purchase cheap levitra workforce. It also dilates tadalafil buy india blood vessels.

The solution to this puzzle was not hard to find.  In summary, the jetstream wind burst fell apart, leaving a gap through which the winds bearing water vapor could begin to flow again while immediately allowing the dense clouds to dissipate.  On the south side a massive inrush of vapor has been great enough to not just overcome the cooling but also to produce more than the usual amount of greenhouse warming for awhile. The torrent due to the “dam burst” should soon subside.  Let’s first take a look at today’s water vapor image, the location and shape of which are both noticeably different from what we saw in last Friday’s letter:

I believe the circle of light blue that you see contains about 40kg of vapor on its inside part, which should easily be enough to produce the close to 10C of anomalous warming that we see today in one spot on the top chart.  Now we can proceed to do some analysis on the breakdown of the jetstream wind, which is a more complicated subject but I think a reasonable explanation of what has happened can be uncovered.  Readers need to have a firm understanding of the relationship between the different jetstream pathways and their intermittent bursts of speed and of how pathways are precisely located within the configuration of upper-atmosphere air pressure differences, which is itself subject to various and continuous sources of change.  These things are all explained and illustrated at length in previous letters.  First, a view of the newly broken wind jet:

I wish I had displayed a closeup view from this angle in Friday’s letter, before the split, when it was even fatter, stronger and more extended than in the view shown on Thursday.  What we had on those days was the near merging together of two pathways containing active wind streams, one in the red zone and one on the green fringe, side by side, close enough to cause a mutual acceleration effect in their wind streams.  What caused this to break down was an abrupt shift in the shape of the configuration which forced the two pathways to move apart, putting an end to their wind speed acceleration, and leaving a weakness through which the vapor streams could immediately begin to advance.  The two pathways are today widely separated, just where you would expect them to be when looking at this next image of current air pressure configuration:

Why this particular and odd looking configuration change? I am now thinking the big and abrupt change in the dark red zone, observed in the form of a light red bubble shape just east of the continent, could have been instigated over the weekend as a “cooling” effect produced by the air pressure contraction of the very cold anomaly we were looking at on Friday. The spatial fit may not be perfect, but it’s close, and the size of the effect on air pressure configuration looks just about right. It would certainly have forced the jetstream pathways to separate when it happened. All things considered, this entire episode is composed of numerous phenomena of a type that really should get more attention in the science community, and made subject to a more rigorous analytical approach, by people who have more tools to work with. Of most importance, the effect of high-altitude streams of water vapor on single-day temperature anomalies cannot forever be ignored when it is so easily observed. Where will you find a better example than this one? It should at least become a matter of great scientific interest, if not concern.

Carl

Posted in Daily Climate Letters | Comments Off on Climate Letter #1751

Climate Letter #1750

There is something new to look for now in the Weather Maps. Every day I make a quick check of sea surface temperature anomalies on the maps, paying special attention to average increases in the Northern Hemisphere, which lately have been running a little higher than the combined NH land/sea increases. That’s a strange thing in itself, and I will not even try to give it an explanation. Today I took notice of something else that is strange, out in the north-center of the North Pacific Ocean—a spot of surface water anomaly close to 5C in the middle of a large warm patch that averages nearly +4C. It’s a reminder of the ‘blob” event that occurred nearby in the years 2014-16, plus a recurrence of just one year ago, with annual peaks being in September. Here is today’s picture:

Talking to leadership of The Africa Society on significant problems is the task of this Committee, and cialis for sale online these issues include things like programming and community relations, planning, and also to engage young professionals in Africa-related activities and policies. The reason of taking Kamagra in place of cialis 20mg no prescription is that it does not cause erection on its own, sexual stimulation is required to cause you an erection. The spa has also offered various offers sildenafil buy online to the customers. The best thing about this 360 Austin bridge has also got a weathered rust finish so that the bridge easily blends around the nearby hills, lakes and other such natural structures. buying cialis cheap bought here

What’s going on? And why so many other large warm patches out in the wide open waters of the North Pacific where there is no shelter? Shouldn’t high winds and regular currents take care of things like that? A quick check of what the winds are like today might be revealing. What we are actually getting is a surprising amount of almost dead calm in places, probably in a pattern that has not changed much for quite some time in order for such large anomalies to have had enough time to build up:

Does this situation have any implications for climate change in general, either now or in the future?  That basically depends on the possibility that this is a type of phenomenon destined to become yet more common in summers to come.  It certainly did not happen with any degree of regularity late in the last century, or we would not be seeing these large anomalies.  If it is going to happen repeatedly there is one particular effect I can see that is of special interest because of its potential for impacting air temperatures not just over the oceans but upon continental land areas. It is happening now, via a process you are familiar with if you have been reading these letters. The process involves the creation of a substantial addition to the total amount of global water vapor that has the ability to rise several miles up and gain entry to the upper-level wind system where jetstream winds are in play. From this Pacific location the vapor streams that arise would be in position to sweep over both the polar region and much of western North America, and are indeed doing so. This next image will demonstrate how a principal initial requirement is being met:  

Give your attention to the surface area of the ocean that is located within the same area as the large anomaly featured above. Because of the added heat a good share of that particular area is now showing water temperatures of 25-27C, which is enough to provide all the energy needed to boost vapor streams to the specified altitude after evaporation.  Moreover there is an abundance of clear sky in the region—which can best be viewed on the Windy website—facilitating a smooth transfer.  Do we know this is happening now?  The best way to find out is by opening of the Precipitable Water map, where this is the picture today:

What I see is immense quantities of vapor in that area having weights of 40kg per square meter, or even more, that are headed on paths leading to both the NA West Coast and Alaska and beyond. If you are able to open the animated version of precipitable water soon enough you will see the complete movement happening with great clarity.  This sort of thing could go on every day during the late summer months of any year before pulling back for the winter.  Temperature effects, while constantly changing, will be felt over long distances, perhaps adding to the figures of climate change.

Carl

Posted in Daily Climate Letters | Comments Off on Climate Letter #1750

Climate Letter #1749

We’re going back to that South American cold anomaly today. It has a number of unique features that make it not just extra interesting but also extra difficult to properly explain. Cold anomalies of this size and intensity are very rare occurrences outside of the polar regions. Half of this one is in the tropics, and the tropical part has actually expanded a bit to the north since yesterday. The top image has a snapshot of all global anomalies for the day so you can see how it stands out. Also take note of how the Northern Hemisphere is loaded with warm anomalies and only a few cool ones. And don’t overlook the stats at the bottom, showing how the SH as a whole is considerably cooler today than it was three decades ago, nearly wiping out any net gain for the globe during this very limited period. It has been trending that way for several weeks now. The NH at +0.9C is quite the opposite, still going very strong.

Secondary hypertension is a official storefront online cialis condition brought on by an existing heart, arteries or kidney ailment. Firm muscles best prices cialis and joints can bring about unbelievable agony. For instance, ladies who suffer cialis sales australia from hormonal imbalances, menstrual or menopause problems, as well as sexual health. The doctor would determine the right dose of this remedy within 24 generic uk viagra browse now hours.

One strange thing about the anomaly is the way it is composed, which I did not pay enough attention to yesterday. It has a top part and a bottom part of almost equal size. The top part is made up of a heavy band of clouds, most of which are at medium altitude and rain-bearing. These clouds are part of a long trail that crosses the continent and then extends far into the South Atlantic, trending right along the upper edge of the strong jetstream that we viewed yesterday and which is about the same today. Here is the image of the long cloud stream and its rain content:

In the next map there is an image that shows how massive is the amount of Precipitable Water that exists in the Amazon basin. From the above map we can tell that the bulk of it must just be vapor, simply because so much of the region is currently unclouded. The thick clouds that we do see have basically formed only in proximity to the strong jet wind, creating what amounts to a parallel stream of its own, which surely must be telling us something more of interest. The cloud stream is obviously thick with water molecules, a thickness that suggests they have been collected from the entire area of the basin that lies immediately to the north. This must be be a continuous process, just as evaporation is continuous. Upon collecting the cloud of condensed molecules has clearly been compacted into a specific shape that continues to move to the east and south as a well-defined stream. The entire procedure of collecting and compacting suggests that the molecules are all endeavoring to move in a perhaps more decidedly southerly direction but their movement is being held in check by the power of the jetstream.

When clouds become concentrated in this way they inevitably block a large share of incoming solar radiation from reaching the surface, thus leading to cooling of the air. In this particular situation there may be an unusually high degree of blocking, enough to create anomalous cooling at the high level we are seeing in the top half of the anomaly under review. Then what about the lower half, where we see that the sky is perfectly clear? Why is the surface air being cooled by an anomaly of almost exactly the same high amount? I now understand that the lower air is cooling through its own completely different means, and that the similarity between each of the paired anomalies is purely a coincidence. Here it is “too little” water vapor in place on the blocked-out side of the jetstream wind, just the opposite of what we see on the other side, as today’s image shows again. The total package of containment affecting the dry area is not very well-defined on three of the four sides, but vapor entry is somehow being excluded.

There is no visible impact of this massive cold air anomaly on the configuration of high-altitude air pressure today, which I had earlier expected.  One possible reason for this may be due to so much of the anomaly being caused by heavy cloud cover, which could lead to a damping down of the usual contraction effect of air that cools. Such clouds are said to be heavy in real weight as well as opacity.  Just a thought.

Carl

Posted in Daily Climate Letters | Comments Off on Climate Letter #1749

Climate Letter #1748

Yesterday we looked at the principal physical mechanism that causes the pattern of high altitude air pressure to be configured in the manner observed, keyed to differences in surface air temperatures.  Today I wanted to write about the effect that any existing configuration has on surface air temperatures, in the form of feedbacks.  However, an unusual development has appeared on the Weather Maps which needs to be treated first, having the potential to be invoked afterwards as a prime example of how the wanted feedback works. To set the stage, I first need to review and reemphasize some general observations pertaining to the strength and location of jetstream winds, which strictly follow certain pathways formed by air pressure gradients and behave in a manner marked by pulses of intermittent strength.  The strongest winds occur when the gradients are sharpest. At this time the gradients in the south polar region are much sharper than those in the north and thus contain much stronger jets. You can see how this plays out today by looking at this next map of jetstream wind bursts and referring back to the north and south polar region air pressure maps in yesterday’s letter for comparison. Now take note of the strength of the jet wind crossing the center of South America, effectively cutting the continent in two, which is a key part of this discussion:

Along with cheap viagra prices this there are also many effective natural and herbal penis enhancement supplements you can try. On the other hand, to get the drug you have no requirements of submitting any prescription. viagra generic usa They contain all the health and beauty beneficial elements of this viagra 100mg magical palm fruit, but none of them taste as good as chocolate. Using viagra sildenafil buy together with other drugs for elevated blood pressure could suddenly dro.

Referring to the following map, this jet basically tracks along a regular pathway set within the red zone of air pressure, and then gains added strength when its pathway closely approaches a separate regular pathway on the fringe of the green zone. The latter is also accountable for creating the strong jet that is observed above as it crosses the southern tip of the continent before the pathway makes a sharp bend as part of a northward jog that soon peaks and heads back south again. The jet will temporarily lose speed while making the jog, then merges with the jet on the other pathway. This map clearly describes all of the movement of these two pathways. There is a third jet involved here that is too weak to be seen but still has some effect on the outcome. It follows an irregular pathway set up by the red-zone fragment on this map that can be observed off the coast to the west.

The combined effect of these three jets has been to completely seal off the airway over much of the southern half of the continent, preventing the potential entry of a number of streams of high-altitude water vapor flowing into the region from several directions.  In particular, notice how the heavily loaded stream heading south from the rainforest in the next map is completely brushed aside by the most powerful jet.  The overall result is a patch of atmosphere having greatly reduced water vapor similar to that of icy Antarctica:

The extraordinary absence of the most powerful greenhouse gas should have a significant cooling impact on surface air temperatures and that is exactly what we see on this next map, where some spots exceed minus-10C. This extreme anomaly is the result of developments going on around four or five miles high in the atmosphere, things that cannot be seen by human eyes but are open to instruments.

This anomaly was created on short notice by an accidental arrangement of several jetstream winds.  It has not yet had time enough to establish an ordinary cold type of imprint on the high-altitude air pressure configuration as a feedback. This can still occur, probably by means of an expansion of the nearby green zone, and I will be looking for that on tomorrow’s map.  Moreover, any such expansion of the green zone should effectively shift the jetstream pathway on its fringe outward to the west, where its jets might then be able to single-handedly hold off incoming vapor streams and thus prolong the life of the cold anomaly as a feedback.

Carl   

Posted in Daily Climate Letters | Comments Off on Climate Letter #1748

Climate Letter #1747

Some comments today on the Weather Map chart that is the most difficult to understand, named “500hPa Geopot. Height (dam)”. Everything about it seems like gibberish, except maybe for a few people who are graduate students or have actual degrees. The name of the map is inscrutable enough to begin with, the images are much like those you see on an ink blot test, it’s hard to find a clear explanation of what it means and even harder to transfer the information into physical processes that are ordinarily imaginable. This “thing” is still of great use to anyone who wants to do in-depth weather and climate studies, and there are a few ways to keep it simplified. Here is a partial view of what I am talking about, from the northern side of the globe:

There must be an adequate flow of blood to the organs, including genitals that buy sildenafil uk increases the sensitivity and excitement. Numerous relationships have cheap no prescription viagra been crushed due to this reason. Keep on reading more about the significant role of these pfizer viagra sales drugs are also available without a prescription. There is also facility of getting the free delivery of the product. viagra canadian pharmacy

Now the same thing, same day of the year, from the southern side:

The first comment is that time of year clearly makes a huge difference in the polar regions of this map, which are thermally isolated from each other, but not so much within the single wide ring encompassing all tropical and subtropical regions of both hemispheres where there is much less temperature variation.  These two shapes contain strong messages about the physical processes connecting the upper atmosphere to the surface below and the role of these processes in determining present and future climates.  The two polar regions are both capable of warming up much more than the tropics and are doing so even now, especially in the north. These maps hold hold the keys to explaining the reason.

The term 500hPa means the same as 500 millibars. Millibars are units of gravitational weight, not unlike pounds or kilograms, used exclusively for measuring the relative weight of any vertical column of air from the top of the atmosphere down to any designated surface. At sea level the relative weight for a column in any location will vary from similar columns in other locations but all of them are never far off from an average of 1000 units.  Going straight up from any one place the gravitational pressure will always be dropping, simply because there is less air bearing down as the column above is shortened, and thus fewer units of weight.  Now think about going straight up from some location and stopping at a point where your scale reads 500 units, and mark the spot.  Then do exactly the same thing from every other bit of surface area spread out around the entire globe, perhaps a million or so times.  All of the spots you have marked can then be assembled into an imaginary but complete new surface which will be a few miles above the real surface.

This imaginary new surface will not be flat, like sea level, but will be full of waves and ripples.  The actual height of any spot on this surface will always be expressed in meters, not miles, and will always be expressed relative to sea level, as if continental land did not even exist, which may seem confusing but has practical advantages. (When thinking about it I just give my own personal meaning to the phrase, “geopotential height.”)  This height, by the way, is always measured in decameters, or tens of meters—thus “dam”—instead of ordinary meters.

The actual height of this imaginary 500hPa surface in any one place is in fact highly dependent on the temperature of the air at the surface directly below.  When the air is warm the 500 unit gravitational point is going to be higher up, because warm air always expands and does so forcefully, thus counteracting the downward pressure exerted by the 500 units of gravity. The weight above is constant but there is more muscle lifting it from below. On the other hand cold surface air always tends to contract, and by doing so it puts less upward pressure on each 500 units of gravity, allowing the imaginary surface up above to settle back downward. That’s all you need to know when you look at the colors on the two maps above and refer them to the “dam” scale that is presented on the side. The two seasons represented on these maps are just starting to come down from their opposite peaks. Six months from now each of them will be more like the other is today, except that the continent of Antarctica has a considerable built-in bias all year long on the cold side. More to come on this subject.

Carl

Posted in Daily Climate Letters | Comments Off on Climate Letter #1747

Climate Letter #1746

Today I was doing a follow-up study of the big warm anomaly reviewed in yesterday’s letter and learned something of considerable interest that I think is worth writing about. We’ll be using mostly the same images, updated by one day, with one change. The focus will be limited to a rather small region where everything comes together in a way that makes it amenable to reasonable explanation. We’ll start with the anomaly map, where I want you to focus on the bit of unusually warm signature around western Washington and northern Idaho and how it stretches out from there. Why that spot? I was only wondering what this small feature could mean upon comparison with the remainder of the overall anomaly:

All the people of all classes cannot afford the medicine. sildenafil in usa The male can either http://robertrobb.com/trump-wins-one-loses-one-in-the-courts/ levitra viagra online experience betterment in his condition or may be completely free from the burden. Leaving the above, there is also something that many men dread happening http://robertrobb.com/disorderly-compared-to-what/ bulk viagra uk to them. If you are having higher tolerance levels then you can loved this purchase generic cialis increase the dose to Kamagra 100mg or you can also decrease the dose to 25mg.

The next map I looked at, for no special reason, was cloud cover, which turned out to be exciting because of the way a certain shape we looked at yesterday had now extended into an arc that seems to be sitting right on top of the warm anomaly spot and extensions observed in the first map:

What was this cloud doing there in the first place, and how could its presence make air temperatures down at the surface any warmer than otherwise?  So the next thing I did was to go over to the Windy website at https://www.windy.com/-Show—add-more-layers/overlays (Any picture you are seeing within it now will have changed because of the site’s animation.)  Windy will break down cloud layers into high, medium and low, and will also show how high the tops are.  There were no low clouds to be seen today anywhere over the entire warm anomaly, which is kind of interesting, and only a scattering of medium, but plenty of highs, which again were most dense in the spot of the arc.  Cloud tops in this place were mostly in a range of 20-30,000 feet, or about four to six miles, which is known to be jetstream country, so why not look for any possible clues in the Jetstream map for today?

I was expecting to see something special, but this went way beyond my expectations.  As you can easily see, the coincidence of a certain arc shape and the cloud arc shape above could not be more perfect. Things like this don’t happen by accident, and clouds don’t exist unless there is some water vapor handy to make them out of, so that means we should be seeking for still more clues in the map full of data on Precipitable Water:

Another surprise. If you look carefully I think you will see how one stream of vapor, moving straight north along the California coast, narrows down and then makes a sharp bend to the right, gaining the shape of an arc that is positioned in the same exact spot where the arc of jet wind is blowing. So now we have three perfect arcs, one on top of another, positioned directly above some spots that happen to be noticeably warmer than most other parts of the warm anomaly. What can we make of such a strange phenomenon?

I have two main ideas in mind. First, I think that when the water vapor stream collided with the jet wind, and the latter held its ground, the vapor molecules would be obligated to pile up and widely condense by simple acts of compression. The numbers and distribution should be plentiful enough to explain the cloud formation, even opening up the eventual possibility of light rainfall which one can look for tomorrow. As for the anomaly effect, these clouds are probably not thick enough to block any of the incoming sunlight, but they still represent a thickening in the presence of water molecules. Water molecules in a gaseous state, as we all know, are responsible for exercising an exceptionally powerful greenhouse effect that blocks the flow of infrared energy as it heads out toward space from the surface. Here we actually have an intensified concentration of water molecules in place but fewer of them are still gaseous. This would suggest that being in a gaseous state may not be necessary for a substance to have its usual greenhouse effect, as long as it is able to absorb and remit radiation. I think we are seeing evidence of such activity now happening in the high clouds that have rolled out in this place.

Carl

Posted in Daily Climate Letters | Comments Off on Climate Letter #1746

Climate Letter #1745

California is again struggling with too much heat and not enough rainfall, spelled out in the form of major wildfires. The warm anomaly, up to about 10C or 18F in places—as Death Valley reached a potentially world record high of 130F—covers a large-sized portion of western North America that we see on this map:

generic levitra 20mg This product is an excellent one which is prescribed to prevent any hair loss problems in males. Male impotency has been a general health issue of the intimacy nights of the males & making it more meaningful & also helps for fading away with the harsh memories of improper acts of intimacy. unica-web.com cialis 10 mg is available in 20mg packets & these must be provided in the form. It is important that you consult your doctor about alternative treatments if you are being affected. brand viagra australia Key ingredients in Lawax capsules include safed musli, Moti Bhasma, https://www.unica-web.com/data-privacy-german.html online viagra no prescription Kesar, Sudh Shilajit and Shatavari.

As customary for this space, I immediately suspected that water vapor was involved in creating this situation and so opened the Precipitable Water map, shown next.  The thing to look for is the signature of incoming streams containing high amounts of vapor that probably originated in warm Pacific Ocean surfaces to the west or south, and sure enough, there they are. In particular, an unusually wide stream is moving in from the southwest while a more narrow one is seen creeping up and into the coastal area from points directly to the south. (Both of these are revealed in more detail by going to the animated site at http://tropic.ssec.wisc.edu/real-time/mtpw2/product.php, where images cannot be copied and do not stay for long.)

Now for the big question: With such a large amount of water vapor moving in why are we seeing nothing other than a lot of heat and no rainfall? Shouldn’t all that newly evaporated water vapor be condensing and falling out, probably with a cooling effect, just like it does every day in so many other places? That’s what could have happened, but not this time. This was an entirely different kind of situation, where the evaporation arose from very warm surfaces under basically clear skies. It can keep going on like this for 24 hours a day, and for days on end, with virtually no sign of cloud formation. So where does all the vapor end up after it rises? As I’ve said here before, I think it forms into continuously moving streams and is quickly lofted by updraft winds to levels more than three miles high, where it enters into a new and different horizontal wind system. There it is picked up by passing currents of very cold and dry wind which are able to transport it for long distances toward the east and north without stopping or condensing. This kind of vapor may be said to have found a world of its own, call it “water vapor heaven,” where it has a special way of life and a great view of the world below as it passes over. On this map see how clear the skies are over much of the trail. The bar-shaped cloud formation you see is of a thin, high-altitude type, which I checked out on the Windy site, probably created by compression when the two vapor streams came together:

The rest of this story, which fully explains the cause of the temperature anomaly, you should already be familiar with. For an interesting sidelight, these same maps show a smaller scale anomaly in the Alaska area that seems to have been created in the same way by another stream that looks to have pursued a more convoluted course.  You can also spot some other parts of the US being hit with rainfall that apparently originated from evaporation in the Gulf of Mexico by vapors that were unable to move high enough to bypass the lower-level wind system.  They don’t have much time to waste in that situation before condensing and raining out.

I also want to reproduce the image of the high-altitude air pressure configuration that governs the flow of ordinary wind currents and jetstreams of the upper-level wind system.  You can see how air temperatures at the surface tend to be reflected in the pattern of higher and lower relative pressures up above, which I think is basically the product of a feedback mechanism.  Notice the dark red coloration of the area that lies over the very high temperature region of North America, probably existing as a marker of upward forces generated by the extraordinary expansion of warm air near the surface.  Also notice how the Alaskan warm air anomaly seen in the top map neatly coincides with the shape of the “slot” between two green lobes in the air pressure image.  That feature has the same kind of explanation but with lower relative temperatures for its cause.

Carl

Posted in Daily Climate Letters | Comments Off on Climate Letter #1745

Climate Letter #1744

I learned something today that is worth knowing about by anyone who has decided to pursue a close study of high-altitude vapor stream movement. When you find a warm anomaly and the corresponding batch of water vapor serving as the probable cause, and observe that the vapor is a very long distance away from any possible source, it is often not clear about how to identify that source. The long stream images that we see every day have almost always changed from the day before, and again from the day before that, and so on. So any spot far along the stream that you are looking at today may very well have a past history quite unlike anything that is showing today. Nearly all streams usually do not maintain a regular stream bed but keep shifting in shape and direction of movement almost every day. Mergers with other streams, as well as divisions, are not uncommon.

There is an easy way to resolve this issue. Pick out a batch of vapor that seems to have come to the end of the line, keep the location in mind, and transfer your view over to the animation website at http://tropic.ssec.wisc.edu/real-time/mtpw2/product.php. Run the five-day movement a couple of times and then stop it just short of the end.  Now run it in reverse, which you can only do one click at a time on a special button.  The result might be a complete surprise. For an example, look at this next image, where one can spot an advancing stream with bright blue shading that ends with a brown T-shaped umbrella close to the top of the map.  Can you guess where the batch of vapor that now makes up the T came from originally? 

This formation is used to create a Click This Link cialis no prescription vacuum around the penis. In other words, it is an inner battle once a bully throws cruel words or actions at another child. order generic viagra When the condition is left untreated, it can also lead to mental and the best viagra emotional stress. The most recent sexual improvement pills configured for men can overcome very nearly any situations identifying with icks.org cialis viagra cheap exhibition in the sack.

By using the animated reversal technique I soon found out that a great deal of mixing has been going on every day for five days, with considerable contributions sweeping in from the Siberian plains directly to the west.  The large, bright blue area below the T is the result of multiple mixing from many directions that has also been going on for days and is now leaving its own mark on the anomaly map.  More vapors that you can see today, moving in from the south or stretching off to the east, mostly shaded in dark brown, are strong enough to produce current warm anomalies of a milder sort. All of these are displayed on this map, and all provide evidence of the unique powers of high-altitude water vapor:

The entire long string of warm anomalies running thousands of miles from north to south in this case represents a mosaic of bits and pieces that appear to have separated away from streams that have originated over broad areas of ocean water. Sometimes when small vapor streams merge in a forceful way they are able to produce light rainfall from very thin high clouds.  It is possible to pick up and analyze some of these events by going to the Windy website at https://www.windy.com/-Show—add-more-layers/overlays?ptype,64.359,121.992,3,m:fsYaiJQ—which is set here on one of the special links that are generally useful for analyzing specialized cloud formation and behavior exclusive to extreme altitudes. Don’t overlook the link that shows the altitude of cloud tops. The amount of detailed data this site provides is just incredible!

Carl

Posted in Daily Climate Letters | Comments Off on Climate Letter #1744

Climate Letter #1743

For over seven years this Climate Letter was primarily a newsletter devoted to passing on credible reports about the causes and effects of climate change, and what the future might hold. I was also trying to learn all I could about the fundamentals of climate science, making up for endless years of neglect. The latter is now my primary interest, because I think I can make a contribution to the science in an area that has been partly mistreated and partly overlooked—the true power of water vapor as a producer of “greenhouse” energy. Science does not want to talk about it, in part because scientists got tired of responding to the harassment of noisy “deniers,” people who were well-funded by special interest groups, who kept insisting that water vapor was much more powerful than carbon dioxide or methane and there wasn’t anything we could do about it—which in many ways is true—so we should stop worrying about all the other stuff, which of course is false.

Science formulated a perfectly reasonable answer by explaining how the warming temperatures caused by the net effect of many different kinds of human activity were 100% responsible for the creation of certain “feedbacks” that could greatly amplify the damage but could not be independently controlled.  Water vapor was thought to be the worst of these feedbacks, but one that would never have become a problem without the initial warming, nor would it worsen any more if the actions that caused it to expand were curtailed, or it could even be diminished if the primary sources of temperature warming were reversed.  And that’s where science still stands, with little thought given to further scrutiny.

For various reasons I was never quite sure that this was the the end of the story. There are conceivable alternatives, which could take effect in any of several different ways. One of them relates to the possibility that unexpected quantities of water vapor could be added to the atmosphere in such a way that the additional vapor would be in a position to exert its full greenhouse energy potential without being controlled by any of the known laws of physics. Scientists have generally maintained that this cannot happen because air temperature sets firm limits on how much vapor the air can hold without reaching a saturation point, which would then cause it to condense and fall out. Reference is made to a relationship called the Clausius-Clapeyron equation, considered the equivalent of a law, as the governing factor. But could unusual conditions arise where the relationship no longer holds? I believe that is already happening and has the potential to progressively grow in importance, all because of things revealed in “Today’s Weather Maps” that I have been writing so much about lately.

After a year, the study participants’ blood pressure lowered by over 12 percent, deeprootsmag.org viagra soft tab but there was a 30 percent reduction in hot flashes. This approach and subsequent research led to new diagnostic Disorder with Dysphoria Irregular Temperament (TTID), which means a potential change in the size or shape of a breast. 100mg sildenafil When you buy Kamagra online, or any other disorder or disease a patient may be suffering erectile dysfunction, a condition in which men are not able to nicely set up which between the 3 drugs would function greater than the other given that the outcome is distinct from a single particular person to one more. purchased here purchase levitra Dosage should be limited to 100 mg in a cheap no prescription cialis day one hour before you plan to make love.

Warmer ocean waters are definitely causing more evaporation, and no limit can be set on the future amounts of production. Condensation and precipitation have definitely been growing along with it, as expected, noticeably participating in everyday weather systems. What is different in my study is happening outside of everyday weather systems, by means of utilizing the separate wind system found in higher altitudes of the atmosphere. Specific conditions arise in certain tropical or subtropical locations allowing large quantities of new evaporation to rapidly be lofted into positions giving them access to these higher altitude winds, with no sign of condensation involved in the process. The winds in this system are naturally very cold and dry, and they never stop moving, in a direction that is normally toward the east and toward higher latitudes. They can carry continuously flowing streams of vapor.for thousands of miles with no sign of condensation until something gets in the way that significantly alters or blocks the flow. In that event both condensation and precipitation are likely to occur, possibly being enabled simply by compression of the gases.

While these vapor streams are coursing across the sky their greenhouse powers must inevitably be unleashed, with effects reaching all the way down to the surface.  The effects are strictly local, and also temporary, since the streams all have limited lifetimes.  They may also be very powerful, because the gases within the streams are relatively concentrated, often greater in amount than the total amount of all the precipitable water in the lower wind system situated above any and all of the same locations.  The total effect on temperature is determined simply by combining the total power of both bodies of vapors. The manner by which the vapor streams are stymied by high-strength jetstream wind currents in the upper wind system is another subject of interest, one that I will save for another day.

Carl

Posted in Daily Climate Letters | Comments Off on Climate Letter #1743