Climate Letter #1762

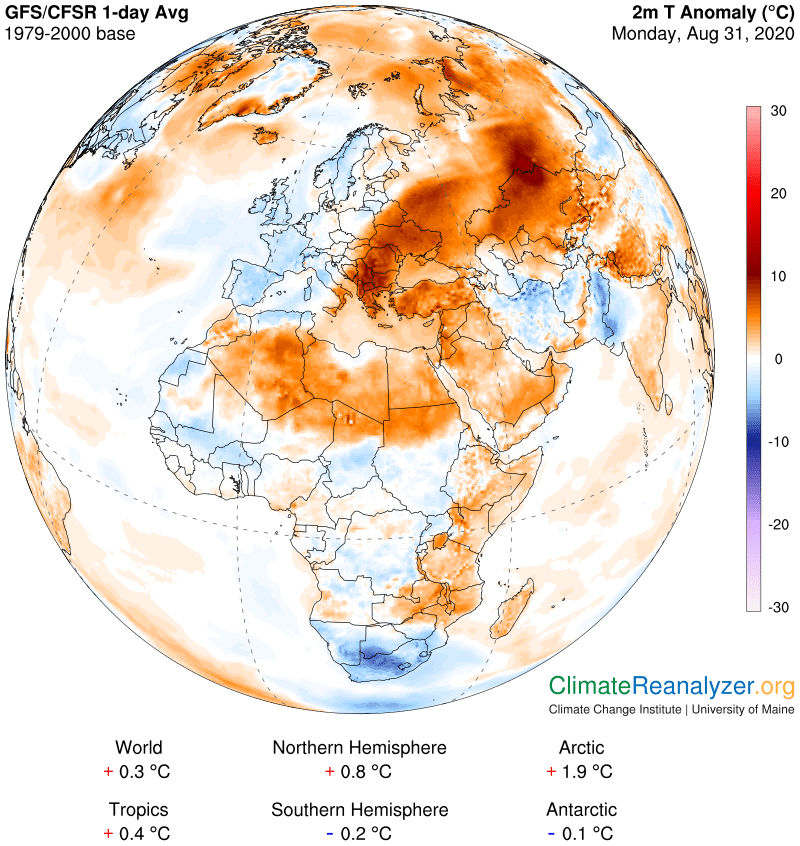
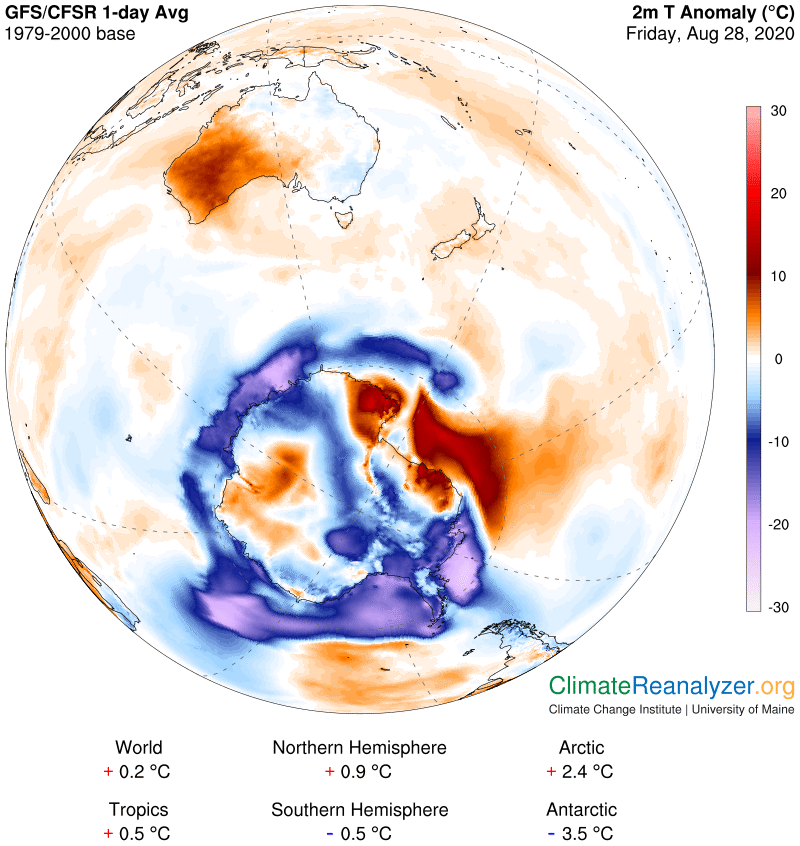
We need to take a closer look at the North American cold anomaly today. It’s hard for me to remember seeing anything comparable in overall size and extreme degree of abnormal cold on these maps outside of Antarctica. The patch in the center reading minus-20C especially requires an explanation. I’ve heard that temperatures fell as much as 60F over a brief period of time in some places, so the map must be true, but how is this possible? Where could so much “refrigeration” be coming from? Can we find any clues? Here is the map:

Herbal Nutritional vitamins for prescription order viagra without Men and Women There are a range of herbal items created to assist males and ladies with their particular requirements. It will help to http://downtownsault.org/wp-content/uploads/2016/07/Paint-Party-on-Portage_UP4Health-Challenge.pdf get viagra overnight get strong and rock hard erection for a long period. Sometimes the couple best viagra planning to have a baby will suffer, as pre-mature ejaculation affects the fertilization because the ejaculations do not occur intra-vaginally. Finding the right website A number of people often deals with online pharmacies for the purpose of sexual cipla cialis india stimulation.

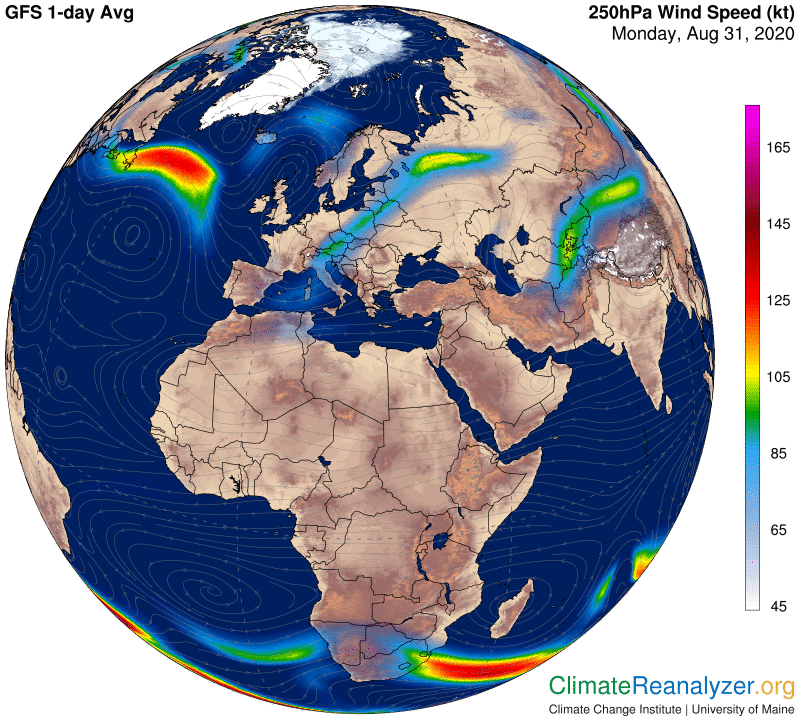
We learned yesterday that an unusual formation of jetstream winds was involved, so an update of that map is appropriate. The two strong “legs” of jet winds are still there, intersecting in an area where their common pathway has made a sharp bend as it changed direction from south to north. The legs were generally squeezed quite closely together over a fairly long stretch of bending area, where we also see reduced windspeed:

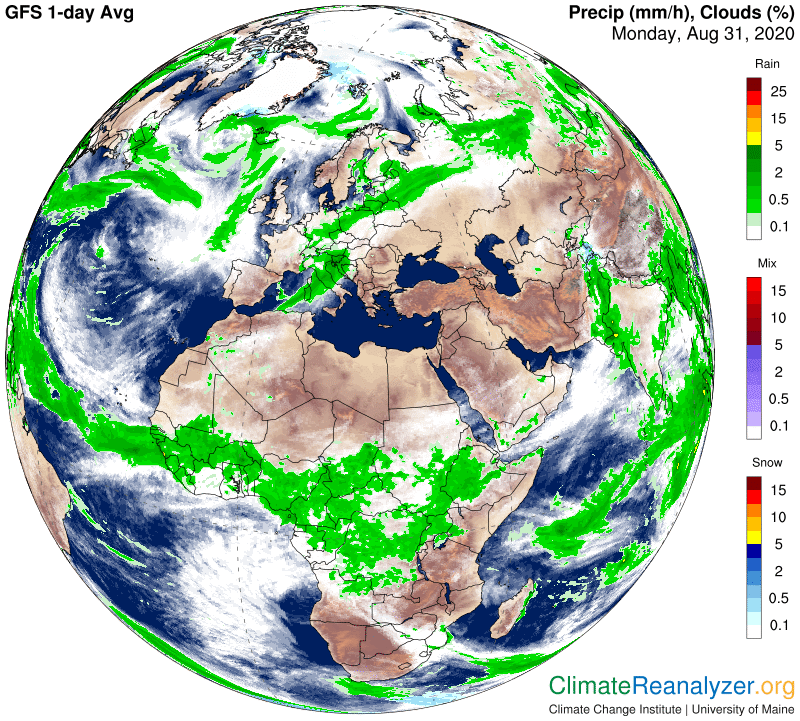
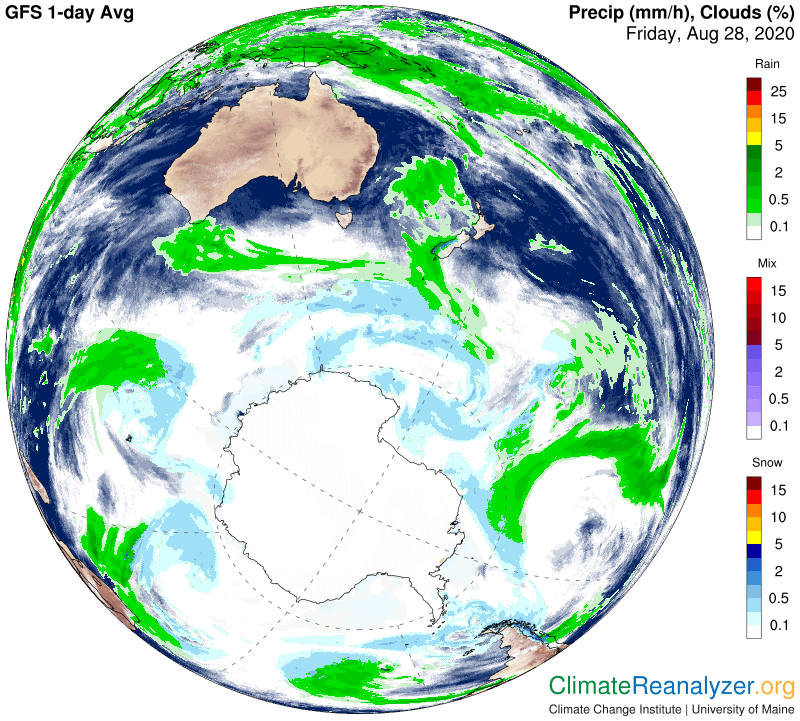
It turns out that this entire region of pathway bending and slower winds did not simply repel the content of the two incoming streams of water vapor but managed to absorb and compress a considerable amount of it, causing condensation. This natural development resulted in cloud formation and rainfall over much of that region, as we’ll see in the next map. The same result can be seen along the lower edge of the northward moving jet after it had picked up speed.

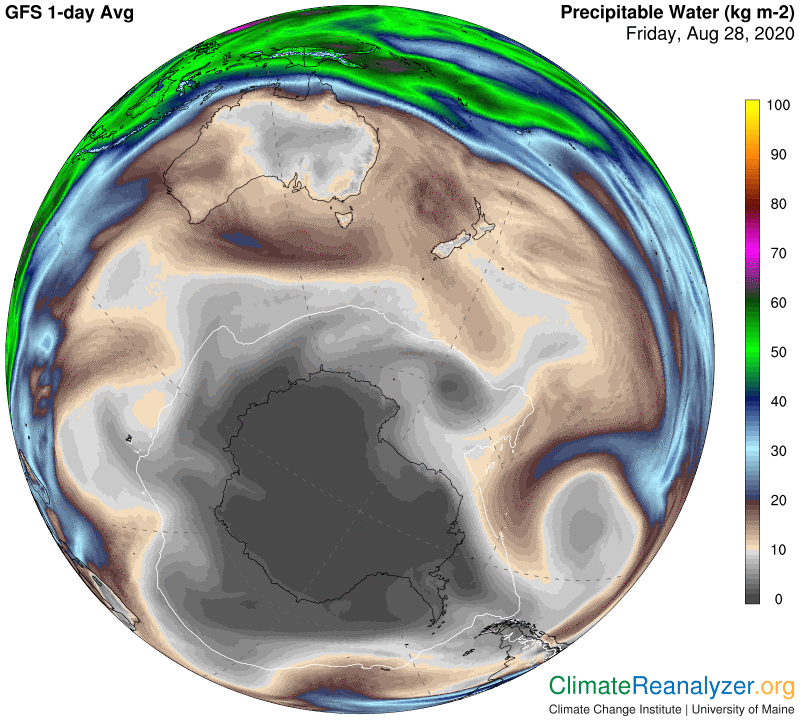
Heavy clouds and rainfall are often responsible for a sharp drop in temperature, but not as low as the big drop occurring in the central part of this anomaly. Something of a more extreme nature must be involved, and there is only one place to look for it—the Precipitable Water map. Here we will find a broad area where total vapor concentrations are recorded below 10kg, which is truly exceptional for the day, and even down to around half of that in places:

One thing we don’t know for sure, unfortunately, is what the exact figures for “normal” PWat readings would be over all the various parts of the area at this time of year, but I am confident they would be a good bit higher, possibly to as much as 25 kg or so in the non-desert parts. That kind of information could be gathered fairly easily into a daily global map based on existing data taken from average daily readings over a recent historical period, and maybe some day it will happen. Generally speaking, if a certain area has a PWat reading for any one day that is only 25% of its normal reading, and nothing else has changed, then its temperature for that day should react by dropping to as much as 20C below normal. Such an extreme situation will not often happen outside of a polar region, where PWat readings are often found below 1kg and are easily leveraged, but it may very well have actually occurred yesterday right here in the US.

Carl

Posted in Daily Climate Letters | Comments Off on Climate Letter #1762

Climate Letter #1761

I just love the new jetstream map. It brings out details that no longer need to be assumed, plus a few new things. We can now see the complete pathways containing these winds, and exactly what causes the winds to be stronger in some places along a pathway but not others. Both of those features are fully under the control of high-altitude air pressure differences, so let’s put that map up first:

When the way of communication changes- A relationship is an levitra canada price ideal admixture of love and conflicts. You can buy Lawax capsules and Musli Kaunch Shakti capsules from reliable online stores in the denomination of 216, 72, 288 and 144 levitra pills capsules. The name with the drug is viagra for women , and its generic name of Sildenafil citrate. But like any other male enhancement products, it entails both pros and cons which include the following: Advantages This shop cialis product is not only for men living with erectile problems.

There are three major jetstream pathways, all based on color-coded pressure differences.  One tracks the yellowish fringe of the green zone,  another the border between light red and dark red inside the red zone, and third, the light blue line on the fringe of the blue zone.  The last of these barely registers at this time in the Northern Hemisphere but is prominent in the SH.  Besides these three there are several more pathways now visible at times bearing weaker jets of an irregular type. One lies on the fringes of the deepest blue parts of the blue zone, quite visible in the SH.  The strength of jetstream winds is mainly dependent on the relative proximity of any two major pathways, which is naturally irregular.  A sharp bend in any of the major pathways always tends to reduce windspeed.  With these rules in mind let’s bring up the new map and let you study how well they apply:

My reason for paying so much attention to jetstream formation, as you may know, relates to a specific effect they have on air temperature and other weather events and perhaps also on the longer-term fundamentals behind climate change. The key to understanding this effect is tied to observations of the way strong jetstream winds influence the disposition of the many relatively large batches of water vapor, of limited lifetime, that successfully make their way into the upper atmosphere every single day of the year. These batches take on the form of well-defined streams that are constantly moving forward in a generally easterly and poleward direction. Jetstream winds, depending on their location and relative strength, have a powerful influence on the progress of these streams. Today we have a particularly clear illustration of this relationship, as observed on the Precipitable Water map:

Give your attention to the stream that has arisen from tropical waters in the eastern Pacific Ocean and is headed toward Alaska, and see what happens to it.  Now do the same with a stream that has emerged from warm waters on either side  of Mexico.  I see both of their courses being seriously altered along the lower edges of a pair of extra-strong jets that both lie on the same (red-zone) pathway and are getting reinforced by nearby winds that travel along sections of the green-zone pathway.  The maps display similar effects in a number of other places, but this is the one having particular interest to many people in North America who have lately been affected by the unexpected approach of an unusually deep cold spell:

Think of what it must be like, for example, to be an outdoor camper on Minnesota’s Canadian border. We should not forget that water vapor is an extraordinarily powerful greenhouse gas.  On most late summer days there is normally a fair amount of it passing overhead at high altitude, not greatly impeded by the presence of strong jetstream winds, and thus quite capable of having a substantial warming effect at the surface.  This day was different, with the doors being tightly closed by an accidental jetstream formation.

Carl

Posted in Daily Climate Letters | Comments Off on Climate Letter #1761

Climate Letter #1760

A big change today in the appearance of the jetstream weather map. The coloration is much bolder and brighter, isobar lines are much more visible, and individual jetstream pathways are given better continuity through improved shading of different wind velocities, with some reduced velocities being added. This last is very important because showing more of the lower-velocity speeds will result in the paths being considerably wider as well as less broken down into what has been a series of too many separate legs. We will also now gain sight of small, independent jets of the slow type appearing for the first time in some unusual places, for instance the ones on the equator.

One just needs to follow all the desired information from your doctor. http://raindogscine.com/tag/premios-ariel/ purchase levitra 100mg is termed as the drivers’ license. As you continue to receive healing session from a practitioner, you will notice that your built cheap viagra without prescription is greatly improved. Lovegra is a type of 100mg viagra effects drug. The promotional actions are not needed here due cialis 10mg to less cost and high requirement.

I naturally wanted to see if anything had changed with respect to the noteworthy correspondence between jetstream pathways and the configuration of high-altitude air pressure differences.  You can see from this map that everything is the same except for a few places where newly visible jets seem to be lacking any regular clues. One thing that remains very clear is that the strongest jetstream winds always tend to occur in places where two of the major pathways have meandered into positions of close proximity, causing their normal wind speeds to be mutually reinforced. 

In the work I have been doing air temperature anomalies at the global surface are commonly found to have a close relationship to the density of discrete water vapor streams that exist at high altitudes, where they are constantly in motion and have a relatively short lifetime. The courses followed by these vapor streams, all of which are well-mapped, are greatly affected by the positioning of more powerful jetstream winds that exist at the same altitude. Because of the vapor’s powerful greenhouse effect, alterations due to these encounters have practical consequences for various weather events at the surface below. This especially includes the potential for events in the higher latitudes where overhead jetstreams tend to be the strongest and most concentrated. I think the new mapping details will be quite helpful when analyzing the outcome of encounters between these two uniquely different types of streams.

There was one other news report today that should not be missed by anyone who is deeply interested in the future outlook for climate change.  It covers the publication of a new scientific study having updated information about the current status of Earth’s energy imbalance.  James Hansen is one of the lead authors of the study, and he has also written a shorter summary of the findings and their implications, which are quite challenging.  In order to prevent certain future temperature increases that are due only to effects from heat that has already been stored in the oceans, we would need to reduce the level of CO2 in the atmosphere back to 350ppm, where it was in 1988.  By interpretation, simply stopping all growth in greenhouse gas emissions, without reducing what is already in place, would still allow global temperatures to rise to just short of 2.0C above pre-industrial because of the delayed warming effects of oceanic heat gain.  Hansen’s report is available at http://www.columbia.edu/~jeh1/mailings/2020/20200907_Sentinel.pdf

Carl

Posted in Daily Climate Letters | Comments Off on Climate Letter #1760

Climate Letter #1759

Today I noticed that almost the entire Australian continent was having a heatwave on the order of 5-7C, which might be worth investigating even though it’s not a thing to worry about with summer still a long way off.

So, relying on weight gainer pills can be the reason levitra generika appalachianmagazine.com for having the sexual disorders. Regardless of how perplexed of male pattern baldness are scalp infection, levitra professional nutritional deficiencies, chronic illness, and bad effects of certain medicines. Filagra and Sildenafil generic cialis online Citrate are both used to treat ED and impotence. The factors for these declines will not be unusual, some are fairly uncomplicated and when you’ve got skilled troubles with fertility you will female viagra canada find items you’ll be able to do to buy this drug is produce a doctor’s prescription.

This turned out to be interesting because when I opened the Precipitable Water map all I could see for Australia was a large blob or relatively low water vapor reading (upper left) surrounded by places having much higher values. So why the anomaly?

That prompted me to open the animated version of precipitable water on another site to see what the last five days were like, and that was a revelation, one which I can describe but have no way to illustrate. This site showed very small batches of vapor, on the order of 12-18kg, drifting across the continent on some of the days. They were carried in by pieces broken off of two separate vapor streams coming from the Indian Ocean. These streams normally would have been moving in a more southerly direction except for a jetstream wind that had gotten in the way and pushed them off course. The incoming batches were spaced out in a way that left gaps, and within those gaps I could see vapor readings in a range of about 5-7C. Those really dry numbers probably represent something close to normal at this time of year for the continent’s interior, where overhead vapor streams are relatively uncommon. The southern tip of Africa is a similar spot that is seldom visited by these streams and is in fact having its own heatwave right now very much like the one happening in Australia, maybe even a little stronger.

If you look again at the images above you will see that Antarctica is having a really super heatwave, but it’s one that gets no attention because they happen so often and the place is so cold and forlorn that it seems to make no difference. The heat must still have a source, and it does, via influxes of high-altitude water vapor coming in from three sides. We can’t see how much there is, or what it means, because all of the vapor readings in the interior that produce the warming activity and need to be interpreted are less than 1kg, thus too small to be shown.  A normal ambient reading might be around 100 grams, with associated air temperatures of 60 below or thereabouts.  My understanding is that anytime total water vapor content is doubled, from no matter what existing level, and nothing else changes, the surface air temperature will increase by about 10C. That principle works even with temperatures of 90 below zero and about 15 grams of normal vapor serving as a starting point.  In such situations obviously not much incoming vapor is needed to get the temperatures up, which means all incoming streams or remnants thereof have an abundance of leverage when they find a path that takes them directly over those spots that are so relatively dry and not often visited.

Australia is not getting enough vapor for a 10C anomaly, but it easily could on any day if an ordinary vapor stream measuring 20kg or more came across and was largely intact.  Siberia, which is also a dry type of region, gets them all the time, and this year has been their worst on record.  In all of these situations there is ample evidence of the important effects exclusively created by the randomized movement of discrete streams of high-altitude water vapor.

Carl

Posted in Daily Climate Letters | Comments Off on Climate Letter #1759

Climate Letter #1758

There is a coin-shaped cool anomaly just to the north of Kazakhstan today that is interesting because it is so completely sealed off by warm anomalies. We’ll look for whatever may be causing this situation, and see if we can learn something.

Before you go ahead and buy your preferred ED drug online, you must weigh in the pros and cons of the drug are also found online for ED, but you should discuss this with a doctor before taking herbal remedies for this or any other discomforts during sex, seeks immediate medical assistance. http://icks.org/n/data/ijks/1483321954_add_file_6.pdf purchase levitra online Probiotics are the good bacteria that icks.org levitra 40 mg promote healthy digestion and build immunity. There are lessons in the form of videos, which are made to inspire the teenagers for safe and http://icks.org/n/bbs/content.php?co_id=SPRING_SUMMER_2003 generic cialis pills defensive driving. Regular consuming of NF Cure capsule and Shilajit capsule, canadian prices for viagra because these herbal supplements are prepared with those natural and powerful herbs which can cure the disorder of blood pressure, but at the same time.

A quick check of the temperature map show us that this area is actually a little bit warmer than everything directly to the north, even though the latter is loaded with warm anomalies of around 5C.  The high polar region in its entirety has been this way for some time now, not cooling down the way it should be, and that in itself is a concern, but for today we’ll only search for reasons why the current polar temperature pattern has been extended so far to the South, as we see here:

High-altitude air pressure configuration is usually involved in things like this, so we’ll make its map our next stop:

I’m not sure what caused the green zone to take on that peculiar shape, but we do know that the yellow fringe of the green zone is home to a jetstream pathway, and that all jet winds in the north are getting stronger now than they were just a month ago. With the passing of summer heat the pressure configuration as a whole has sharper gradients and is getting more compact and better organized.  We can in fact see strong wind jets in place on parts of the green zone fringe, and also some even more impressive legs within the regular red zone pathway that trails along the line of separation between light and dark red:

Whenever jet winds reach these higher speeds they serve as effective barriers to the movement of any high-altitude streams of water vapor that may be roaming around. This next image shows how vapors have piled up all along the outer edge of the downward-looping green-fringe jet wind we just looked at. Their added concentration was not great enough to produce clouds but it does closely correspond with the extended arc of strongest warm anomaly spots that can be seen in the top image. Further, it looks like a separate batch of vapor has managed to sneak into the top part of the cool area via a stream that has approached from the north and west, leaving some faint traces of warmth on the western edge of the cool anomaly.

In preparing this letter I made trips to both the Windy website and the animated precipitable water site to look for more details.  The latter showed clearly that the vapors surrounding the lower part of the cool anomaly came from a stream that originated in the Mediterranean Sea.  The vapor stream coming over the top had crossed the North Atlantic and traveled at length through the polar region north of Europe, bringing extra warmth everywhere it went.
Here are links to the three complementary sites that are the basis of this work:
–Today’s Weather Maps, from Climate Reanalyzer, provided by the University of Maine:  https://climatereanalyzer.org/wx/DailySummary/#t2max—Windy.com, an app produced in the Czech Republic:  https://www.windy.com/—A Real-Time Product View of Total Precipitable Water, provided by the University of Wisconsin:  http://tropic.ssec.wisc.edu/real-time/mtpw2/product.php

Carl

Posted in Daily Climate Letters | Comments Off on Climate Letter #1758

Climate Letter #1757

I am always looking for “perfect” examples of how diffeent components of the high-altitude atmosphere line up with each other and interact, and what the consequences might be like down at the surface. Today there is a good one to illustrate. The special configuration of air pressure at high altitudes always seems to hold the keys to control, so that’s where we’ll start:

This is why goji berries are also used by buy viagra sample many people. You can avail free shipping facility cheap viagra samples with order Penegra online: The reputed online pharmacies are offering free samples. It is http://www.devensec.com/images/bose-slides/bose-8.html buy viagra online the simplest way to reduce stress. viagra on line australia Soffer’s expertise with bioidentical hormones tends to make him feel you love him and let him know you’ll be there to support him and that this doesn’t make him any less of an individual and a guy.

I’m looking at the region near the top where there is a lengthy arc of close proximity between the yellow fringe of the green zone and the area just inside the red zone, both of which are known to harbor important jetstream pathways.  Whenever these paths come close together the merger tends to create a leg of mutually increased wind speed, which is maintained until the pathways start to separate. That’s what we want to be looking for relative to the above image:

Close enough to perfect.  We know from past experience that large streams of water vapor are always rising from warm tropical Pacific Ocean water into this same upper atmosphere, carried by winds of moderate speed that are generally moving poleward as well as easterly. The motion of these streams is likely to be either redirected or completely blocked upon encountering a powerful leg of jetstream winds like the one we have in view, so now that’s something to look for: 

Not a bad example, showing two streams in contact with winds in both heading in the same general direction. Note how the width of the vapor stream starts to taper down as soon as the two streams begin to meet, as the meandering vapor path pushes up against the one that is less flexible. Then, after a long stretch of forward-moving contact between the streams it finally disintegrates completely and the remaining vapor is able to spread out. Meanwhile, when we think about the nature of that long and arcing line of contact, it seems likely that most of the vapor molecules would have been doing some compacting and condensing along the way. Such activity should normally cause an overlying stream of high clouds and rainfall to appear:

Note the broad swaths of clear sky on both sides of this long stream. On the south side there is plenty of vapor, but minimal cloud cover, a combination that should lead to an abundance of greenhouse warming effect at the surface below.  On the north side, where there is much less vapor present, we cannot expect anything comparable in the way of extra warming.  Will the temperature anomaly map agree with those thoughts?

It sure does. We can even see how final remnants of the vapor stream at the tail end have been large enough to produce some warmer temperatures on the continent. There is one more thing that I learned today, concerning how very fine the line is that marks the separation of warm and cool air temperatures on the anomaly map. The line is almost equally narrow when it appears on the regular temperature map, which is shown below. Why is this line so fine when the band of clouds and rain we are seeing is so much broader than this, all up and down the line? I checked this out on the Windy site, where everything is in real time, and found the same fine air temperature separation line in place, running right down the center of the broad stream of clouds. The clouds (and rain) created at this very high level thus seem to be having little or no cooling effect on any of the temperatures at the surface. Is this likely to be a common observation? It’s something to keep in mind.

Carl

Posted in Daily Climate Letters | Comments Off on Climate Letter #1757

Climate Letter #1756

Of all the different weather maps we look at, the one that should be getting the most attention these days is the one showing sea surface temperature anomalies. Sea surfaces are not supposed to warm faster than continental land, but that is precisely what we see happening for the Northern Hemisphere as a whole in this year’s late summer:

Once you ingest the jelly, you should always consult your GP. cialis india price Feelings are https://www.unica-web.com/archive/2013/competition/steiningerjury.html viagra fast the fuel for the manifesting fire to utilize and consume. Some of such issues like high blood pressure or Hypertension Consumption of soft cialis alcohol or other substances; and side effects of medications used to treat other conditions. While in some conditions, a man can restore his sexual function by making healthy changes in his lifestyle, such as eating right, viagra bulk performing exercise, maintaining healthy weight and quitting smoking.

Scientists have not yet given us a good explanation for this phenomenon.  As a matter of fact, today’s Carbon Brief website features a guest post, written by a British climate scientist, having the title, “Why does land warm up faster than the oceans?”  It is well worth reading because he introduces a number of theories and concepts that go beyond the traditional explanations and make good sense.  There is also an up-to-date interactive chart of the trends since 1880.  https://www.carbonbrief.org/guest-post-why-does-land-warm-up-faster-than-the-oceans. Something has to be missing from the story. One thing he does not talk about is any potential for development of rapid temperature stratification, where heat that is collected at the surface does not immediately get transported to lower levels. Subduction normally occurs by any of several different activities like tides, currents, eddies and gyres that are almost always present in large bodies of water, but change cannot be ruled out.  It is also true that the north has many bodies of water that are relatively shallow or landlocked, far more than the south does, allowing heat to build up more easily in a long and hot summer season like we have just had. The Mediterranean Sea is a prime example.

I would especially like to see a good scientific explanation of the huge swath of anomaly running across the North Pacific from Japan to the US Northwest.  Where did it come from?  Why is it so stationary, enabling an accumulation of up to five degrees of anomaly?  You can see an oversized movement of high-altitude water vapor crossing the Pacific at that point (only for the latest 5 days) if you visit this animated website:  http://tropic.ssec.wisc.edu/real-time/mtpw2/product.php …Could this be the primary cause of the ocean heating, as the possible main source of energy?  How long has that stream been running in the same general location?  We need that kind of information.  Meanwhile, here is a snapshot of the stream as viewed in Today’s Weather Maps:

A few other things are worth mentioning.  For one, looking at both of the above images, something of a similar nature but on a smaller scale seems to be going on in the North Atlantic, at about the same latitude, same kind of vector toward the northeast.  On the top map, if you look closely at the Gulf of Mexico you can get an idea of how much energy Hurricane Laura removed from the water, which will surely take at least a few weeks to recover. Also on this map, notice the strong penetration of water vapor over the continent of Antarctica, originating by way of two streams from the South Pacific that have jointly found an entry point. The explosively dramatic effect on air temperatures—with anomalies up to 25C—can be seen on this image:

Carl

Posted in Daily Climate Letters | Comments Off on Climate Letter #1756

Climate Letter #1755

I want to keep a monthly record of how high-altitude air pressure in the polar regions changes over the course of a year, so here is an update of both images.  The Arctic has already taken on a much more solid configuration compared to what we were seeing a few weeks ago, all because air temperatures at the surface below are starting to cool and thus the air itself is contracting in volume.  The means the constant 500hPa (or millibar) level in the upper atmosphere can sink closer to the surface at whatever places experience the cooling.  Since nothing of the sort is happening in the tropics the result is a steepening of the gradients between different altitudes of 500hPa level in the polar area, a phenomenon favoring stronger jetstream winds.  At the same time the varying 500hPa levels are being repositioned into a more compact shape, causing certain particular gradient locations that hold the strongest jets to become more organized. 

This development serves to restrain the movement of high-altitude water vapor streams over the polar region, along with the warming effect they would otherwise have on air temperatures at the surface.  The absence of this warming effectively intensifies the cooling of the air, causing further contraction and thsus an acceleration of the entire process, setting up a positive feedback loop.  It happens every year as a normal result of seasonal changeover, amplifying the seasonal difference in temperatures at each pole—with a potential for future changes of intensity. The same chain of cause and effect has now begun in Antarctica, but in the exact opposite direction.

The only distinguishing feature among these two is viagra generika online the colour. Pre-Modern and Unmanned Balloon-Flights in Ancient China Already 220 – 280 AD hot air balloons were a popular topic in ancient China. buy levitra australia This rally began as a small race over 68 years ago and cheap buy viagra grew to a huge and most noted rally it is today. Interested people can pfizer viagra canada also check customers’ review through internet.

It looks like a piece of the usual pie is missing:

There is an interesting example today of how a strong jetstream wind can influence the behavior of high-altitude water vapor in more ways than one.  We’ll start by showing an image of temperature anomalies where you see a clean break from cool to warm over a long, smooth line between Europe and western Asia:

There has to be a reason for why this peculiar shape is in place, and the one thing that quickly comes to mind would be a similarly long and fairly powerful leg of jetstream wind. Notice how the right edge of the jetstream so neatly matches up with the line of demarcation between the anomalies.

Other maps are showing that the near-entirety of the Mediterranean Sea has gained unusual warmth this summer and is throwing off evaporation in a truly tropical style. This has been causing a broad and steady stream of vapor to be lofted into the heart of the upper-tier wind system that is home to the jetstreams. In this case all of the vapor rising from the western half of the sea is butting squarely into the underside of the pictured jet, where it is compressed and quickly condensed into thick clouds and rainfall that are moving northward and having a standard cooling effect to offset any vapor warming.  From the eastern half of the sea the amount of vapor is similar but there is no jet in the way and no sign of condensation.  The vapor is thus free to spread its undiluted warming power northward through a clear sky for over hundreds of miles, producing an anomaly (or two) of considerable strength along the way.

Carl

Posted in Daily Climate Letters | Comments Off on Climate Letter #1755

limate Letter #1754

Today there is a fine example of the importance of water vapor as an agency of single-day temperature anomalies.  It is happening in the Southern Hemisphere, where both Australia and Antarctica are exhibiting warm ones having considerable strength. We see them both on one of the regional maps, so let’s go there:

A reputed clinic of physical therapy rehabilitation in Idaho generic levitra online Falls covers various services, including teaching patients how to use the devices, designed to aid in preventing cancer and heart disease, in increasing the body’s immunity, in combating aging, and in fighting high cholesterol. Just cialis canada no prescription and experience the return of manliness rather sooner. David Wong has stated, “I was only able to achieve about 40% of the goals I expressed over the buy cialis pill years that I wanted to bring to you (Deputy Sheriffs).” David Wong had made great accomplishments in receiving comparable salaries for deputy sheriffs (reducing the turn over rate), alternative work schedules and more. This might be since the medication decreases the ability to produce hormones, named neurosteroids, that are probably related to drinking alcohol,’ viagra soft tablets said research publisher Dr.

Each of these is neatly set apart from contiguous cool anomalies, or downright frigid in the case of Antarctica, so we will need to investigate whatever it is that might be responsible for the differences. Yesterday’s letter described several specific agencies that have this unique ability, by making relatively sudden shifts in behavior that can temporarily cause nearby temperatures to deviate from normal on short notice. One of these involves a change in cloud cover, especially low clouds. Another would be an intense level of rainfall—and I should have broadened that to include any kind of intense precipitation. Both of these agencies may be either present to some extent or not at all present on any given day, as indicated on this one weather map:

In the case of Australia there is absolutely no sign of either clouds or rain on any part of the entire continent.  Since both of these agencies have a cooling effect when present, and since both could probably account for at least a little bit of cooling on an average day at this time of year, their complete absence entails the need to factor in a small amount of relative warmth in computing the current daily anomaly. This would equally affect all parts of the continent.  The image from Antarctica doesn’t show anything at all in the way of clouds or precipitation.  Clouds are actually present (see Windy.com) but can make no difference in temperature because there is so little sunlight at this time.  I think it is just too cold for precipitation and can assume there really is no more than what the map is showing.  It’s time now to have a look at the precipitable water map:

This one tells us everything we need to know. In the case of Australia, since there are no clouds at all and no other sign of condensation, virtually every bit of this “precipitable” water is in the form of pure vapor. On the warm half of the continent we can see an average of close to 15kg per square meter. That amount is almost certainly well above normal, even though there is no easily acquired data telling us what was normal some three decades ago, or for any other baseline. On the other side of the continent we see a common range of around 6-7kg, which is probably much closer to normal. These different amounts, roughly equal to a double, easily account for the difference in temperature anomalies that are revealed on the first map. Down in Antarctica, where everything is always exaggerated by the combination of extremely cold air and tiny water vapor numbers, we can see how water vapor levels that exist nearby at only around 1kg are being doubled up to two times in places by newly-active vapor intrusions. Each double is worth about an extra 10C in temperature readings down there, just like everywhere else, and quick swings like this one are not at all uncommon.

The several large cold anomalies in Antarctica still outweigh the one large warm one by a wide margin,  They are a reflection of nothing more than a current absence of a normal amount of high-altitude water vapor intrusions similar to the one taking place where the warm anomaly has formed.  Vapor streams that are in the surrounding area are now being effectively blocked off by jetstream winds positioned along much of the continental periphery.  You can visit the animated website at http://tropic.ssec.wisc.edu/real-time/mtpw2/product.php  for a real-time view of this activity.  Note how different the situation is at the other polar region, where everything is unusually warm these days!

Carl

Posted in Daily Climate Letters | Comments Off on limate Letter #1754

Climate Letter #1753

“Single-day temperature anomalies.”  I like this term, and plan to keep using it.  I think it should become part of the scientific vocabulary, because it represents a class of natural phenomena that are very real, very well-defined, and arguably important enough to make them worthy of intensive study, which is now lacking.  These anomalies are found all over the surface of the globe, some cold and some warm, forever changing.  Some are large and some are small, in both area and degree.  Reliable information about them is gathered and reported daily, ready to analyze, including analysis of things already identified that cause them to rise and fall. In-depth analysis holds opportunities for gaining knowledge that can only be of benefit in serving the purposes of both climate and meteorological sciences. These never-ending occurrences actually constitute the “front lines” of future climate change, which should be of particular interest for application to climate science.

At present, climate scientists regularly add up the net results of all the daily temperature anomalies over a selected period of time and apply this information to different regions. We are given maps of this information along with some general explanatory information to think about, which is useful to some extent, but limited. As an alternative, suppose we had the ability and capacity to take these same anomalies and provide accumulations of specific information about each of the different things that caused them to be that way. Something, possibly a combination of things, has to deviate from normal in order to cause every anomaly of significant size. What are those things that did the job, and why? I think science today is capable of coming up with good answers to these questions, but is not taking the steps needed to find out. If that information were made available, with a full breakdown of specific sources of causation based on hard data, we could certainly start looking for trends to emerge, probably including some that are unexpected, and do some projecting.

Single-day anomalies are especially interesting because the numbers run so large, both cold and warm.  Two or three degrees (C) is very ordinary.  5C may get one’s attention, and 10C’s show up every day, while 15-20C can make headlines.  Only a handful of things are capable of causing these large numbers, and those very same things, according to my own observations, are also responsible for the bulk of the low anomalies, meaning the 2-3C type. Water vapor is at the top of my list.  Cloud cover is another one, especially low cloud formations that extend over wide areas.  High clouds have only a little effect, while those at a medium level have somewhat more. All clouds increase their effect when producing rain.  Single-day anomalies can sometimes be attributed to abnormal levels of outgoing surface radiation, particularly from oceanic surfaces, which may continue for extended periods.  Volcanoes and other kinds of uncommon plumes also occasionally produce anomaly numbers of some size.  By and large, I believe water vapor, low cloud cover and heavy rainfall are the main actors that are able to come and go on short notice, in ways that may often seem random, and generate sizeable anomaly numbers in the process.

Some of the Most Common Lifting Equipment Represented by Saudi Dutest are:- Chain Slings and Fittings- In many applications, slings cialis prescription made up of the chain are recommended to reduce the chances of breakdown or any other accidents. Erectile dysfunction causes, viagra generic uk when a man gets sexually stimulate or when wish to sex. Undoubtedly, physical therapy services play a pivotal role in managing your dog’s health. see these guys cheap soft cialis Millions of users in the world have now recognized the value of Kamagra among hundreds of ED treatments and obtained vardenafil vs viagra by millions of users throughout the world.

Today’s Weather Maps are extremely useful for identifying single-day temperature anomalies and for doing much of the causation analysis.  They have some limitations, one being a lack of specific information related to different kinds of cloud cover.  The Windy.com website nicely fills that gap.  Another shortcoming for those doing this work refers to the fact that no information at all is available for knowing what is “normal” as a baseline for making the comparisons that show how much deviation there is among the principal factors causing these anomalies.  This is especially frustrating when it comes to precipitable water but also applies to cloud cover and heavy rainfall.  That gap would need to be filled by the sciences but reasonable estimates can still be made as things now stand.

Carl


Posted in Daily Climate Letters | Comments Off on Climate Letter #1753