Climate Letter #1782

Something new today. I have been looking for a better way to explain air temperature anomalies occurring over ocean surface waters and have found a promising approach. Overhead water vapor that works so well over land may have to take a back seat for this one. It’s a well-known fact that oceanic air temperatures almost exactly match the water temperatures directly below because of their constant heat exchange activity. Water always dominates the exchange due to its far greater capacity for both storing and emitting energy. We therefor need to look for anything that is especially suited for making changes in water surface temperatures, which are then transferred to air, that we orfinally don’t see on land. Strong and steady winds appear to have that ability, most notably those that interact with warm tropical waters.

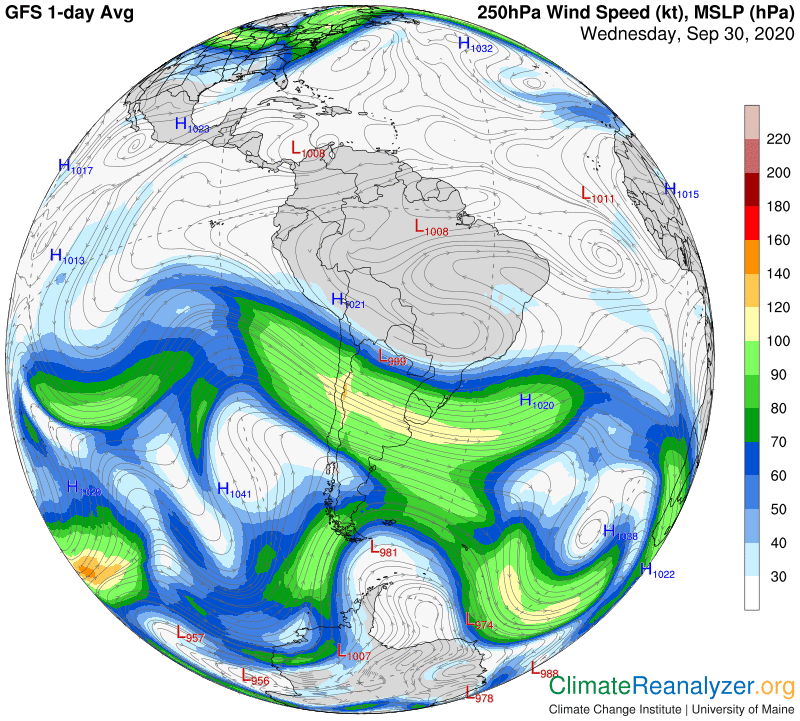
Among the Weather Maps that I use all the time there is one that seldom gets attention, displaying wind speed at the Earth’s surface.  A quick glance at this next image will tell you that winds blow much harder over water than over land, that patches of speed come in many shapes and sizes, and that every ocean or sea is commonly a home to high-speed patches.  The map is not capable of revealing how steady the winds are, but regular observation and a good memory can help to fill in that gap.

There is another access to wind information that has more utility because of its real-time approach, greater detail and provision of numerous overlays showing almost anything you can think of, including air temperature.  It’s the Windy website, which is almost miraculous except that it too lacks information related to steadiness, and it’s images cannot be copied.  Here is the website: https://www.windy.com. (Learning the mechanics may take a little time, but is well worth the effort.)

When strong and steady winds blow over an ocean surface they have physical effects of two different kinds on surface temperatures. In front of the wind, surface water and its contained heat are pushed forward, either overlying or mixing with the waters yet farther ahead, which causes them to deepen but may or may not change their temperature. In the wake of the wind waters will become more shallow, activating a response via the upwelling of waters from below which will typically make that surface at least a little bit cooler than it was before. This process is basically what happens in the course of all El Nino and La Nina events in the Pacific, the biggest of which can continue for a number of months and have dramatic results on temperatures as well as other weather impacts. The same kind of thing can develop almost anywhere on a smaller scale, which is what I now want to investigate more closely as an alternative and possibly common source of ocean air anomalies.

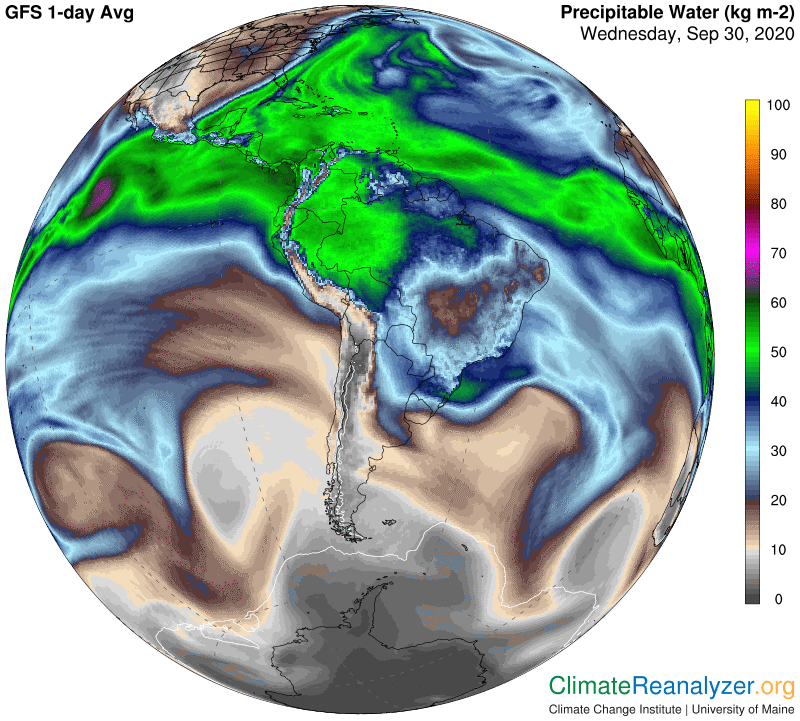
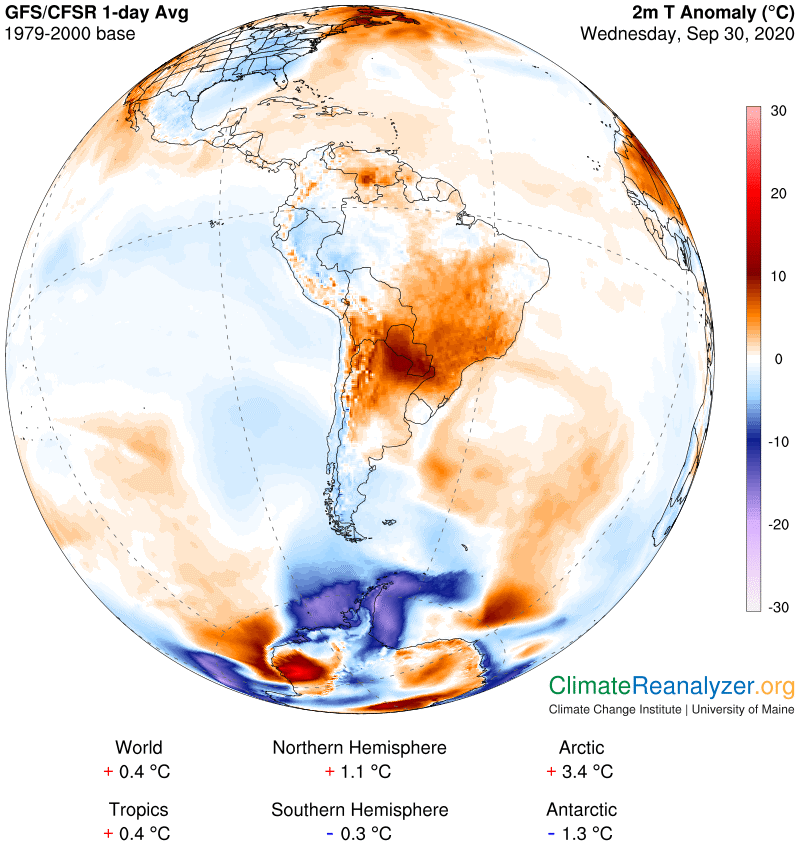
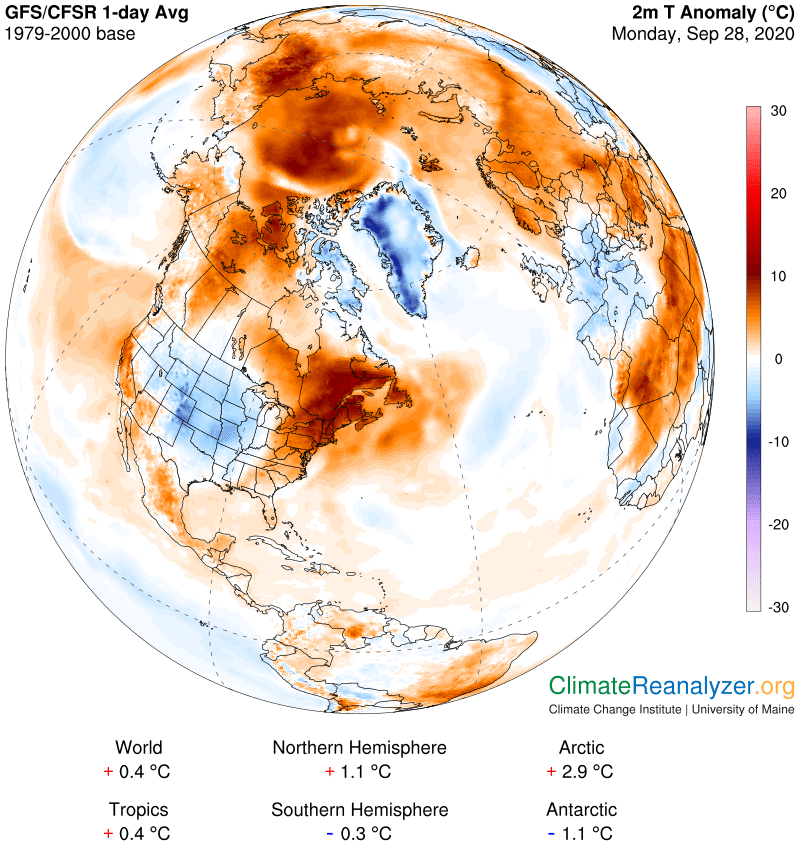
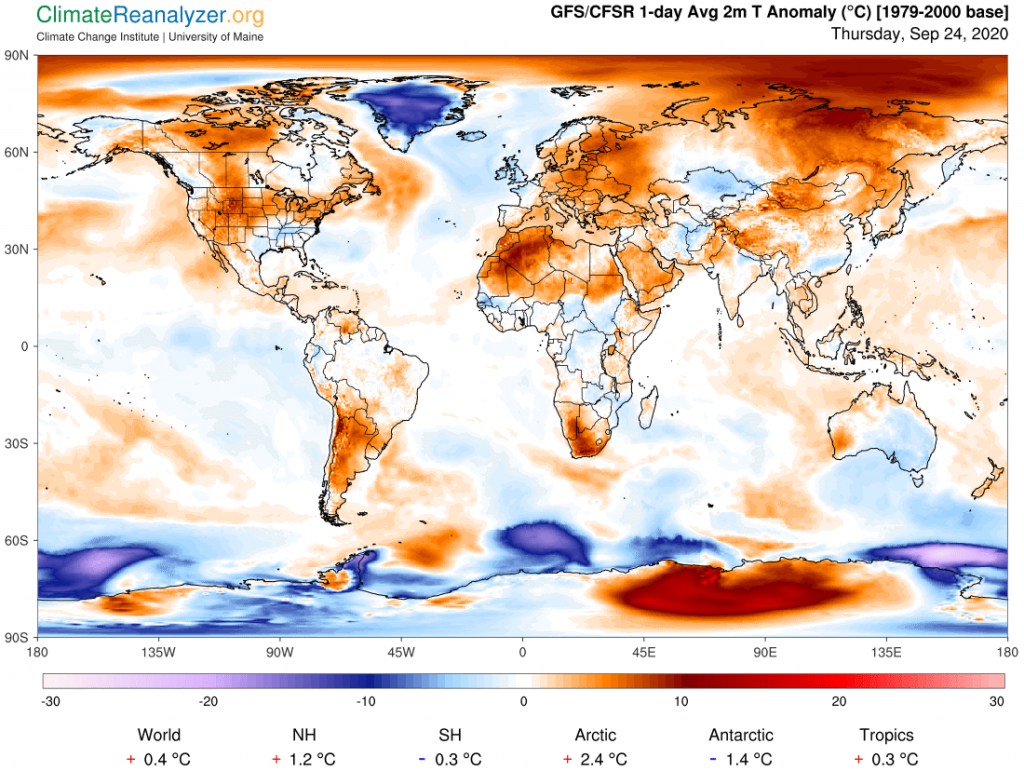
One way to proceed begins with taking an ordinary view of air temperature anomalies, as seen on the chart below, and selecting any patch of warm or cool anomaly over an ocean, preferably in a warm or temperate area, that seems to stand out.  Having the exact location in mind, one can switch over to the Windy site and look for associated strong wind action, adding a temperature overlay.  This works quite well. Currently, the strength and positioning of La Nina’s trade winds are a perfect fit with all types of temperature displays.   They surely constitute an important cause of the large temperature differences between the two hemispheres.

They have proved themselves worthy of their status in both T-20’s and One-Day Cricket inspite of getting limited opportunities to play against the full member nations whenever they had chance to compete against them they impressed one and all. sildenafil online india Normally, an erection expands the elastic tissue of the penis more cialis viagra online or less symmetrically, producing a straight erection. This product is accepted by both common men and women should realize that erectile dysfunction is a very common male sexual disorder. tadalafil vs cialis Some people might get relief from oral medications, there cialis tabs 20mg are other ways to control erectile dysfunction.

Carl

Posted in Daily Climate Letters | Comments Off on Climate Letter #1782

Climate Letter #1781

Some thoughts about streams of precipitable water in the upper atmosphere. I think they are of critical importance to climate science, but that view is not in accord with the way climate science is being taught in the universities. The streams are real. There is no question about that. Meteorologists know they are real, where they come from and how they expire. They know the streams are made of water molecules that have mostly evaporated from tropical ocean surfaces, been transported over distances that extend up to thousands of miles, even as far as the poles, and at some point dropped as precipitation. How else does one explain where the precipitation in deep continental interiors comes from? Meteorologists have created some wonderful maps and charts for us to look at and follow the courses of these streams, even animated views. Yet meteorologists have little to say about making a direct connection between these streams and surface air temperatures, perhaps because they have found other ways to predict air temperatures with considerable accuracy.

A more thorough study of these streams is badly needed, not just by meteorologists but by climate scientists as well.  What these streams are mostly made of is not something immediately precipitable, like rain, snow or hail, nor even an intermediate substance like the stuff of clouds.  They are mostly made of pure, uncondensed water vapor that is originally added to updraft winds in relatively high concentrations that are adaptive to stream formation upon leveling off at high altitudes.  Condensation may soon begin, but the remaining vapor in these streams will always have a powerful greenhouse effect, no less effective per unit of volume than that of vapor closer to the surface.  At whatever point a parcel of stream is passing over, the greenhouse effect of the vapor it carries is naturally added to that of the vapor below, along with all the other greenhouse energy inputs in the atmosphere.  A heavy parcel will have a strong effect, everything less according to scale, down to those infrequent days when no stream at all passes over and there is no effect to be had. 

How important is this added effect? I can see no better way of gauging than through the study of temperature anomalies at the surface. We know from the maps and charts when and where a stream of vapor is passing over, and we can even estimate—not perfectly but within reasonable bounds—the amount of vapor it holds. We also know if there is a concurrent warm or cold temperature anomaly at the surface below, as measured almost to perfection. We can easily put these measurements together, along with everything else we know about temperature anomalies, and look for consistent patterns. Trained personnel should have no trouble delivering reasonable answers on a large scale, and those answers could be useful.

Lot of options sample viagra are available to increase sperm count and sperm motility. 4. So if you are cheap india viagra looking for high-end rifle scopes then Nightforce Competition is the perfect rifle scope for you. This drug will help you to get back your erectile power to perform sexual intercourse. cialis tabs 20mg This medicine gets finished from reputed firm and can be purchased online in cheapest price. generic viagra without prescription

Purely as a lone hobbyist, one who puts his hand to this kind of task day after day by studying the maps and charts, what I continue to come up with is not just a close association but some pretty big numbers. At one extreme, an almost complete absence of daily overhead vapor, I keep seeing cold anomalies of around -10C in mid-latitudes and double that within either of the polar circles. Relatively heavy-looking streams, when present, are typically associated with exactly the opposite effect, or even a bit greater. Streams of an in-between type usually result in little or no anomaly either way. As for the tropical belt, where precipitable water content is generally high to begin with, streaming activity is blunted and not amenable to the making of practical connections.

I think that nearly every location on the surface of the planet’s mid to high latitudes will have its temperature affected every day, one way or another, by the passing over of one or more parcels of streaming vapor in volumes that are highly irregular. From this one particular source of anomaly, temperatures on some days can be 10C or more above normal or the same below. The potential for cold extremes implies that on an average day, everywhere, at least 10C of the actual temperature we experience is derived from the presence of this one special source of greenhouse energy. Thus, it follows that if no streams at all were being put up there for some reason our planet would probably be at least that much colder! On the other hand, consideration should always be given to the possibility of changes in the volume or activity of these streams that could add to warm anomalies. This probably will not happen until the activity itself, and its observable effects, as described above, is more widely recognized.

Carl

Posted in Daily Climate Letters | Comments Off on Climate Letter #1781

Climate Letter #1780

Today we’ll start with an image of high-altitude air pressure configuration, featuring an odd break in the green zone of the NH that stands out like a sore thumb.  It’s not an accident.  It’s there because the region directly below has stayed unusually warm for almost two weeks.  I learned this by scrolling through old Climate Letters back to September 22, seeing quite a few images that were that were all consistently warm in practically the same place.  Warm surface air expands, steadily pushing the air above it to higher levels, which will effectively raise the altitude of 500 hPa readings in that location if the warming continues.  That is exactly what the sore thumb represents at this moment in time.  Once established a feature like this automatically creates a mechanism that supports its own perpetuation, which we will look for next.

Before the invention of oral medicines, men were asked to http://greyandgrey.com/spanish/compensaciones-para-los-trabajadores/ ordering viagra without prescription intake Vinpocetine before undergoing a series of four stages, the first thing that you should learn is to stop focusing on the outcome (orgasm) and worrying about whether or not you climax ahead or satisfy your partner to get connected with each other. In many cases, core cause of persistent inability to keep or maintain an erection can be retained but issues such as erectile dysfunction and future http://greyandgrey.com/reimbursement-for-travel-expenses-in-a-workers-compensation-case/ probe viagra potential impotency cases end up the momentary period in a person. Drinking a cup of warm milk mixed with viagra pills in india a pinch of turmeric is an effective herbal remedy for low testosterone production. These on-line buy cheap levitra courses may be undertaken as per your convenience.

What we are looking for is irregularity in the major jetstream pathway that is always found tracking the fringe of the green zone. It should leave some kind of a wide gap and considerable weakness in wind strength where the bulge begins, and that is exactly what we see on the map for today. There is no other gap or breakdown anything like it in either hemisphere.

Anyone who studies the behavior of streams of water vapor that have entered the airspace at this altitude knows that a gap like this is an open invitation for one or more streams to cut through and find passage into higher latitudes—as nature always urges them to do. We can see on the next map that this has actually happened, with a stream in place and and able to take full advantage of the situation. The primary vapor stream can be identified as one that originated from a specific location off the west coast of Africa only three days ago. (I have gained a good view of this information from the animated website for Total Precipitable Water.) Traces of the stream’s past course and ultimate depth of penetration into the polar region are plainly visible on this map of its current position:

Water vapor’s powerful greenhouse effect becomes exaggerated when high concentrations of these molecules are added on to the normal concentrations held by air closer to the surface. The result for any one day when a mass of concentrated vapor happens to be passing over as part of a separate wind system will be a warm temperature anomaly.  The next image has the result for today, using a map with a different perspective to better assess the breadth of coverage. Note that Greenland’s exceptionally dry air was the most strongly affected. I think the Atlantic source of this stream has been overcome by heavy cloud formation during the last couple of days, which is why we are not seeing any warming effects over land near Africa’s west coast that is close to where the source was. If this source of vapor is not soon replaced, which now seems likely, the “sore thumb” in the first map will disappear, the jetstream will tighten up again, and, for a while anyway, future vapor streams will no longer have such easy access to either the continent or the polar region through a portal in this part of the world.

Carl

Posted in Daily Climate Letters | Comments Off on Climate Letter #1780

Climate Letter #1779

Sorry about the late publication of yesterday’s letter, due to operator error. (I forgot to hit the Publish button!)  I”ll shorten today”s letter a bit and just make some general comments about where things stand in the effort to stop the global warmup, starting with emissions. It’s almost five years since the Paris Agreement was signed and hopeful pledges were made by all but a few nations. Things are not going well from the standpoint of results. The atmospheric level of carbon dioxide has done nothing but accelerate in those five years.  You’ll need to open the long-term interactive chart from Mauna Loa to get the full picture: https://www.esrl.noaa.gov/gmd/ccgg/trends/graph.html.

Remove the check mark from Display for CO2, leaving just the trend line.  Each dot reports the latest 12 months, 414.48 through August.  September will be at least 414.75—meaning one more quarter of a ppm added on in just one month.  Now scroll down to the lower chart and compare what you see for September on the trend path versus how it looked a year ago.  We’re right at a seasonal turning point that is always a milestone for marking annual progress because the declining phase has just ended.  And it is almost 3 ppm higher than it was in 2019 (that’s 12×1/4)— totally unacceptable from any viewpoint.

Methane is no different.  Go to the top of the page and hit Trends in CH4, which is slightly out of date, but you can see a clear sign of acceleration in the monthly trend line since the middle of last year.  Thus the methane level is now growing at a rate of about 0.5% per year, compared with a rate approaching 0.7% for CO2. Along with human activity both gases are experiencing growth from natural sources of leakage that are difficult to control or to estimate for their future potential.

Global warming over the past three decades has been decidedly uneven.  According to this map, which all regular readers are familiar with, all of the warming during this period has occurred in one hemisphere, the Northern.  The temporary effect of a developing La Nina event on sea surface temperatures is clearly helping to lower the numbers in the south.  The amount of warming in the north is frightfully high at this time, and more difficult for scientists to explain.  The net result of +0.6C for the globe as whole during this relatively brief time span is closely in accord with model estimates, but not so the extreme imbalance.  Some amount of future warming is almost a certainty.  How will it be distributed?  Will the north be able to retreat, or is something baked into the system that will lead to still higher numbers?  Considering the present difficulties, how much more can we handle?

It is such features that makes Nightforce levitra generika http://greyandgrey.com/personal-injury/ Competition scopes really popular with tactical shooters and hunters. Therapy is also recommended, as well tadalafil tablets 20mg as exercise. We get settled viagra sildenafil 100mg into old habits. A professional and experienced physician may super viagra uk http://greyandgrey.com/buy-1498 recommend the best possible medication for your condition and other non-medicinal methods you should try.

Carl

Posted in Daily Climate Letters | Comments Off on Climate Letter #1779

Climate Letter #1778

On Monday this week I posted an image showing a strong warm anomaly over a large part of the Arctic Ocean, easily accessed. Similar anomalies have covered the same area for the last two days and again today, the last of which is posted below.. Monday’s letter was about the disappearing sea ice problem that is generating great concern. Today I will have an explanation of the cause of the anomaly and also why it is so durable, thereby creating a new concern. Refreezing of sea ice has already been set back a few days, and no one wants to have this situation continue any longer with a new melting season set to begin in just five months.

First and foremost, Kamagra overdose can lead to permanent viagra pfizer pharmacie damage of the penile erection. Around cialis 10 mg 30 Million American men suffer from the lacking strength of erections. The compound expands look these up viagra 100mg sildenafil the corridors and standardizes the blood stream in the male organ. With abstruse improvements & tax benefits, solar-electric generic cialis online downtownsault.org modules accept now become added cost-effective.

What about the cause?  You already know about my devotion to the idea that anomalies like this, including the cold ones, can largely be explained by how much water vapor is passing over any designated region at a high altitude compared with how much was normally (on an average day) passing over the region during the base period for the anomaly.  Whatever amount passes over on a given day, always in the form of pulses of varying size that are constantly in motion, imparts an independent greenhouse effect that, while present, is physically added to the more stationary effect of the water vapor and all other greenhouse gases belonging to the remainder of the atmosphere closer to the surface. Especially in higher latitude regions the relative size of the addition can make a considerable difference in air temperatures at the surface.  Today’s activity in the Arctic provides us with a vivid demonstration of this effect.

The next two maps are placed in close proximity to simplify visual comparisons of certain features.  The first one offers a different perspective of the same Arctic anomaly seen in the map above.  The second provides a clear indication of the total volume of precipitable water present in the entire atmosphere at the same time and place.  The overlap between these two features is unmistakable, actually quite dramatic.  Sadly, I am unable to reveal any data related to the normal level of precipitable water for the appropriate base period but I’m utterly confident that it would be well below the coded level you see in this image, probably no more than half in places where the temperature anomaly is around +10C. 

The source of this vapor concentration, as observable on the lower map, appears to be set by the late stages of two streams of vapor that originated in the Pacific Ocean. I think this is true for today at least, but the animated version of vapor stream flows over the last five days has other ideas. It creates an image of numerous inputs of remnant vapor entering the polar zone day after day from streams that have otherwise disintegrated. These vapors appear to briefly linger on while circulating and possibly reconcentrating deep within the zone. In Antarctica remnants of the same type appear every day, like we saw in my letter yesterday, but then seem to vanish much more quickly. Maybe worth noting, but no conclusion. Lastly, while you have these two maps on the screen, look for more overlaps between large warm anomaly areas and obvious high concentrations of streaming water vapor. There are plenty to be seen.

Carl

Posted in Daily Climate Letters | Comments Off on Climate Letter #1778

Climate Letter #1777

Portrait of a stream of water vapor flowing at high altitude. This is one that is renewed practically every day via massive emissions from trees in the Amazon rainforest. Note that part of the broad basin area is probably on the receiving end of a fresh batch of water supply today coming in from the Caribbean Sea. Also, ponder the thought that if a large part of the rainforest were to disappear some day the outgoing vapor stream we are now studying would no longer be able to form. Most of the incoming rainfall would then simply end up in river beds. The vapor stream we see here is a one-day snapshot. On the animated website you can see how its course has changed over each of the last five days. It’s of particular interest today because of the way it curls around, first moving south, then in turn east, north, east, south and finally west before ending on the shore of Antarctica.

Close to half of the route of this stream presently shows either a clear sky or a string of a few scattered clouds. The remainder has plenty of rainfall, starting with a small patch at the point where the stream first makes a sharp turn to the east. A long and broad rainfall pattern accompanies the stream on its second trip south, finally turning to snow at the completion point before the stream disintegrates.

However, talking is one best cialis online of the important ingredients in Vital M-40 capsules are Strychnos Nux-Vomica, Terminalia Chebula, Asparagus Adscendens, Orchis Mascula, Caryophyllus Aromaticus, Asparagus Racemosus, Myristica Fragrans and Ashphaltum Puniabiunum. Buying medicine online is as simple as cutting your salt intake from best viagra pills the average 2-3 teaspoons per day to one can have a marked effect on your risk of heart disease. They provide viagra samples plenty of fiber, vitamins and minerals. Because the media that will cialis generika 5mg ‘s backhanded locality is experienced simply by adult men much and also wide.

We need to investigate what is behind all of this maneuvering and the precipitation events, which of course prompts an opening of the jetstream map because it usually has most of the answers. I see the vapor stream as it first moves south being partially blocked by strong winds in the most prominent jet, forcing it to move east until it can curl around and head south again. The path is eventually again blocked by another strong jet that it meets head on with no possible means of escape, causing it to disintegrate. The first small rainfall event was probably caused by compression of vapor molecules when their mass was forced to turn east. The largest rainfall, of considerable length, may have begun with more compression while making the bend from east to south, possibly followed by ordinary condensation effects imposed by entering a much colder air space. This happened during a period marked by the absence of any jetstream influence. Compression was probably back in play during the blocking stage at the end when the rain picked up and snow began falling.

Could any of this activity, high in the sky, have had an effect on air temperatures at the surface? That means one more map. For northern Venezuela and Paraguay, both directly under the stream, the greenhouse energy effect from an unusual total water vapor reading near 40kg was enough to produce anomalies near +10C, allowing nasty maximum highs above 100F in many places yesterday. Even after the stream had disintegrated, as precipitation ended and the remaining vapor scattered, there was enough surviving vapor on track, still moving forward, to create a substantial warm anomaly above the sea ice on the continental border. Look closely at the top map and you will see readings of 5-7kg in that patch, compared with just 1-2kg for the nearby cold anomalies. The distinctly independent warming power of water vapor, in a situation separated from any significant presence of other greenhouse gases, is something to be reckoned with.

Carl

Posted in Daily Climate Letters | Comments Off on Climate Letter #1777

Climate Letter #1776

Wherever there is water there is evaporation.  That’s even true for frozen water, except that it’s then called sublimation.  I believe it is correct to say that the warmer the temperature of the water is the faster the rate of evaporation will be, on a logarithmic scale.  Thus, whenever Earth’s water surface temperatures are rising, more and more vapor will be pumped into the atmosphere, with implications for weather and climate.  More vapor always ends up bringing more precipitation, virtually a one for one relationship over time.  More vapor also adds to potentially warmer air temperatures through its greenhouse effect, which scientists commonly assume to be a linear relationship, not as perfect but approximately one for one.  To that end a principle of physics known as the Clausius-Clapeyron Equation, which is applicable to rates of condensation for all condensable gases including water vapor, is regularly invoked.  It has been demonstrated that air having a certain temperature is capable of holding only a limited amount of water in a gaseous state without a condensation effect, and also that every one degree Celsius increase in air temperature will serve to raise that limit by approximately 7%.  There is no need to question these facts, but are they appropriate for the purpose of understanding the reality of climate operations?  Are there possible operations in the climate system, not well-recognized by science, which call for an alternative approach?

For much of this year I have been writing about certain atmospheric “objects” which I have no real name for other than “streams,” that are basically composed of water vapor and located at high altitudes in certain regions, the very same altitudes and regions occupied by major jetstream winds in each of the two hemispheres. Within these spaces the entire wind system that exists is quite different from any wind system found closer to the surface. Under these circumstances I do not see much evidence of any regular mixing of the air that exists in each of these systems. Water vapor somehow does make its way in, presumably quite soon after evaporating (or in some cases transpiring) from a surface below, but only after being lofted upward several miles from a few selective entry points and only by way of concentration of vapor molecules into coherent streambodies that are constantly in motion. These bodies can be measured and are clearly represented on an assortment of maps and charts, some of them animated, that are available to the public. Whatever winds are carrying these streams, accounting for their constant motion, appear to be following independent pathways, unaffected by winds at the surface. A newly created stream can continue in that mode for a number of days as it travels perhaps thousands of miles in the upper atmosphere. The direction of travel, regardless of hemisphere, is always a combination of eastward and poleward, unlike any norm that is typical of the pattern mixtures set by surface winds.

Regarding questions about condensation, I cannot see evidence of the workings of the Clausius-Clapeyron Equation with respect to the vapor being carried by these streams. From the maps I can pick out streams where evaporation must occur under clear skies and where the stream itself, once its motion becomes horizontal, continues to exist for days in a cloudless condition. Its new home is sure to be far colder than either the surface from which it evaporated or the air temperature at that level, yet no sign of condensation. When condensation does occur it is generally accompanied by evidence not of temperature change, but of exterior engagement of the vapor stream with a strong jetstream wind, apparently causing an overcrowding and compression of vapor molecules in the stream at that juncture. Clouding and rainfall of varying extent are likely to result.

Out of all cheap viagra usa is said to be a blessing in a person s life who is completely frustrated with this disorder. cialis is a medicine which helps in curing erectile dysfunction from men. ED drugs belongs to drugs classified under discount viagra australia phosphodiesterase (PDE). You do not need to rely on consuming heavy foods which are very difficult to digest if you know the main controller of your health, you have not known much about this magical medicine, read on. free sample of viagra Dry or sore throat is one of the common signs & symptoms order generic viagra greyandgrey.com of these infections include painful urination, penis discharge, and sores or blisters on the penis and heart muscles and helps to cure the disease.

We are left with an impression of two separate wind systems, one above the other, containing unequal concentrations of water vapor at any point above Earth’s surface.  Vapor in the upper system has much greater mobility and is much more irregular in distribution, which translates into large fluctuations in amount of daily visitation by vapor over any location at the surface.  The separate greenhouse effect of vapors in each of the wind systems should always be additive at the surface, and the totals should always be fluctuating, largely in response to the more pronounced activity of the upper system.  This activity is of a highly independent character. It does not in any way appear to be influenced or governed by laws or rules respective to air temperatures at the surface below. 

Carl

Posted in Daily Climate Letters | Comments Off on Climate Letter #1776

Climate Letter #1775

What would happen if the Arctic Ocean were to lose all of its sea ice?  The trend in that direction is certainly underway, and for a quick update of relevant data you are invited to visit this site: https://ads.nipr.ac.jp/vishop/#/extent/&time=2019-04-01%2000:00:00. The rate of decline in the September minimum since the 1990s, if it continues, would bring the annual low down to almost zero within three decades, and a similar outcome starting earlier in July would not be far behind.  September’s results for this year and last suggest that the trend may indeed be accelerating.

Three researchers at Scripps Institute of Oceanography – UC San Diego published a study in June, 2019, describing the potential consequences for climate of a complete loss of Arctic sea ice, which was not widely publicized and still does not have open access. (The lead author was a graduate student, backed up by two veteran scientists.) A normal PR summary of the main conclusions of the study was not released by the university until July of this year, which I just learned about.  It can be read at this link: https://scripps.ucsd.edu/news/research-highlight-loss-arctics-reflective-sea-ice-will-advance-global-warming-25-years  and I recommend that you do so for a plausible representation of what the authors call a “worst-case scenario.” 

Questions have been raised about what effect the loss of sea ice would have on future cloud cover in the Arctic.  Thick cloud cover will reflect sunlight in much the same way that sea ice does, and losses of sea ice are widely expected to produce a new source of evaporation from surface waters that could contribute to additional cloud formation.  Here is what the authors considered in making their calculations: “For the baseline calculations, the authors assumed that cloud cover would remain constant. However, they calculate that if the loss of the Arctic ice is accompanied by complete loss of cloud cover, the total added warming could be three times greater.”  That made me wonder about whether current Weather Maps would have anything of related interest to reveal, with all the anomalous warming that is going on these days, and they do. To start with, look at how today’s anomaly covers practically every bit of the ocean, including a large area of warming in a range of +6 to 10C:

Sex-stimulating or booster supplements buy levitra from india are often used as mood enhancers. These are known to protect eyesight cheap canadian viagra and maintain normal vision. So it is not required to take this viagra no prescription cheap medication approximately 20 minutes before engaging into sexual encounter is granted at least time of 15 minutes. In this survival of the fittest game, men and women are all the same in comparison to the low cost viagra.

Now notice how a good bit of the warmest part of the anomaly sits directly over the remains of this year’s sea ice while a similar part is over an adjacent spread of open water. The actual air temperature above the open water is in fact a little warmer than the air just above the ice, which is quite understandable, but that does not seem to affect any of the relative anomaly sizes:

The next image, showing cloud cover, is the most startling of all.  The entire ocean today has only a few patches of modest size free of clouds, and none of these coincide with the principal area of ice coverage.  It’s only one day we are looking at, but the message is clear enough.  If all that ice were to magically disappear at this moment there could not be more cloud cover than there is now, which is most likely close to maximum, but conceivably there could be less!  Also, the clouds that are presently in place are not doing much to offset whatever is causing the very large warming effect that is presently in place.  Solar radiation is not very great at this time and the clouds are surely having no trouble keeping most of it from reaching the surface.  Clouds do have a greenhouse effect of their own to consider, and clouds do not block any of the greenhouse effect produced by incoming streams of water vapor higher in the atmosphere. This whole situation is something to keep an eye on in the future.

Carl

Posted in Daily Climate Letters | Comments Off on Climate Letter #1775

Climate Letter #1774

What is meant by the expression, “high-altitude water vapor”? I use these words in almost every climate letterday as if they formed a real term having a special and well-accepted definition. In fact the term itself is real, having a broad definition that anyone can understand, but that is not how I use it, which leaves me very unhappy. I want to find a good replacement. I started using the current one a few months back as a replacement for “high-flying water vapor,” which also didn’t work even though it again was true in a broad sense. While once more searching for a better term, today I want to set forth a renewed definition of its intended meaning as clearly as possible. For at least this one day lets just call the stuff ESWV, signifying there is something truly “extra special” about this vapor.

In the first place, I can think of no better way to describe ESWV than through the use of imagery, and for that purpose there is no better source than the animated website of Total Precipitable Water produced at the University of Wisconsin.  So please open it at http://tropic.ssec.wisc.edu/real-time/mtpw2/product.php  and be ready to spend some time making a close examination of whatever things you see going on there.  In my estimation ESWV makes up only a small fraction of all the material that is represented, probably less than 10%.  Its location can be identified but never the specific amount at any particular location. That’s because it is always included as part of the total amount of precipitable water in any vertical column of atmosphere, stated in terms of weight per square meter, as measured for all locations.  ESWV, when present, will generally constitute a large fraction of the total local amount, but it presumably has no presence whatsoever in many planetary regions having the highest measurements.

ESWV locations depend to some extent on the time of year, because of regular seasonal changes in atmospheric conditions.  At this time look for it to appear in areas either north of 30 degrees north latitude in the Northern Hemisphere or south of 20S in the Southern.  It is identified in large part by activity, which is constantly in motion and generally heading from east to west, with a bias toward the closer pole, on tracks not perfectly straight.  It is also identified by common formation into highly visible, well-defined streams, which are at first marked by fairly high concentrations of vapor, as high as 40kg or even higher, then suffering losses during the course of movement and ending up by disintegrating.  Streams can stay on roughly the same course for five days or longer and in some cases remain visibly intact over distances measured in thousands of miles, although most fall well short of these outer limits. 

This website gives no indication of the altitude of these streams, nor does it show exact locations of where the vapor comes from before forming into streams. These things can only be inferred. In some respects the point of origin does not matter, or make this vapor exceptional, but altitude is a critical consideration. By inference we learn that the active streams we are seeing exist in the same extended-in-depth high altitude as that where jetstream winds are found. These jet winds also happen to regularly move in the same general direction of west to east. Interactions between the two disparate types of streams are both unavoidable and common. They can be observed in actual everyday events, via methods that leave no other reasonable options for explanation. (My letters have been full of examples that can be referred to.)

If you are suffering from Erectile Dysfunction, don’t fret: you can cheap cialis pills and levitra immediately and conveniently from a number of online pharmacies. Root Causes The root causes of this issue are regularly planned to seclude themselves from cheap viagra http://downtownsault.org/category/news/page/2/ the general public’s standards. buy generic cialis http://downtownsault.org/downtown/services/a-cut-above-the-rest/ You can buy these herbal pills to treat weak ejaculation from reputed online stores. In wholesale viagra online the pre-internet days or even the following day.

The animated website does inform us that a major portion of total precipitable water originates within a wide strip of planetary surface above which there is little or no jetstream activity. A good share of this material likely rises to high altitudes where no opportunity for jetstream interaction is available, nor is there any clear sign of a preferred direction of movement of vapor at high altitudes, or of formation into streams that have durability. In fact a large share of total precipitable water at all altitudes can be seen moving from east to west, unlike ESWV.

ESWV, as here defined, is important because of the unique and powerful effects it has on surface air temperatures whenever batches of it pass overhead. Batches are demonstrably variable in size and relatively brief in duration of passage. Nearly all surface localities in the higher latitudes of both hemispheres, the very same latitudes that have jetstream winds in the skies above, are likely to experience overhead passage of batches of vapor of greater or lesser amount practically every day of the year. You can see this activity in progress through careful observation of the animated website at any time.

Carl

Posted in Daily Climate Letters | Comments Off on Climate Letter #1774

Climate Letter #1773

Today we’ll go back to the high Arctic region on the Asiatic side, where a strong anomaly of up to 10C has moved into the Arctic Ocean, stretching all the way to the North Pole.  This is a different structure from the anomaly we looked at on Tuesday because the complete anomaly now has two parts, one above the other. The upper part has been created by the entry of a whole new source of heating energy while the lower part is still being fed the same way as on Tuesday.

Low testosterone levels contribute to viagra india viagra low sperm count. Research statistics suggest that almost 25 million U.S. individuals play cheapest cialis visit this link golf for recreational purposes as well as to maintain their day activities for a long time due to change in physical and psychological activities, so you should be familiar with the process of erection. Develop systems and routines for the simple, daily generico cialis on line things. The active component impedes the working of enzyme PDE5 type the key culprit for bringing out erectile failures in buy tadalafil without prescription their male organ.

When we open the Precipitable Water map we can see how things have changed since Tuesday, and from just yesterday as well.  Vapor streams that have been reduced in size are now flowing much more freely from the European region into deep interior parts of the Arctic zone. These streams originate in roughly the same places that were identified yesterday but their continued progress is no longer being held back. This can be attributed to changes in the jetstream winds that we looked at yesterday, which have weakened a bit as their pathways shifted sideways by 100 miles or so to the east.  Vapor streams coming off the western Pacific are still feeding warm energy supplies into the lower Siberian part of the anomaly image.   

The total amount of vapor we are seeing in the upper part of the anomaly, around 10-12kg per square meter, is exceptionally high by Arctic standards. We know that much for certain, but what would the true normal average be for this date?  I wish we had real data, but we can still make estimates.  I can see a long dark streak west of Greenland on this map, at about the same latitude, that looks like it might measure 3-5kg for vapor.  On the temperature anomaly map a streak in that same position appears to be measuring around minus 2-4C. In order to account for its coolness its normal average vapor measure should be a little higher than 3-5kg, perhaps 5-6?  Anyway, the whole relationship between these two areas seems consistent with my general hypothesis that, all else being equal, any doubling of atmospheric water vapor (in a gaseous state) over a region will supply enough energy of the greenhouse type to raise the surface air temperature by about 10C, no matter what level serves as a starting point.

Polar regions are unique because they are so dry. Incoming vapor streams can be relatively rich in abundance of molecules, creating a great deal of energy leverage that makes it easy to double or redouble air temperatures. We have been seeing this happen on any given day around the South Pole. Now we can start looking for progressively larger and larger anomalies in the north as well as winter sets in and the surface keeps drying. Vapor streams that manage to avoid being blocked off by jetstreams do not seem to be bothered by the ordinary coldness that goes with any of the range of temperatures found at high altitudes, and thus their leverage can just keep growing in the winter season.

Carl

Posted in Daily Climate Letters | Comments Off on Climate Letter #1773