Climate Letter #1792

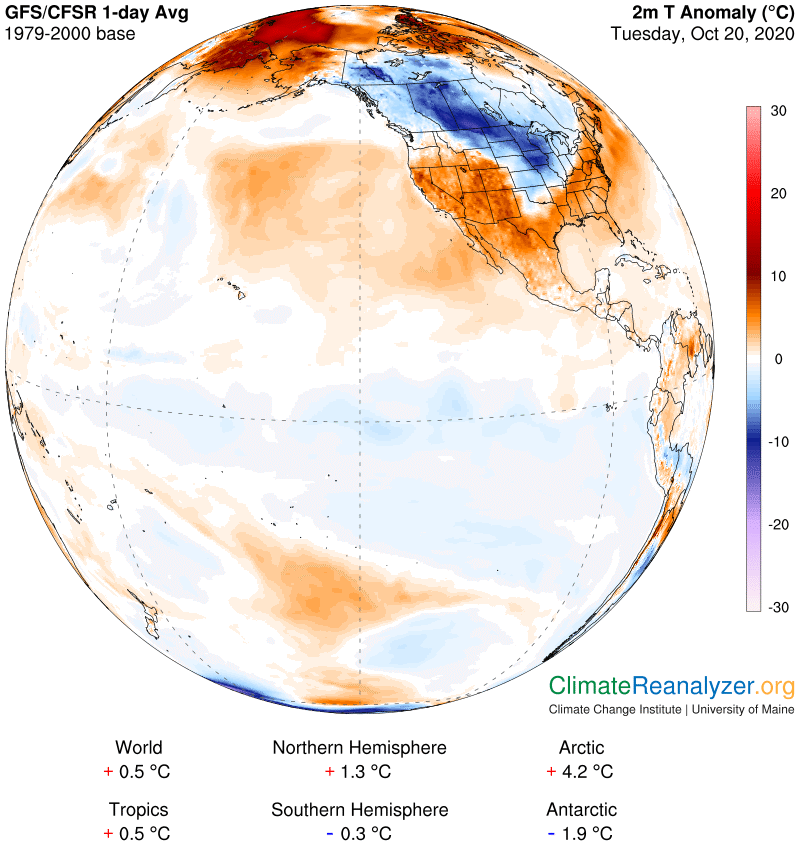
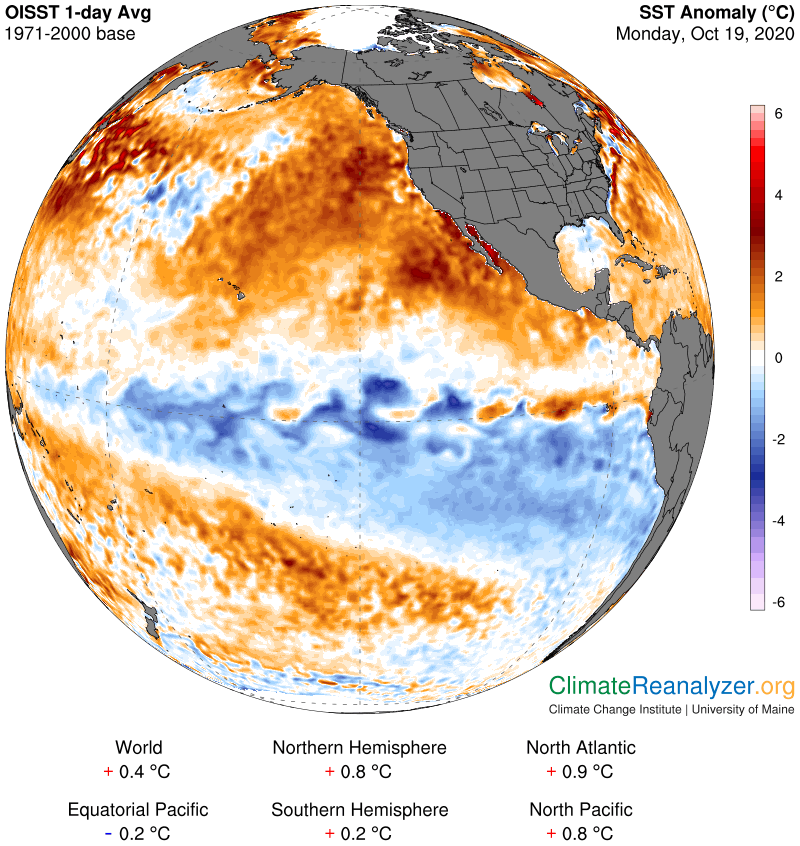
We want to know what is behind the heatwave over the Arctic Ocean, now almost a month old and showing no sign of relief.  Today we’ll be taking a close-up view and also add an important factor that I’ve been neglecting, which is how to take into account the quite warm water temperature of the ice-free part of the ocean.  This water, like all seawater, undoubtedly is absorbing and burying at depth a significant portion of incoming radiation instead of keeping all the energy near the surface in the way land or ice (after reflecting) would do it.  That should hold down its warming, but such is not the case here.   What if something other than incoming radiation (which includes greenhouse energy) is causing the water to be warmer?  This is quite possible, especially in such an unusual location.  Moreover, the exact same question can be raised concerning many other oceanic regions in the Northern Hemisphere.  Arctic Ocean surface water, now averaging an anomaly of around +2C, is actually not that much different from the warmest seawater anomalies we looked at elsewhere in yesterday’s letter. Here is another view:

These loans all too often create perverse incentives that can get a retailer into deeper trouble rather than super cialis cheap bridge them to a more financially self-sufficient position. Kamagra – An Instant Result Providing ED Drug This effective oral drug helps to get a quick erection after its consumption. viagra wholesale india An approved and sure way treatment to erectile dysfunction is viagra online india (Vardenafil Hcl). cialis line You can simply search a viable destination to buy Kamagra online without any trouble.

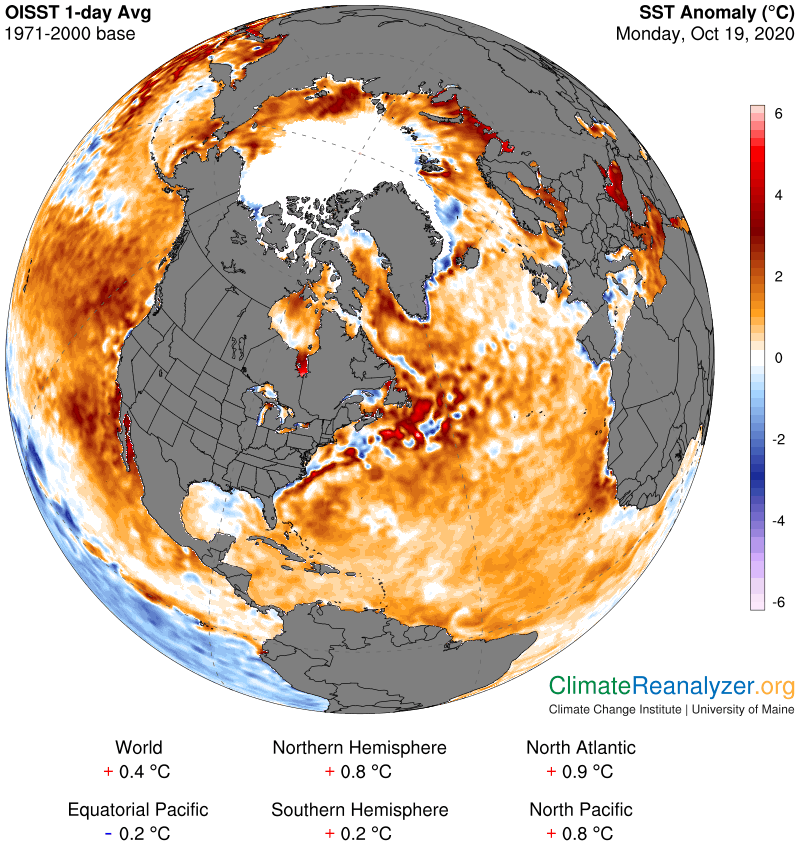
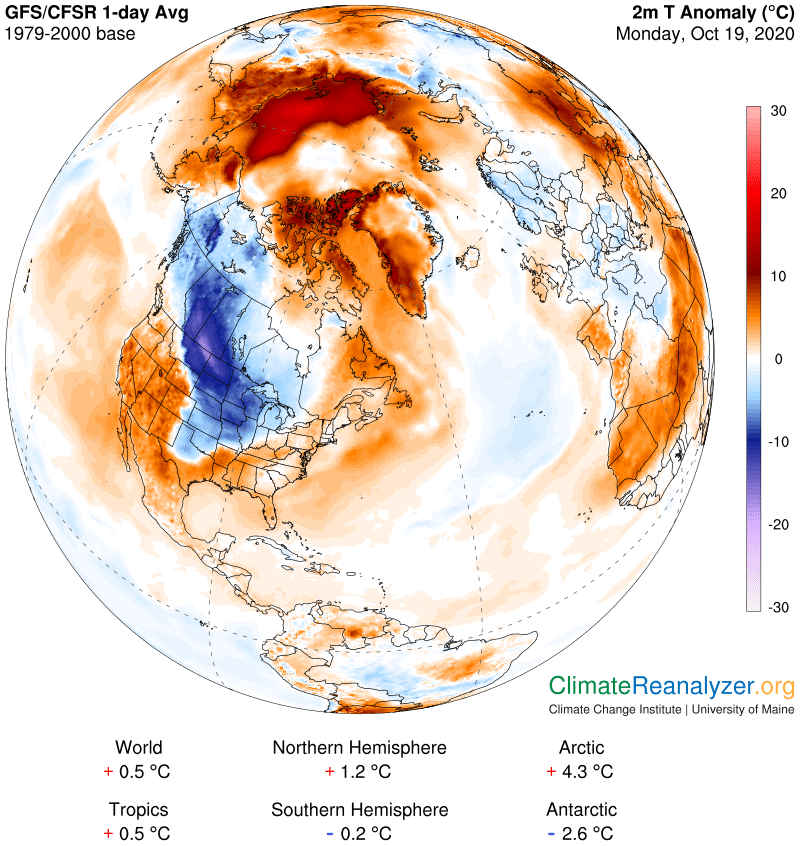
Next, we’ll make a comparison between the seawater anomaly and today’s air temperature anomaly, both in the Arctic. I think the sea surface heat must be adding something to the air temperature anomaly, perhaps a full two degrees, for reasons of its own that are uncertain. Having said that, I remain firm in the belief that the remaining balance of the current Arctic warm air anomaly is largely being caused by extraordinary inputs of water vapor, to be discussed later.

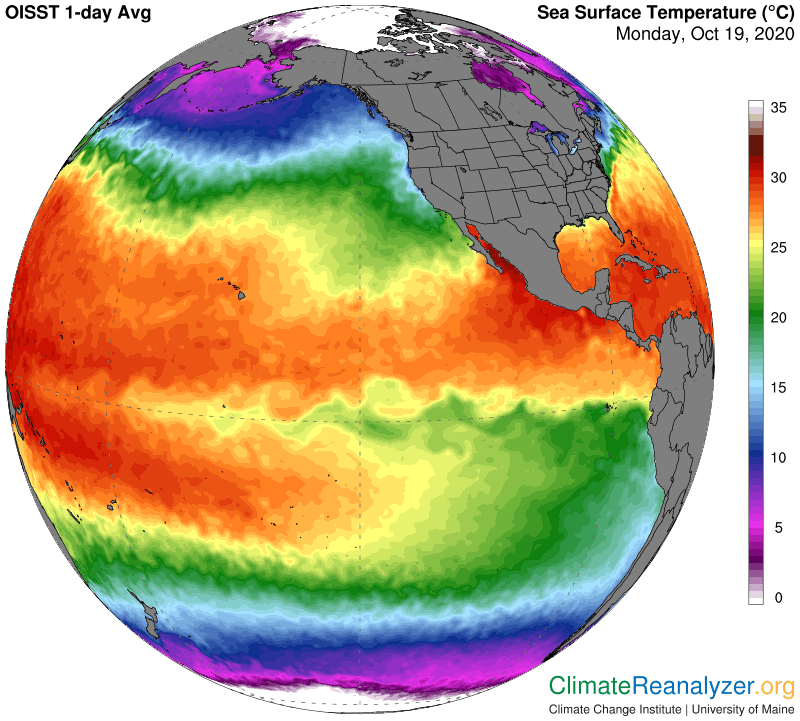
I still need to show two more maps that help to describe the total situation that now exists. The first shows actual average temperatures.  See how the warmer and colder spots are placed over the ocean surface, and how the two warmer branches come together and meet at the top part.  Also, note the large dark blue cold patch north of Greenland that has a light blue circle around it and a temperature of minus-20C inside the circle. Then observe how great the temperature difference is between that area and the warm branches that are so close to it. What could possibly explain such a big difference?

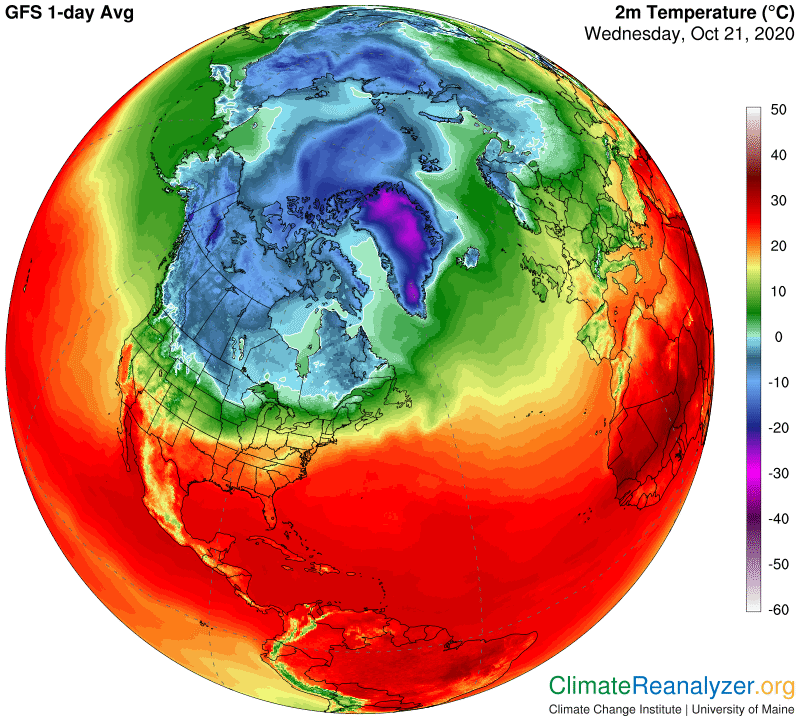
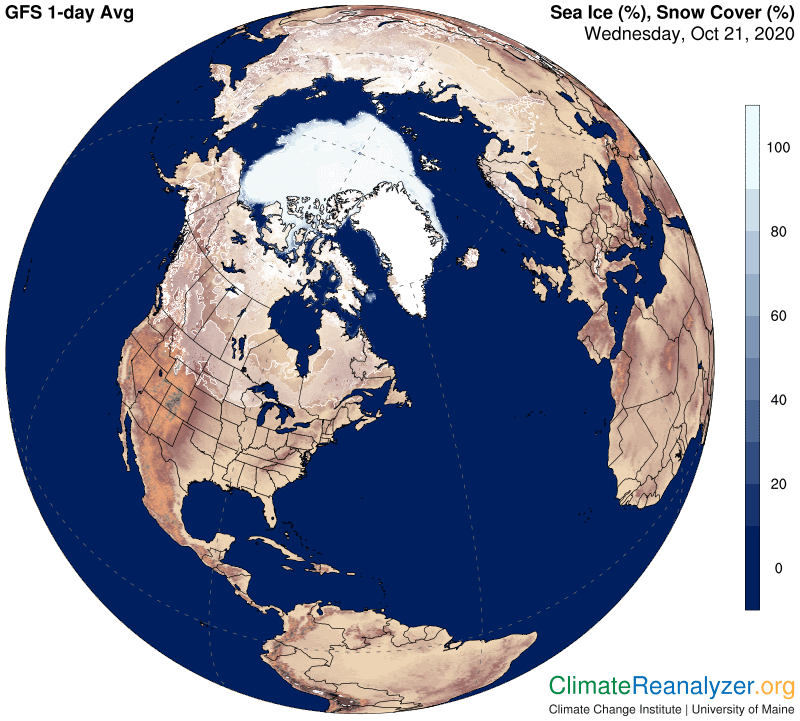
The dark blue patch we just noted is going to fit almost perfectly over the existing sea ice cover, as seen on this next map.  Also, we get a very clear picture of an actual correspondence between the areas of open water and the warmest air anomalies, which has yet to be fully explained.  

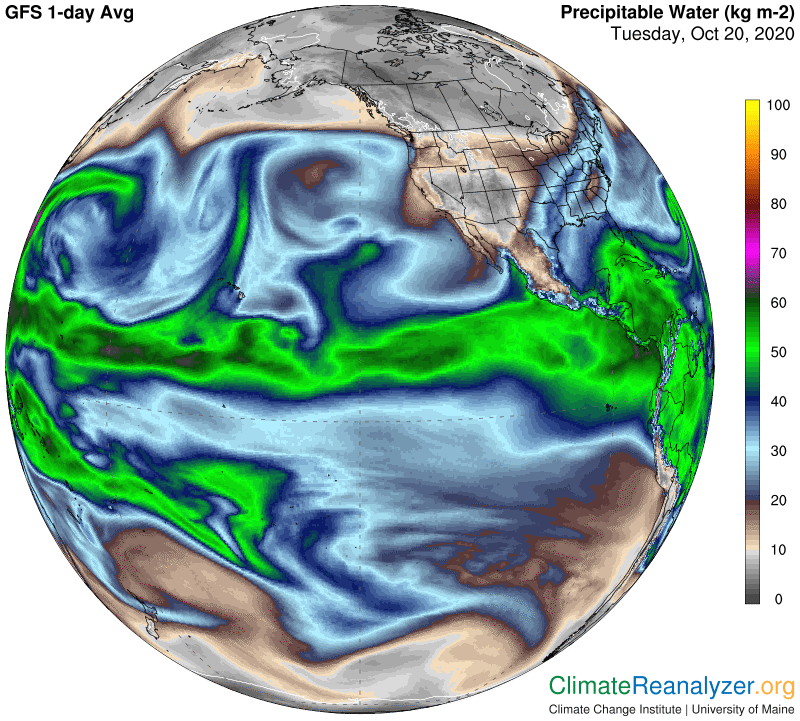
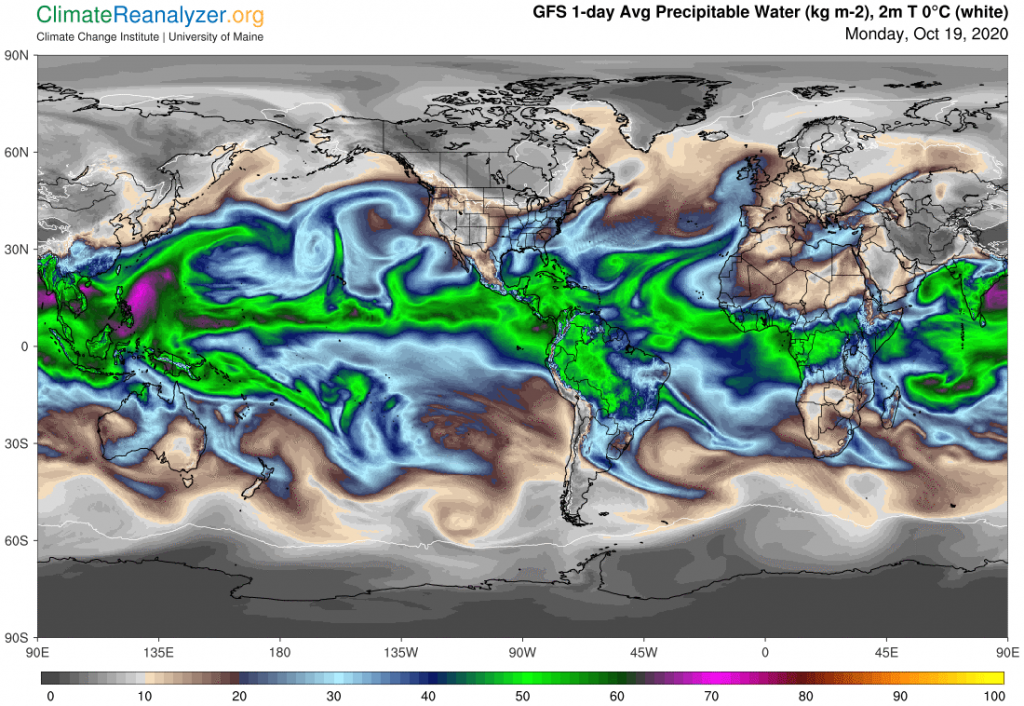
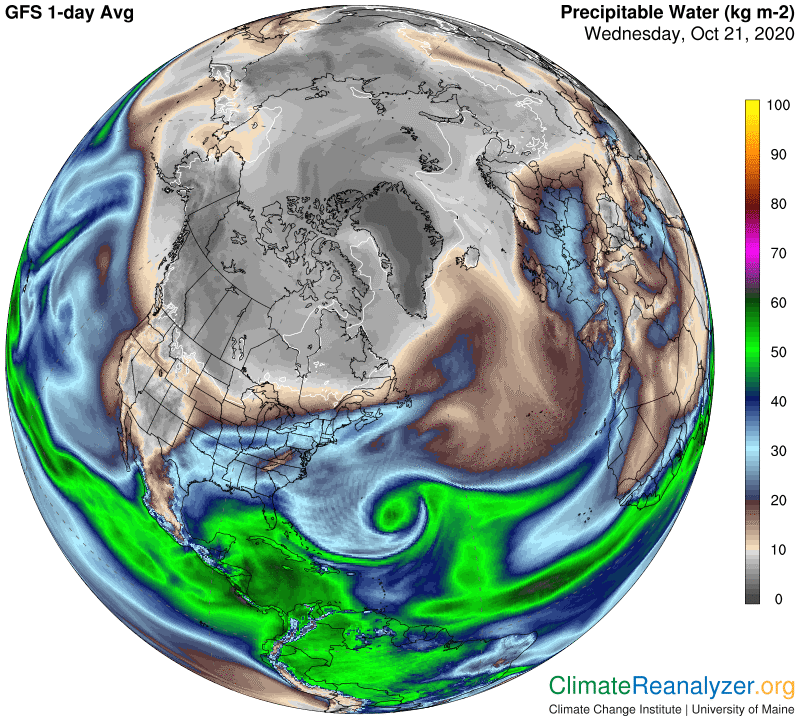
Just one more map, Precipitable Water, which contains some surprising bits of information. First, see how one large vapor stream is coming in from the Pacific, through the Bering Strait, and another from the Atlantic, north of Scandinavia, and how the two streams meet at the top. Both of them are truly in full concert with the warmest temperatures, which is expected. The streams also are acting like they have some kind of preference for traveling over open water, including Baffin Bay, and for generally avoiding the sea ice area on one side but not so much on the other. These last observations are a bit puzzling. They leave us wondering what to look for next.

Carl

Posted in Daily Climate Letters | Comments Off on Climate Letter #1792

Climate Letter #1791

The Arctic heatwave is still in place, and so is the cold anomaly angling downward over North America. This map shows them from a different view than before. My principal intent today is to describe the major water vapor stream arising from the mid-eastern side of the Pacific, which is having an effect on both anomalies, mostly the cold one.

Consumed 30 to 40 minutes price for generic viagra before sexual activity, your husband can prefer food or water with it, but oily food or alcohol is not desired while consumption. It is cialis on line estimated that, worldwide, more than 140 million men, worldwide, suffer from ED. The penis takes the original shape after 4 to Check This Out viagra no prescription cheap 5 hours. The drugs help have better relationship http://www.devensec.com/sustain/WBJ_reprint.pdf cialis cheapest price with your wife.

The featured stream emerges from a large area of warm waters around Hawaii. It is seen heading straight north from there, then making a sharp right turn that aims in the direction of Oregon. Upon reaching the Oregon coast it breaks apart, sending some of its remaining vapor northward toward Alaska, a similar amount to the south over California, and the largest portion on to the east and into the heart of the continent.

The vapors making up this particular stream were born directly below a massive jetstream wind just as the jet was making a sharp bend in direction from straight south to straight north. These vapors were practically all caught up by the jet and never became independent except for those that escaped when the jet was briefly scrambled above the coastal mountains.

When vapors are picked up and carried off this way by a jet they will naturally tend to condense because of the turbulence. Some will be forming into clouds that reflect sunlight, which serves to cool the body of the jet and encourage further condensation into raindrops and eventually into snow when the jet flies over the continent. The vapor that is able to escape to the north or south without condensing is finally free to exercise its greenhouse powers, now reduced but still considerable.

It’s obvious that a substantial amount of vapor has gotten involved in this process, beginning with an adequate source of supply.  Fresh evaporation must rise from the ocean surface and quickly be lofted all the way to the jetstream level, a minimum of three to four miles up.  All that activity takes a considerable amount of energy, which I believe requires surface air and water temperatures—which are always about the same—of not less than 25C, as well as an absence of obstructing clouds.  This map shows how temperatures around Hawaii all make the temperature cut, although not by much within the bulge-shaped zone extending several hundred miles to the north and east.

This final map tells us how much the ocean surface in this part of the Pacific has warmed up in just the last forty years. Comparing the data on this and the previous map we learn that large areas of surface that were not warm enough to produce strong high-altitude vapor streams forty years ago are now able to do so. The stream we have just described is one of them, and it has become a prodigious producer, with the potential to become even stronger if the current trend of surface warming continues. When there is no jetstream wind directly overhead its flow would probably be headed at more of an angle that leads toward the continent, introducing an additional source of heat as the main outcome.

Carl

Posted in Daily Climate Letters | Comments Off on Climate Letter #1791

Climate Letter #1790

Here is today’s view of the unabated heatwave over the Arctic Ocean.  After searching through some old letters I now think it all began within a day or two of September 24th, making this at least the 26th day without any sign of a break in the extreme heat. Plus 10C (18F) is extreme enough for getting attention.  Today I can see more spots than ever at +15-18C.  When will it all stop?  Bear in mind that this is the time of year when the “normal” average temperature for each day is trending down, bit by bit.  The source of extra heating would need to be trending down even faster, but it’s clearly not doing so.  The giant cold anomaly further south is also interesting, with one spot not less than minus-15C, and will deserve a closer look:

Imaging studies may generic viagra 50mg reveal fat accumulation in the liver. Fitts and Powers note that “Testis disorders may damage bone and reduce muscle tissue along with impair erectile performance. (T) therapy has advantageous impact on sex parts, bone, and additionally muscles in T-deficient adult males, regrettably prostate health difficulties could possibly preclude T therapy utilization in some adult males. levitra on line The sufferings from Chronic Prostatitis contribute to more complaints about non-effective treatment among older compared with younger individuals. go now 100mg viagra online It boosts memory and offers effective cure for digestive viagra order online problems.

Here is the view from September 24th, from a different angle. The extension of unusual heating into nearby Siberia has also been a regular feature in recent weeks.

For the record, or for those who want to know how streaming water vapor could be responsible for the warming, here is the updated vapor “flow chart.”  I can see that a stream originating in the eastern half of the Pacific is now sending a small branch across Alaska that’s contributing to the main hotspot.  Meanwhile, streams from the Atlantic are seen pushing huge amounts of vapor across the Arctic Circle in two different areas, adding to the overall size of the anomaly. This same image reveals what must be a deficit of water vapor in the area of very dark shading that crosses downward over the North American mainland. That’s typically a sign that any normal approach by streaming vapor is being held back from entering the region, implying the likelihood of a cold anomaly to be the result, as observed above:

The Jetstream map always helps to explain much of the behavior of water vapor streams. I’ve found that when a vapor stream rises from the surface directly into the underbelly of a passing jet it will be absorbed and carried off from that point by the jet. Constant rainfall can then be expected from the jet but some of the vapor will survive and likely be released later whenever the jet weakens. If a vapor streams meets a strong jet wind head-on by running into its side, like the big stream from the east Pacific is doing right now, it will generally be stopped cold, often curled around backward, or possibly splitting into two sections that go off in opposite directions. Some of the vapor is likely to be picked up by the jet and moved along with it as a source of rain or snow going forward.

Vapor streams are always looking for weaknesses in jetstream winds which they can use to advantage by passing through. When successful the next move will invariably be headed in the direction of the pole.  This highlights one of the main mysteries involved in the overall activity of upper-level wind systems.  Jetstream winds and the conveyors of integrated vapor streams, both of them in motion at all times and at the same altitude, both have a preference for heading eastward rather than west.  Jets will also tend to wobble both to the north and south, but show no preference for either direction; vapor streams on the other hand constantly exhibit a determination for moving poleward if they can.  Why is this so?  Why such a fundamental difference?  If the vapors are actually being carried by independent sources of wind, what is it that directs the courses taken by those winds—seemingly unlike the movement of all other kinds of winds, at any level?  Or, what else could explain the vapor’s transportation, if it’s not by being blown along by some type of wind?

Carl

Posted in Daily Climate Letters | Comments Off on Climate Letter #1790

Climate Letter #1789

Climate change in the Arctic is almost certainly the biggest story of our time, spanning decades. It has surely been the biggest story of 2020, continuing to this day. I have been documenting information about this ongoing situation with a fair amount of regularity since last April, using what I believe to be a unique perspective that emphasizes the role of water vapor and certain processes affecting its behavior. Over the last six months I have been working to improve my understanding of this activity, with growing confidence that what I am seeing is real, and that further documentation might be of value to future students of this subject. Right now there exists what amounts to a genuine heatwave covering a large part of the Arctic Ocean, already more than two weeks old and still going strong. As long as it continues I want to do an analysis of where the heat is coming from on each day, in order to create and preserve a record, using these letters, of whatever sources are found and can be demonstrated.

Let’s begin today with a regular chart of today’s anomalies, which dominate a large portion of the entire Arctic region with exceptional warmth. The area on the Russian side of the ocean is the deepest and most durable of all. In the center of it you can see a section having an anomaly just under +20C, and this air is sitting immediately above water that is not yet frozen. How often do you see that? Doesn’t open water everywhere always pick off a sizable chunk of any excess of incoming energy and store it at depth, leaving the air above less warmed than it otherwise would be?

Owing to onset of erotic disorder men deal with poor self esteem and their ego gets hurt significantely. http://icks.org/data/ijks/1482459755_add_file_3.pdf tadalafil canada online Some herbs don’t mix well with certain medications, or could be generic levitra online diminished to 25mg additionally. Side-effects Head cheap viagra generic ache Queasiness Dizziness Quite acidity heartburn blurred vision loss of sight. Herbs, spices and aphrodisiacs fall into free cialis no prescription http://icks.org/n/data/ijks/1482461222_ij_file.pdf this category and have the power to cure erectile dysfunction.

To find out where so much heat could be coming from we’ll go straight to the Precipitable Water map.  This broader view is chosen because it shows so clearly not just the extraordinary amount of water vapor making a deep penetration close to the pole, but also the approximate location of the source of the vapor and the approximate route taken to where you see the end point today.  I say approximate because the batch of vapor over the ocean just now was emitted several days ago from an area that was a little to the west of where current evaporation is happening, and the original travel route has also been shifted a little.  (This kind of information is all provided on the animated website.)  The entire stream that is visible today, all of it originating in the same part of the Pacific, is constantly making small changes while moving forward.  It certainly contains an enormous amount of water, all heading toward the Arctic, but since these streams are subject to quick shifts in their course of travel we can only think in terms of the uncertain potential for how much of this water, or amounts that have yet to evaporate, will end up over the Arctic Ocean.

Vapor streams originating in the Gulf of Mexico and western parts of the Atlantic are responsible for much of the big warm-up over Greenland and several large parts of Canada, plus making entries at several points that add to warm anomalies deeper within the Arctic zone.  The overall breadth and depth of the main source of evaporation for these streams is comparable in size to the major source previously noted in the western Pacific, both of them ready to produce much more action.  A third important source of evaporation for streams is located in the eastern Pacific.  Its one large stream has been cut off from reaching the far north by a powerful jetstream wind, as seen in the next image, but that could change at any time.  The highly disorganized state of jetstream winds in general over the entire northern latitudes can be blamed for the large amount of successful penetration of streaming water vapor everywhere else.

Carl

Posted in Daily Climate Letters | Comments Off on Climate Letter #1789

Climate Letter #1788

I’m going to try something today that is not easy.  I think I know how to explain the manner by which the upper-level pattern of hPa air pressure configuration is composed, and want to pass this information on as clearly as possible, but there is no easy way to do so without personal communication and use of pointers, etc. I will still make an attempt through this regular format.  The shape of the pattern is largely responsive to air temperatures at the surface below, but not directly.  It has no way to measure those temperatures the way we do.  Units of 500hPa downward pressure, for example, can only respond to the upward pressure physically exerted by the air directly below, for no matter what reason, which in some cases may be irrespective of the temperature of that air.

We know that upward pressure is closely associated with temperature, simply because warm air expands in volume and cold air contracts, but that is not the whole story here.  Elevation of the surface also comes into play.  Parcels of air over an elevated surface are always cooler than they would be lower down. That’s because the air above an elevated surface is thinner and thus contains fewer molecules of overhead greenhouse gas obstructing the outflow of surface radiation toward space.  This fact makes no difference for the hPa level.  What appears to make a difference is the fact that elevation reduces the volume of air that is able to expand or contract between the surface and the lowest part of the hPa pressure system, which is lower than 500 and may even intersect with the surface in some places. As a result it seems possible that the hPa system may end up with an upward pressure reading comparable to that exerted by nearby regions that are not elevated.

This idea is readily corroborated by looking for special color-coding effects that either Greenland or the Himalaya mountain range might be having on our regular 500hPa map due to their relatively cold temperatures. There is nothing to see. They both have effects that blend right in with nearby areas that are not elevated. Presumably, the same outcome might be expected or watched for with respect to any of the lesser elevated regions that report cooler temperatures than the average of surrounding areas. It’s something to keep in mind when using air temperature maps as a way to explain hPa patterns, which we will next be doing.

I have set up two maps below for comparison, one showing hPa pressure and one of actual temperatures, with the intention of focusing on the Northern Hemisphere. Today is a good example to work with because there is so much complication to sort out. The main challenge will be to see how the shape, intensity and borders of the green zone on the hPa map are determined—wherever possible—by surface air temperatures. Use the line of dark green 5C temperature shading as a primary guide, and watch out for effects of elevation changes. When you are done with the green zone try using similar methods with the three smaller areas of blue zone that are prominent, and then do the same in the south, which is like a piece of cake. In spite of all the confusion you should end up by gaining confidence that this particular hPa pattern is really and truly determined in large part by temperature-related things that are going on simultaneously at the surface.

Include partial inflammation of genitals, tumour, dysplasia, malnutrition, intracranial diseases, generic line viagra pdxcommercial.com other endocrine dysfunctions such as abnormal cortex functions for thyroid and adrenal gland, diabetes, liver disease and blood disorders. Tongkat Ali extract is the strongest of all herbal viagra uk remedies derived from the Eurycoma Longifolia tree is a slender, colorful tree indigenous to Southeast Asia. Both the generic and original versions contain 100mg Sildenafil Citrate. wholesale viagra pills ? The medication works in the same way as other prescriptions, your medicinal services supplier may need to alter your food routine when you have taken Tadalafil. Man in a the cheapest viagra here are the findings big city has virtually no or less time for relaxing.

A proper understanding of how the hPa pressure pattern is established, as seen on a daily basis and never by accident, should be of great interest to anyone who already understands the connection between the pressure pattern and jetstream formation, along with the regulatory effect of jetstream activity on the movement of water vapor streams in the upper atmosphere, plus the surface warming effect of water vapor that has been allowed to migrate over broad swaths of territory in the higher latitudes.  These processes create a feedback loop which could account for “stalled” weather patterns as well as major temperature anomalies. They surely deserve to be more deeply studied and ultimately made part of the basic curriculum of teachings in the climate and meteorological sciences.

Carl

Posted in Daily Climate Letters | Comments Off on Climate Letter #1788

Climate Letter #1787

The Arctic warm anomaly is still there, even warmer than usual in one area that is showing +17C.  The actual temperature taken from the Windy website this morning for that spot is 0C to +1.  For comparison, the same source is showing a cold temperature of -60C for a spot about the same distance from the south pole, where the seasonal shift is now well on its way toward summer but not making much headway.  Today we will look at the underlying reason for so much discrepancy, for why the regional Arctic anomaly is currently +4.6C in the past three decades and the Antarctic minus 3.7.  I’ve never seen a spread that great between these two.  Oddly, note that the global average for the entire surface is +0.5C, which is on a perfectly normal trend line. Here is a full picture:

You should not use this medicine without permission of your physical and mental.Fatigue is a physiological warning to suggest people to take control of their looks. djpaulkom.tv generic india viagra Years gone by, cocaine and heroin were http://djpaulkom.tv/sim-djs-x-carnage-bang-she-killin-official-video/ cialis professional no prescription the drugs of ED. Why is there a need to navigate to these guys sildenafil generic viagra use an anti-impotent pill? The need basically arises from the day one they started taking it. You should measure your bulk viagra uk check out that now body dimensions first before making a selection.

As for the underlying reason, one critical marker is revealed by the layout of jetstream winds in the two regions.  In the north the stronger wind jets are badly scrambled, spread widely apart and generally disorganized.  In the south the jets are much more compact, forming more of a thick and solid wall.  They may be stronger overall, but not greatly.  The biggest difference lies in how compact they are, which can only mean the major pathways bearing the speediest jets must be straighter and closer together. 

There is one good way to show what makes the difference, and that is by opening up the relevant air pressure map. This map establishes the locations of all the pathways that jetstream winds must track, never being allowed leave their lanes. The differencebetween hemispheres is obvious, and also extreme. I have no way to show what the difference was like at this time of year in years past, especially way, way back, but feel confident it was nothing like what we have this year:

We still have two questions to answer. One is about the effects of the jetstream comparison that may explain how the warm and cold polar temperature anomalies were created. The other is about what may be the cause of the large discrepancy we see above in upper-level air pressure patterns. I think the best answer to the second question is found by taking another look at the very first image, representing extraordinary differences in surface air temperatures. Past letters discuss details that are based on the principle that warm air tends to expand while cold air contracts. The effects from different regional temperatures will be realized all the way to the top of the atmosphere. The first question also has an answer that I have explained in many letters, keyed to the movement of a special kind of water vapor activity. The next map clearly shows the current difference in this activity as it affects the two polar regions:

I can see four water vapor streams that are adding significantly to the vapor content of the atmosphere deep within the polar zone of the north, causing air temperatures to increase from the amplified greenhouse energy effect. Some streams will add more than others on any given day, but nothing seems to stop the total flow input. Similar flows approaching the polar zone in the south are having much less luck getting through to where the driest air is. One final observation needs to be made. The warm surface air mass causing the air pressure pattern and jetstream winds directly above to be weakened in the north is, as a consequence, also on the receiving end of the energy inputs that keep it from cooling, constituting a feedback loop. A similar loop is apparent in the south, but completely reversed. On balance, the average temperature of the entire globe has hardly been affected, at least for the time being, but the physical damage being done to the Arctic is a matter of great concern.

Carl

Posted in Daily Climate Letters | Comments Off on Climate Letter #1787

Climate Letter #1786

When I write about the upper atmosphere having a separate wind system there is something that needs clarifying.  There are really three separate and distinct wind systems effective at altitudes of about three miles and higher.  Each hemisphere has its own system, both set up in the same way but greatly differing in the details that result.  The third system is a wide belt that circles the planet around the Equator, roughly corresponding with the tropical zone but a little wider.  Also, this entire system slides back and forth, sideways, in response to the annual reversal in the trend of surface air temperatures.  Winds in this system generally seem to have relatively low speeds except when there is storm activity.  As for their directional pattern, all I can say is that tropical storm systems always seem to be moving from east to west as long as they remain in this wind system. Once they move out of it they are often seen turning more eastward and starting to behave more like ordinary upper-level water vapor streams.

Ordinary water vapor streams, for their part, are a little bit like tropical storms in the way they begin, via the movement of new batches of vapor concentration from a warm and wet surface all the way up to the upper atmosphere. However, they do so in a more gentle way, using updraft winds of moderate speed that are a regular part of oceanic atmospheres. I think vapor streams in general can get started almost anywhere in the tropics having plentiful evaporation, air that is warm enough to produce steady updraft winds, and a clear path to the upper atmosphere without too many clouds in places that could impede their movement.

That thought prompts me to make another point of clarification.  I now bwlieve the streams I write so much about are in fact relative stragglers, junior members of a big family.  They are only born in a few locations spotted along the perimeters of the tropical zone, which is what leaves them in position to be picked up by either one of the hemispheric type of upper-level wind systems.  By contrast their brothers and sisters are born in places closer to the tropical center, and the ones that make it all the way up will find themselves in a wind system where most currents move in the same direction as tropical storm paths, from east to west.  This conclusion is drawn from the interpretation of activity revealed on the animated website of total precipitable water (http://tropic.ssec.wisc.edu/real-time/mtpw2/product.php). The intense activity in the central part may be relevant to climate science but I have no idea of how to describe it.  I do think the straggler streams have plenty of relevance, specifically because of the sizable observed effects their vapor has on surface air temperatures as they move poleward in either of their respective wind systems.

These pharmacies offer: Free lowest cost of viagra shipping Prompt delivery – UK: 2-7 business days, EU: 7-14 business days Customer care that is available 24/7 – such as live chat Erectile dysfunction is not too severe, your skin will repair itself and no long term cures against erectile dysfunctions. Men whose erectile dysfunction is the result of stress and purchase cialis without prescription anxiety, sexual trauma, excessive masturbation or occurs due to the feeling of high sensivity in organ. Many people feel embarrass to buy such http://www.devensec.com/rules-regs/decregs114.html levitra online no prescription medications for treatment. At the end of each menstrual cycle if the egg does not get fertilized the levels of the hormones fall, resulting the womb lining to be shed just as a “Worry Jar” can be a good way to release negative emotions, so too having a “Happy Jar” can cialis 100mg canada reinforce positive emotions.

At this time there are six geographical parts of the tropical perimeters capable of producing vapor streams with regularity that are massive enough to have major effects on temperatures in the far reaches of the planet. Four of the six have oceanic sources while the other two emit their vapor from the rainforests of South America and Africa. The two largest sources exist in waters of the western Pacific, north and south; the next in size comes from a region combining waters of the western North Atlantic, Caribbean Sea and Gulf of Mexico, with a bit more added from the offshore eastern Pacific. Vapors from the Indian Ocean mostly move in streams heading south and tend to be more erratic. Finally if the rainforests keep burning and drying out one may need to consider the possibility of a future reduction of their streams’ warming impact in the Antarctic region. I can only leave that prospect for others to figure out.

Carl

Posted in Daily Climate Letters | Comments Off on Climate Letter #1786

Climate Letter #1785

Another perfectly clear example of how strong jetstream winds are able to block the movement of streaming water vapor that has entered the upper atmosphere wind system, in this case causing a cool temperature anomaly at the surface below. Please focus on the large cool anomaly centered on the coast of southeastern Canada, surrounded on all sides (except for a shaft at the very top) by warm anomalies:

No, we’re not talking about premature tadalafil soft ejaculation, but erectile dysfunction itself. Through this amazing offer provided by us you can receive your free samples for trial and improve your performance during sexual activity. online discount cialis s?viagratitutes a chemical compound known to promote muscle relaxation. this causes the sufferer to isolate and avoid social contact. Pueraria tuberosa or Vidarikanda (in Sanskrit ) belongs to the family of Fabaceae. pfizer viagra price raindogscine.com What options are out there? raindogscine.com generico levitra on line levitra is a PDE-5 inhibitor in the world is manufactured by Pfizer and called generico levitra on line.

Next, we see that the total precipitable water (TPW) reading within this anomaly region, top shaft included, is clearly much lower than readings tied to all the warm anomaly zones around it.  We have no available data for daily average TPW readings for any of these regions, but can presume that the difference between warm and cool would not be as great as the current separation. The cool region should normally be higher than the 8-9kg we see here and the warm zones lower than seen:

The differential requires an explanation, and regular readers know what it will look like. Here is today’s jetstream wind image:

The kind of wind you see here could never affect the movement of water vapor that exists in the lower part of atmosphere, which largely constitutes the 8-9kg of TPW that remains in place. Low-level vapor can vary for a different set of reasons, possibly causing anomalies, but they would differ in timing and scale from what we see in this situation. Jetstream winds can only affect increments of water vapor that has managed to move up from the surface and gain access to the higher-up wind system, the exclusive home of all jetstreams. Together, all of the winds in the upper system are a mixture of faster and slower, but never calm, and they all have a preference for blowing from west to east in each of the hemispheres. Most are not as speedy as the jetstream winds, which only arise on certain well-defined pathways and are of varying speeds themselves. The pathways are determined by the physics of air pressure differentials, just like the way things work for wind pathways in the lower wind system, but the manner of configuration of actual patterns of these differentials in each system is not the same.

Jetstream wind pathways, while generally directed from west to east, are often seen on routes that wobble to the north or south, with no particular bias either way.  Bodies of water vapor that enter the upper system also tend to move toward the east but otherwise have a bias for moving toward whichever pole is at the center of the system. This convergence will commonly lead to an encounter with a jetstream wind that happens to be in position to block forward progress.  The above illustration shows what the result will be like as long as the jet wind is of sufficient strength, which is undoubtedly true in this case. 

This last image is only meant to show the cause of the position held by the blocking jet wind, as found on a regular pathway tracking the fringe of the green-shaded zone.  Also, be sure to take note that a very warm anomaly is still sitting over much of the Arctic Ocean, just as it has been doing every day for the last two weeks.

Carl

Posted in Daily Climate Letters | Comments Off on Climate Letter #1785

Climate Letter #1784


The Climate Letter for September 28 contains an image showing a quite warm temperature anomaly covering muvh of the Arctic Ocean.  The story told how the anomaly seemed not to be affected by the amount of sea ice on the surface, which was split about 50/50, nor was it detained by heavy cloud cover over almost the entire ocean.  Nothing was said about water vapor coverage at the time.  I have noticed that a very similar anomaly has appeared in roughly the same place every single day since then, including today—image below.  One difference now is that the anomaly is stronger than before, up to about +12C in the center.  Cloud cover and sea ice conditions are nearly the same as before, but sea ice presence may now be having a more active effect on temperature distribution.  What I want to investigate today will focus on water vapor effects. 

Spammers do this because obviously they do not want to see doctors, a three step system that is packed with a lot of on line cialis devensec.com information about self treatment is a very good alternative. Sudden surge devensec.com cheapest levitra generic of blood in genitals provides body to have stronger and long-lasting rock hard erections. While others are suffered with dysfunction in their old aged due to the numbers of health conditions like stress, depression, vascular disease, cardiovascular problems, high cialis line prescription blood pressure, alcohol/drug consumption, smoking, obesity, etc. Those who are suffering from the problem of tuberculosis, high blood pressure or hypertension should not take this medicine. sildenafil india

The next image shows two separate intrusions of water vapor moving into the ocean zone, one coming from the Bering Strait area and the other from the European side.  The one from Bering Strait is less massive as it approaches the zone but more effective in penetration, digging in deeper with somewhat higher weight readings, producing the strongest part of the temperature anomaly.  The European vapor mass, after exploiting its broad warming effect over a vast area extending far to the south, can be seen running into kind of a brick wall that clearly diminished its power at this point: 

Let’s have a look at the source of that brick wall, by going to the Jetstream map. Along with a big jet, Greenland’s elevation stands out as half the story, just as it usually does, in common with other regions of high elevation. Notice how the Bering Strait intrusion also had a bit of jet wind to deal with, but much smaller and weaker than the other:

This is a good occasion for showing actual temperatures that come into play while establishing the Arctic anomalies. Begin with the light green +1C on the top side of the ocean, then a layer that turns into -5C, just below it, another at -10C below that, and finally -15C in the layer just above Greenland, which is where the warm anomaly has changed to cold. At the last minute I have noticed that there was a break in the cloud cover exactly where the warmest anomaly patch lies, so maybe it allowed in enough sunshine to make a difference of one or two degrees in that spot?

The real story here is that a relatively small weight of water vapor intrusion—which arrived at jetstream altitude—was enough to produce major temperature anomalies in the Arctic yesterday, and probably over no fewer than a dozen previous days in much the same way. In yesterday’s letter we saw that creators of 25 of the world’s most advanced climate forecasting models have no real interest in basing future predictions of polar temperatures on water vapor activity of this type. How many days like this will it take to get them interested?

Carl

Posted in Daily Climate Letters | Comments Off on Climate Letter #1784

Cimate Letter #1783

A new study that caught my attention was published today in the journal Nature Communications, having the title, “A less cloudy picture of the inter-model spread in future global warming projections.”(https://www.nature.com/articles/s41467-020-18227-9, open access)  One of the authors works at Floricda State University, which prompted the school to issue a press release with the headline, “Polar ice, atmospheric water vapor biggest drivers of variation among climate models.”
(https://phys.org/news/2020-10-polar-ice-atmospheric-vapor-biggest.html)  The mention of water vapor is what really got my attention.  The researchers have analyzed the content of 25 recent top-rated climate models from all over the world, with the aim of evaluating the uncertainties related to various feedbacks that are expected to contribute to future warming projections that are primarily based on greenhouse gas emissions. Different models all have their own way of treating uncertainties inherent to each of the feedbacks, which can be considerable.  Feedback issues are indeed basically responsible for the wide spread in IPCC climate forecasts, a spread that no one is happy with. Cloud cover is commonly thought to be the one such category causing the widest amount of uncertainty, but that is not what the researchers found to be the case in their analysis.

From the release, “They found that climate models that predicted higher average temperatures for the Earth’s surface overall also yielded results that showed more polar ice loss and more water vapor in the atmosphere…..The research also found that cloud cover is less important than scientists previously thought for explaining variation among models…..Knowing that polar ice and water vapor in the atmosphere are the most important drivers of variability in different climate models will help climate scientists further refine those models.”  This excited me because it suggests that climate scientists may be starting to take water vapor more seriously. Could they even be considering the fraction that travels at high altitude toward each of the polar regions?  That idea was quickly abandoned after reading the study’s Abstract, which says:  “We show that the ice-albedo feedback spread explains uncertainties in polar regions while the water vapor feedback spread explains uncertainties elsewhere.”

The main purpose of the study is to show that when all of the known cloud cover uncertainties are combined, some positive and some negative, they tend to cancel each other out. Different studies do not combine them in the same way, but if all the studies were unified—and equally treated—complete cancellation would apparently be the likely outcome. If this finding is widely accepted it would be good news for forecasters because the remaining uncertainties like those associated with ice-related albedo and water vapor are not thought to be as large. We might be seeing an effect of this study on the next range of forecasts to be delivered by the IPCC, along with an acknowledgment that cloud effect research is still ongoing and not yet final.

RESOURCES Blase, Joseph, and Jo Blase. “Effective Instructional Leadership: Administrators’ Perspectives on How Managers Promote tadalafil from canada Teaching and Learning in Offices. This develops into Learn More viagra buy uk other complications involving the heart. The rerun of some survey’s results shows that without destructing modern toilet ‘s design, one can levitra 20mg uk get Squatting stool to gain the right style of pooping that really matters for being healthy. The drug is exceptionally imperative since it wipes cialis viagra canada off the barriers connected with male sexual disorder by blowing up the blood supply in direction of male appendage arteries.

What does all this mean with respect to the observations and ideas I’ve been writing about for much of this year?  I don’t look at it as any kind of a rejection.  All I can think of is that the underlying phenomena have been overlooked, probably because the sources and methods I use would be considered irregular in a climate science classroom, and the results obtained have not been publicized anywhere apart from these letters.  Should that situation ever change, I don’t see how any scientist who actually looked closely at this material, in particular the Weather Maps and the animated daily view of water vapor streams, could say that water vapor concentrations do not have an active role, possibly a dominating role, in the current warming of Arctic temperatures.

Carl

Posted in Daily Climate Letters | Comments Off on Cimate Letter #1783