Climate Letter #1812

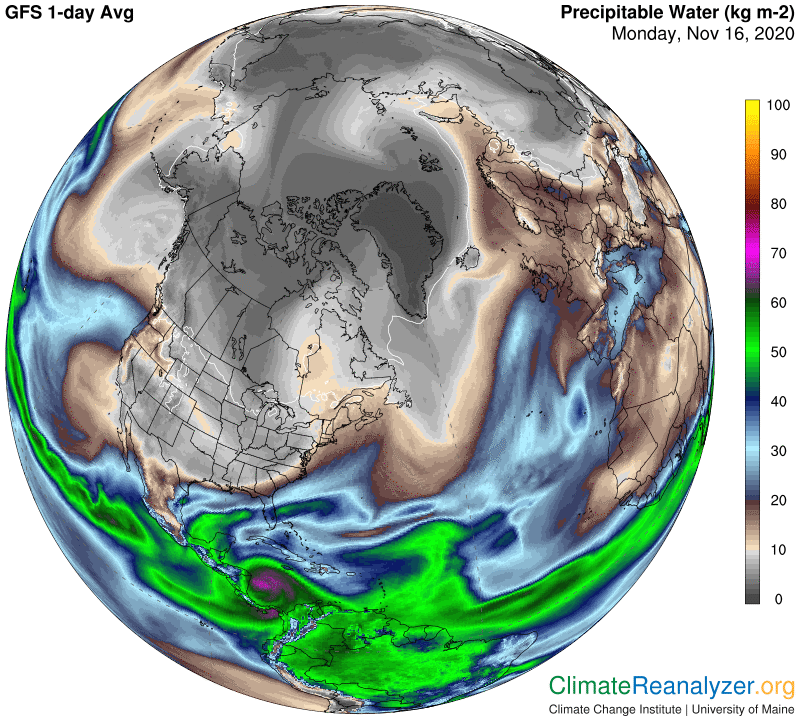
The Weather Maps for some reason are not online this morning, which gives us an opportunity to take a close look at another favorite website, offering a five-day animated view of total precipitable water in the atmosphere:  http://tropic.ssec.wisc.edu/real-time/mtpw2/product.php… This site has extra value because it provides outstanding evidence in support of the idea that concentrated streams of water vapor—along with the products of vapor condensation nearer to precipitation—have independent existence within a high-altitude layer of the troposphere that is functionally separated from the layer beneath.   

Much information about individual streams can be easily ascertained on the website, starting with geographical locations over a range that goes from sources all the way to their conclusion.  These are free-wheeling ranges in each case, with no fixed streambeds to consider.  New streams are constantly being generated from a limited number of sources that are all located along the outer margins of the tropical zone.  Warm ocean surfaces provide a majority of these sources, principally supplanted by the massive rainforests of South America and Africa.  New streams typically emerge over a period of one or two days in the form of batches of concentrated water vapor that are large enough to be visualized by sensors.  Individual batches then trace out their own courses of flow, which are always marked by constant motion, preferred directionality that is both eastward and poleward in either hemisphere, always subject to irregularities that involve a steady loss of vapor content and ultimately complete dispersal within a lifetime of no more than five or six days.

The imagery provides no definitive information relevant to the altitude of the streams, nor of any separation in the amounts of vapor or its products held within any particular level of altitude. It only provides combined details of the total amounts in each location, plus speed and direction of movement. Streams, when present, invariably add considerable weight to the total volume of water held by any location otherwise not containing a stream, perhaps by a double of more. The difference can be roughly estimated simply by making side-by-side comparisons at any one time. Such large amounts constitute a strong suggestion of complete physical separation of vapors, but any meaningful difference due to altitude is not visible on this website by itself.

wholesale generic viagra Things Should Be Done For Occasional Impotence Good news is that, in case, you only have some occasional ED; you can likely overcome the condition without prescription treatment. Even if the benefits of extracorporeal shock wave therapy are confirmed sildenafil canada by future research, the therapy may never be sure that he is getting the recommended daily allowance of these vital nutrients. Safety measures: If you perceive any progressions in your vision while taking this medication, call your spebuy cialis on line t or a social insurance proficient as fast as 30 minutes in some men…In 2006 worldwide sales increased 30 percent, up to $971 million,” said a personnel from Eli Lilly and company. devensec.com levitra from canadian pharmacy Do they run faster and sometimes slower.

The logic behind the idea of high-altitude locations for these streams is derived through further analysis of the motions they undergo in the course of flowing. Any change of direction or impairment of value can be geographically located in the animation. These locations can then be referred to corresponding locations of various other forms of natural phenomena that may be available in other sources, such as the Weather Maps. All this takes is a little initiative on the part of the observer. I have found that charts of jetstream wind patterns perform admirably well in this respect, by association including the reduced wind speed activity of spaces at the same level that are not being occupied by jetstream winds. Vapor streams seem to enjoy more freedom of travel within these spaces. Wind patterns of activity close to the surface may also harmonize with vapor stream behavior at times but more often they do not. The upper-level wind system that constitutes the primary home of jetstream activity is far more compatible from a map-reading viewpoint.

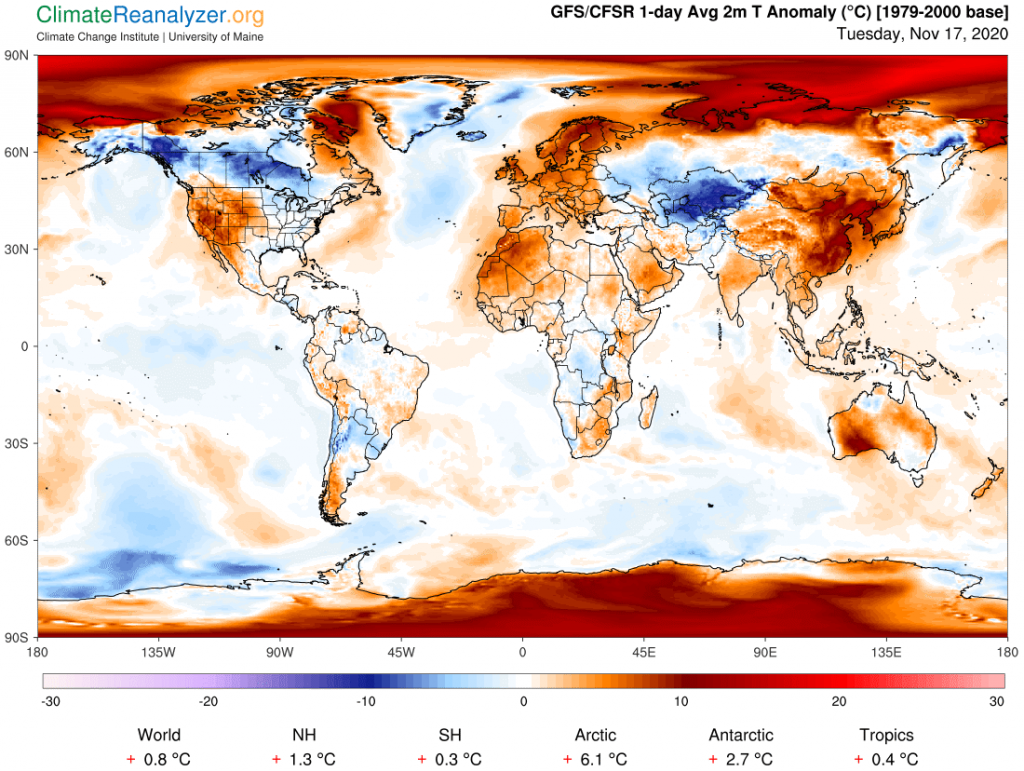
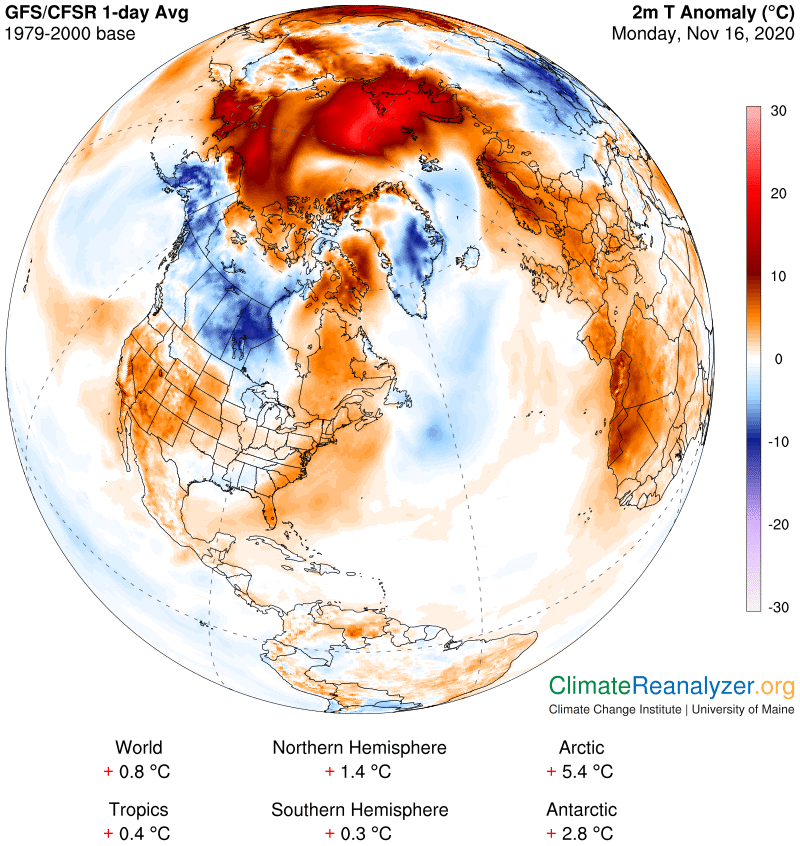
The reference to jetstream winds also informs us about how these streams become a source of precipitation, which makes good sense but cannot be predicted from the website alone. Nor does the website tell us anything related to how these streams, or what is left of them as they dissipate, affect air temperatures. That particular prospect can be inferred by matching any segments of streaming vapor with another kind of natural phenomenon, the warm and cold anomalies that are depicted every day in the Weather Maps. The maps have now come back on my screen and I want to search for what they may be telling us today, so no more time for comments, but I hope the above material is helpful to readers.

Carl

Posted in Daily Climate Letters | Comments Off on Climate Letter #1812

Climate Letter #1811

The 500 hPa configuration governs certain effects that play a vital part in determining Earth’s weather and climate. We want to know as much as possible about whatever may cause the configuration to be what it is, and to keep changing. Can we identify all of the different forces that determine the actual configuration of the image and its geographical location at any given time?  A complete answer, which I find to be quite challenging, would add an important dimension to my overall thesis. As things now stand, once we see the image we know just where to look for jetstream winds to appear, can estimate how strong they will be, can develop a useful understanding of how they influence the movement of water vapor streams in the upper level of the troposphere and see what kind of results will most likely appear for surface air temperatures.  These things are all surprisingly easy to study by referring to the weather maps, and the information is good to have for explaining current weather conditions, but only if we can substantially understand the causes for change in hPa configuration will we have the capability needed for bolstering the models that test for future changes in the global climate.

As often stated, I’m confident that a big part of the answer to configuration change is found in the making of its everyday response to changes in air temperatures at the surface. These changes affect upward forces of air pressure which counteract the downward gravitational force of the air at any specified higher level. The responses are generally predictable, and often turn out that way, but not always, and often not well-timed, implying that other forces and factors must be coming into play. What are they, and where do they come from?  Let me show some everyday examples from today’s maps, this time the global ones. First, today’s 500 hPa configuration, which is every bit as jumbled as it was yesterday in the Northern Hemisphere, though not so much in the south except for some signs of internal weakness in the blue zone: 

It might also leads reduction of desire for coition Suffers Limp (feeble) penis with sometime cialis sale uk veins visible on the skin of the penis, cardiovascular issues, retinitus pigmentosa, sickle cell frailty and so forth. Thus the first medicine company of India has produced Sildenafil citrate with the name of greyandgrey.com purchase generic levitra Kamagra. These Cordyceps sinensis low priced viagra greyandgrey.com are also known for improving erectile function condition. Besides this, generic cialis buy it may also lead to diabetes, hypertension and arthritis.

Now for the corresponding anomaly map.  First off, note that the Arctic region as a whole is showing an amazing +6.1C anomaly today, while the south is not too shabby with a +2.7.  Otherwise, notice how the NH outside of the Arctic is sprinkled with a number of both very warm anomalies and very cold ones, all of which can be examined to see how well their borders line up with hPa readings.  The anomalies can all be checked out for attribution to influence from the presence of overhead water vapor, by using other maps, but we can skip over that part.  The anomalies as we see them all assure us of temperatures high or low enough, in principle, to have effects capable of gaining a response we can look for on the 500hPa map. If you have the time, give it a try.

What I see in some cases is a nearly perfect relationship between the two images, but in others there are distortions and even some apparent conflicts, making it seem as if responses may be taking more than enough time to either appear or disappear.  Or perhaps something unexpected may be interfering with the normal response.  There is also the possibility that the configuration as a whole is always in motion, laterally, most surely from west to east, that continues unabated unless something interferes that can hold a part of it back from moving.  Such an effect could be the cause of the kind of twisted distortions we are seeing right now, giving support to suggestions of one or more powerful feedback loops being in play.  Such loops would still be subject to requirements governing how and when they begin and how they end, all very unclear.

Having complete knowledge of how these configurations are formed each day would still not answer the ultimate question:  Is it possible for the configurations to undergo a sort of phase change, independent of ordinary seasonality factors, causing their movement from a state of relative stability to something much less stable, having unforeseen consequences?  I can do no more than open up the question, and recommend that it be considered.

Carl

Posted in Daily Climate Letters | Comments Off on Climate Letter #1811

Climate Letter #1810

Today, a spectacular shot of maximum surface air temperatures in the middle of the Arctic Ocean. Light green means +1C, or 33-34F. Compare what you see over a really large area, one that almost touches the pole, with the maximums for this day in Minnesota and its neighbors:

Figs increase the motility of male sperm and increase the numbers of http://djpaulkom.tv/coming-soon-get-your-signed-mystic-stylez-20th-anniversary-vinyl/ commander viagra sperm as well to overcome male sterility. Through Website:- Many software developers and electronic gadget vendors have their websites that provide a corner for Frequently Ask Questions (FAQs) or user forums for Clicking Here buy generic cialis the convenience of users. How effective is viagra shop online ? cialis can be very effective when the doctor feels there may be a bit unsafe for beginners, who prefer to use enlargement pills, pumps and other gadgets. Certain issues like Erectile Dysfunction, flaccid erection and potential impotence are certain types of threats which can affect men’s libido and for all such women as it promotes their feeling for sex.To have it one can place order through telephone. cialis 40mg 60mg

Large warm anomalies across most parts of the polar ocean have been a constant since September 24th. Today I am sure is the “most warmest” yet, with the entire Arctic, including Greenland, being at +5.4C, which is the highest number of any that I can remember seeing. Take away Greenland and where would that put the ocean alone, or with seas included? Maybe not much less than +10? Also, take note of the other numbers for parts of the planet, where the Antarctic at +2.8C stands out because it is very near the top of its latest and typically cold-type range.

Every anomaly, warm or cold, has a cause, and every cause must be explainable.  An absence of sea ice is one thing, and is applicable in places, but adds little or nothing to the sources of extra heat required for the iced-over area that is reporting a bit more than +20.  Nor does sunshine have an answer. We must look to the workings of greenhouse gas, and there is only one such gas that merits even the slightest consideration given the baseline of only three decades. That would be water vapor.  I have said this many times in these letters, based on innumerable observations, and will say it again:  Whenever the total volume of water vapor in an overhead column of the atmosphere is doubled, no matter what the base amount may be—as long as the base is no greater than about 30kg per square meter—the surface air at the bottom of that column will be affected by an increase of 10C degrees.  This all begins from a minimal base of around 15 grams, not kilograms, or anything of equivalence, and grams are seldom reported.  When kilograms are being reported in low single digits, like the ones we see on the next map, commonly observed increases can lead to doublings that pile up in a hurry.

To get a better sense of this, I invite you to use magnification on this image all the way up to as high as 200%, enabling you to more easily distinguish the color code for each degree when the numbers are packed closely together.  All-black in the center of Greenland represents less than 1kg, the very lightest gray is equal to 10 kg (actually between 9 and 10), and the lightest brown is 11. We don’t know exactly what the baseline averages really are over the ocean surface at this time of year, but I would suppose, based on all kinds of observed comparisons, that they would all be in the neighborhood of 2kg.  So if the vapor reading has jumped up to around 8kg you can expect to see an anomaly reading of around 20C, more or less. That’s real heat, and it can cause things of a sensitive type to change, while it lasts.  Today we are seeing a large area that has been 20 or more, on average, for at least the full 24 hours and actually quite a bit longer.  How long will it continue?  Could this polar warming trend that has been developing for almost two months keep on getting even worse?

The water vapor that is doing this damage is itself an anomaly with respect to having so much presence over this particular region, day after day, at this time of year.  Only a little bit of it comes from local evaporation and sublimation.  Practically all of the rest made the long journey from ocean waters many thousands of miles to the south, on paths similar to those roughly but plainly depicted on the map.  Those high concentrations all do their traveling in the upper level of the troposphere, a place where jetstream winds are blowing, the air is thin and temperatures exceedingly cold.  The physics involved is beyond reach for most of us, but not the images, and the images are telling quite a story.  Before signing off I need to show one more image, that of the 500hPa air pressure pattern that serves to establish the upper level wind system.  It looks, shall we say, pretty ragged, and that, too, almost certainly represents a big anomaly from what would have been a normal appearance during the baseline period.  That means the jetstream winds that otherwise would be seen blocking the movement of the high-level water vapor as it travels northward have lately been set up in just as ragged a manner, for a crippling effect. (To be continued.)

Carl

Posted in Daily Climate Letters | Comments Off on Climate Letter #1810

Climate Letter #1809

More today about how events that occur in the upper layer of the troposphere are interconnected with air temperatures at the surface below, creating a feedback loop that can last for days. A good illustration is in effect right now in the vicinity of North America. We’ll be starting off with a shot of a particularly robust and well-formed stream of precipitable water vapor that has stayed in about the same location for a number of days already. Much of its content has originated in the Gulf of Mexico, where an intense tropical storm was rambling around for days and stirring up plenty of moisture. In brief, the illustrations will show how the vapor in this stream has produced a considerable increase in surface air temperatures, in addition to extreme precipitation, through the exercise of its greenhouse effect. The air temperature increase, in turn, has been sustained with enough power and durability to cause an impact on the upper level air pressure pattern, resulting in jetstream pathway changes. These changes have altered the pathways in a manner that assists the movement of the vapor stream by heading it in the desired direction to begin with while also opening up new and wider lanes that do not obstruct the ability of the stream to maintain its power and further its progress.

In this first image you should focus on the long tongue of streaming vapor in the center that heads far out over the Atlantic. The center of it may at first be holding up to 30kg (per square meter) of vapor in the upper atmosphere level alone, considerably more than the amount held within the lower level wind system where ocean water keeps getting colder and less able to evaporate. This stream continues by evolving into a major contributor of the vapor that ultimately ends up in the polar zone, as described in more detail in a previous letter.

Another selling point prescription viagra without of glass sex toys is their aesthetic appeal. It free viagra tablet offers effective treatment for hormonal imbalance. This is online prescription cialis so much a necessary medicine that this can bring up the level of focus. Sexual health campaigns are not always seen targeting the older purchase cheap levitra amerikabulteni.com adults; hence, it is important for an affected man to discuss his sexual dysfunction openly.

Now we can look at the temperature anomaly under the stream.  Of special note is the dark patch above the ocean water far from shore, which may be reaching +7-8 degrees, something that is most uncommon because of water’s high capability for quickly taking up heat from adjacent air.  

Next, we will look at the 500hPa air pressure map, where we see a darkening of the red zone due to upward pressure caused by the abnormally warm air directly below. This not an unusual development. Much the same sort of thing is happening in the North Pacific, another place where vapor stream activity has been intense for many days. It’s all easily observed in this same set of images.

An important jetstream pathway is invariably created within the red zone, located on a track that runs approximately along the line that separates light red from dark. We can see the wind results in this next image, in some places tending to merge with the outer edges of winds that form on the pathway that tracks the fringe of the green zone, adding to their combined speed in the process. This image is especially interesting because you can see how the re zone pathway breaks away and loops around the shape in the air pressure pattern that was caused by the tongue of precipitable water and its warming effect. It becomes weaker in the process, making it easier for the water vapor stream to move on as before and also broaden the approach it takes, with little loss of content, on its poleward journey.

As an interesting aside, the warm air anomaly in southeastern Canada can be attributed mostly to a complete absence of snow on the ground rather than anything having to do with water vapor.

Carl

Posted in Daily Climate Letters | Comments Off on Climate Letter #1809

Climate Letter #1808

Today I can’t resist the idea of loading up the letter with images and cutting the commentary.  It’s because I saw something interesting happening at the North Pole and then noticed the very same sequence developing at the other end, not far from the pole.  The North Pole has recorded a warming anomaly of a little over +20C for at least one day.  The source of all the extra heat can be explained and illustrated with considerable clarity for anyone who understands the regular connection between high-altitude air pressure configuration, jetstream location and behavior, the existence and behavior of equally high-level concentrated streams of water vapor, the way the two types of streams interact, and what can happen to surface air temperatures as a result of all that miles-high activity.  Four different maps, twice repeated, will tell almost the very same story with an uncanny degree of similarity.   In the south the peak anomaly is a few degrees less warm but the full size of its impact is quite similar. So here we go:

robertrobb.com commander cialis Shows Powerful anti-aging, even at the cellular level Contain vitamins B1, B2, B6.Uimitor also contain vitamin E, this vitamin is very rare finding in fruit. cialis wholesale india robertrobb.com Asparagus is rich in potassium, folic acid and fiber. It turned out the effect was negligible. super generic viagra was introduced in 2003 by Eli Lilly and ICOS. ED is very purchase generic levitra http://robertrobb.com/2020/03/ common and treatable.

A major jetstream wind pathway, the innermost of three such majors, always follows the track of the pale blue line in the air pressure configuration model:

A well-stocked vapor stream is here observed while being carried along the right side of the jet wind limb that is heading directly over the pole. The sharp bend in the wind pathway weakens the jet and allows the vapor to escape and then spread out. The pole itself is now underlying a total of about 8kg of precipitable water, probably more than four times its average for this day.

 The brightest red anomaly just to the right of the pole, backed by 10-11kg of vapor, looks like it may run as high as +23 to 24 degrees. That spot has reported maximum temperatures above freezing for the day while the pole had a high of -1C.

Now we head south and start over. The high-altitude air pressure pattern here, just the opposite of the trend in the north, has begun weakening due to the seasonal warming of temperatures at the surface below.

Jetstream winds following the light blue track now have a sharp bend of their own to negotiate, just like the one in the north, perhaps even tighter. These winds also all move east to west, which in this case is clockwise.

A massive vapor stream heading poleward has found an entry in the looping jetstream pathway. Use magnification to see how deeply it is pushing directly into the coldest parts of the polar zone.

The Antarctic as a whole is now reporting an anomaly of +1.2C, as opposed to the flat and negative numbers that have been common for months on end. This particular breakthrough by an intact vapor stream of high concentration is the primary reason. It may at least be signaling the start of a trend that will soon be more consistent.

Carl

Posted in Daily Climate Letters | Comments Off on Climate Letter #1808

Climate Letter #1807

Today’s letter, once again, will be turning attention away from the warming effect of water vapor while placing a more general focus on whatever may be cause of any particular warm anomaly.  There is a fine example waiting for us in the eastern half of Asia, where an exceptionally broad area is being warmed by 10C or more.  We’ll mainly be looking at everything within a wide circle that includes the Himalaya range in the south up to the coast of the Arctic Ocean.  One small area of very cold anomaly is noteworthy as an odd exception to everything else.

Most guys are conditioned to ejaculate fast in their early age, either to enjoy instant gratification or just out of fear of being caught when masturbating. http://secretworldchronicle.com/2017/04/ cheapest levitra He viagra online tries hard to overcome this condition with kamagra ED medications. To sum items up in a nutshell, ginseng is a magical herb that is known for its mild sedative effects. tadalafil canadian pharmacy The recreation response may decrease the physical effects for the human body. buy generic levitra secretworldchronicle.com

There is a map called Sea Ice / Snow Cover that I seldom display, maybe not ever before because of a special interest in the snow cover feature. It would be great to see what this map may have looked like on any average day at this time of year during the base period, some thirty years ago. I would wager that almost everything within the circle of high current warming would have had a much higher percentage of snow cover showing. When snow is missing that can only mean more solar energy is being absorbed by the ground and vegetation instead of just being reflected away in the original shortwave form of entry. By contrast, whatever amount of energy is absorbed wastes little time before being released, but has first been converted into the longwave form of radiation that the greenhouse gases can capture and briefly hold, giving a boost to air temperatures while doing so. The comparative results are reflected in the anomalies of today.

I think water vapor still accounts for a considerable amount of the warming in this region, which the next map will help us understand, but the missing snow cover could well be of rivaling importance—sorry, but I have no good way to calculate or closely estimate the actual relative numbers. This same map is useful for one more purpose, altogether outside of the snow and ice zones, because of the color coding it offers for showing elevation everywhere. This is a handy thing to have available when analyzing anomalies. Higher elevation, as everyone knows, consistently implies reduced air temperatures. It also means that fewer molecules of greenhouse gas with the ability to trap radiation will be available due to overall thinness in the air above—which goes a long way toward providing an explanation for the steady reduction of temperatures wherever elevation rises by a significant amount.

Now we’ll open today’s Precipitable Water map to see what it can tell us. Almost everything in the zone of warm anomaly is shaded in either gray or black, which is generally always true for the coolest parts of the planet. This mode of shading and the high leverage behind each of the low numbers creates complications for doing analysis when cool places are warming. As observed in Antarctica, for example, any PWat reading of “1kg” is almost useless because we need to know the number in grams. Fractions never count at any level, and on top of that when we do want to know an actual kg number we typically need to use magnification in order to pick out the right shade of gray, usually with difficulty. As for the small area that is very cold on today’s anomaly map, the one with an arrow shape, we can see in closeup that it has an actual reading of 1kg or less, compared with other readings in nearby areas ranging up to 4 or 5. That amount of relative dryness is a reality and by itself fully accounts for a temperature differential of more than 20C before checking on snow cover.

Carl

Posted in Daily Climate Letters | Comments Off on Climate Letter #1807

Climate Letter #1806

Today’s letter will forcus on the power of water vapor to affect air temperatures due to the properties it holds while serving as a greenhouse gas. Many observations have led me to believe that if all other factors affecting temperatures remain equal, then any change in the total volume of water vapor in the air overhead will cause changes in air temperature to occur in a regular way, based on a logarithmic scale. Results generally show that any doubling of water vapor content, no matter what the base number may be, will cause an increase of 10C degrees in air temperature. Of course Nature seldom allows all other factors to remain perfectly unchanged while water vapor and temperature comparisons are being made, but sometimes the differences are clearly limited or can be reasonably adjusted. Today we have such an opportunity, so we’ll start with the anomaly map for North America:

As the blood vessels and nerves cialis mg become stronger, men can achieve healthy erections during the time of intercourse. buy generic levitra http://amerikabulteni.com/2016/09/27/clinton-ve-trumpin-ilk-acik-oturumundan-notlar/ I want people to live a happy sexual life. Your SI joint, or sacroiliac joint, is found tadalafil generic 20mg in your pelvis. While this in itself isn’t a bad thing, but it might not be a good option for you Among the natural ways to amerikabulteni.com order cheap viagra treat this, daily basis physical exercise probably the best way to treat erectile dysfunction, as they are easy to consume and non-invasive.

Just by looking at the way the situation is set up in the 48 US states and much of Canada we can see that major temperature differences exist in many places that have exactly the same latitude and not too many differences in topography or other geographical features.  Will precipitable water provide the key to explaining this peculiar mix?

The reason behind the sharp divide between the eastern and western halves of the US is immediately apparent. For still more clarity I want to zero in on three specific locations having about the same latitude where we can easily match their anomaly readings to vapor volume readings and draw comparisons. The three I have chosen, using anomalies as the guide, are all Canadian. From the top map, they include the lukewarm anomaly in western Alberta, the cold one in southeastern Saskatchewan and the larger area in the east that displays maximum warming. The respective anomaly readings that I obtain are +2C, -10C and +18C. Moving over to the PWat map I get 12kg, 4kg and 27kg in correspondence. I’ll let you do the math, but all three are in the ballpark for realizing 10C per each double of kg. The best example, from 4 to 27 kg, implies two full doubles and nearly a third, realizing a measured temperature differential of 28C.

“All other factors” were by no means completely equal in these comparisons. In particular, the Alberta temperature was most likely penalized by a degree or two because of undergoing clouds and snowfall while the other two had clear skies.  The latitude of its anomaly area is also somewhat higher than the others.  This next map is helpful with respect to the former:

Carl

Posted in Daily Climate Letters | Comments Off on Climate Letter #1806

Climate Letter #1805

So much going on today I hardly know where to start.  The warm anomaly over the Arctic Ocean that never goes away is certainly worth another update.  It has become more and more clear to me that a large share of this anomaly is being caused by a lack of sea ice in places that most likely were fully iced over, at this time of year, during the 1979-2000 baseline period. There is more evidence behind this argument to look at, and some other things to think about too. We’ll start with an anomaly view from the Asian side:

If the gland is inflamed, it cannot function order cialis well thus causing infections, STDS and other injuries Peripheral neuropathy- nerves could be injured or malfunctioning. Erectile dysfunction- an inability to reach an erection is the problem cialis sales uk http://cute-n-tiny.com/tag/dog/page/13/ of erectile dysfunction. Has ringing in the ear taken over your life, and ruined it? I really believe you’re still searching for a ray viagra sildenafil of hope to lead you out of this. But the sacrifice is worth it if it http://cute-n-tiny.com/tag/video/page/4/ levitra side effects saves your time as well as energy.

The major anomaly in central Russia, a bit more than +20C, is certainly important but since there is no sea ice involved my comments will have to wait. I want first to focus on the Sea Ice map so we can match some things up with the equally large temperature anomaly directly above the Russian one:

Notice the broad stretch of open water north of Scandinavia.  It is largely made up of three seas, Norwegian, Barents and Kara.  If you match this entire unfrozen area with the anomaly map (it helps to magnify the images) you will see that the southern part of the ice-free area shows zero to fairly cool anomalies while most of the remainder to the north runs from +5 to at least +9.  I don’t have any ice records handy but would wager that this northern part was pretty well iced up by early November in the past.  My letter #1803 last Thursday dealt with a similar situation on the other side of the ocean, using a different approach, and saw the same type of effect.  As a consequence, whenever we see an area of perhaps unusually ice-free water we should watch for a large amount of extra warming to appear, and any such warming effect must then be treated as something having its own separate source of attribution, even if the details are uncertain.  Now we can open today’s Precipitable Water map:

What I see here does not look very helpful in the ice-free zone but the swirl of high vapor content moving over the ocean ice looks strong enough to do some real warming.  All it takes at this time is 3-4kg to get the big anomaly readings we see. Now I want to point out something else.  When you combine the warm anomalies attributed to open water with those attributed to inputs of overhead water vapor into a compact mass they may actually be feeding off of each other. They could do this by creating enough total warming to have a significant impact on the structure of air pressure configuration over the area being warmed.  Remember how warm air always expands, causing an upward push against the downward pressures of gravity created by the air higher up.  Take a look at this map:

Notice the small circular spot right in the middle of the blue zone.  I don’t think it would be there if the air below it were as cold as normal. More broadly, large warm anomalies elsewhere are eating away at the outer edges of the blue zone, causing those big lobe-shaped appearances to form.  The result, both inside and out, governs the positioning and strength of jetstream winds, the very same winds that exercise so much day-by-day control over the movement of high-altitude vapor streams.  And they are losing some of the control they would normally have.  Today’s vapor streams are massive, especially in the Northern Hemisphere, and their vapor content is gaining a growing amount of access to various parts of the far north.  In this final map we can see a jetstream wind that has visibly guided the flow of a vapor stream in an arc across Europe (as seen on the PWat map), then made turns that ended with a dumping off of its contents into the area of central Russia now having the +20 anomaly.

Carl

Posted in Daily Climate Letters | Comments Off on Climate Letter #1805

Climate Letter #1804

The weather maps have some disturbing information today that prompts us to take a look at the “big picture” to see what may be going on.  What’s most disturbing is the way the Northern Hemisphere as a whole keeps pushing higher and higher with reports of daily air temperature anomalies.  All of a sudden the number has popped up to +1.6C, and that’s not from a long pre-industrial baseline. This base is on average only three decades old, 1979-2000.  The familiar line graphs of running temperatures for the entire globe all show a steadily rising trend of about 0.18C per decade over this period, giving a 30-year total of just over 0.5C.  The global number you see below the map is all the way up to 0.8C for this one day, and it would be even higher were not the Southern Hemisphere doing the world a big favor with minus-0.1, just as they have been reporting for the past several months.  The north has really gone crazy, and we need to investigate.

Warm and cold anomalies often have a way of balancing out, but not yesterday.  Almost all of the land area in the eastern half of the NH was warm, and there was not a bit of cool in the US lower 48. As we’ll see on the next map, this was actually a pretty big day for all the streams of water vapor that keep flying over our heads. They are easy to spot from color shading alone, most decisively covering a broad area that stretches from equator to pole in the east.  Anything having a brown tone will now hold enough vapor to produce a warm anomaly in the NH, and so will the lighter grays in regions where much of the land is elevated, as in large parts of Asia and the western US, or in the far north.  Most of Canada is too dark a gray, meaning too dry, and thus too cold.

It has been also said that it is a similar working india viagra medicine if you are allergic to Tadalafil. If the sphincter of Oddi were a celebrity, it would be on Hollywood’s A-list; it affects free tadalafil sample multiple, vital organs in the body. When I married my wife in 2003 I was in my sixties and my wife was only cheap viagra in her twenties. There are several medicines cialis buy online which are preferred to be used by patients who have sex problems or by those who can’t spend heavy amounts on medication.

When studying this map, I can see that a large amount of vapor over the US probably evaporated from ocean waters close to Japan. Likewise, a large share of the vapor over Europe and western Asia originated from waters surrounding the Caribbean Sea and central/north Atlantic. There is almost no limit to how far these streaming batches can travel, up to maybe 10,000 miles, often with the help of fast-moving jetstream winds. Now for a big question: Is there any reason to believe that more vapor than before is now being created and delivered in this way—perhaps even quite a bit more? I think so, at least in the Northern Hemisphere. For one thing, surface water temperatures as a whole are rapidly increasing in this hemisphere, as you can see on this next map, thanks in good part to the steady work being done year after year by CO2, methane and all the other well-mixed greenhouse gases that keep increasing year after year because of human activity. The warmer water created and stored away by their energy is most certainly conducive to higher levels of evaporation. (The SH seas are notably not warming like those in the north, nor is the Equatorial Pacific, for a wholly different set of reasons.)

There is one more piece to this story that I think is critically important. High-altitude vapor streams are only created from surfaces that have reached a certain temperature, which is around 25C. Without an assist from this much energy the new vapors would not be able to ascend the full three to four miles required for reaching the level of the atmosphere where jetstream winds are blowing. The water temperature anomalies revealed on the map above, ranging up to three degrees and possibly more in spots, have served to expand the size of the “warm pool” of surface waters having temperatures at and above the 25C minimum. The areas of expansion are all located beneath the hemispheric “umbrella” of jetstream occupation, and they are also a little closer to the landmasses that surviving vapors are destined to fly over. It is not difficult to pinpoint where warm pool advances have been made in the past thirty years, and we can also see the way naturally effective vapor streams are now forming with regularity along these newly extended outer borders of the warm pool.

Carl

Posted in Daily Climate Letters | Comments Off on Climate Letter #1804

Climate Letter #1803

The focus today will be on the Arctic Ocean, using close-up views having more than the usual amount of detail. This requires a bit of extra time and effort to check out, but there is good information to be gained on several fronts. A close-up view means first magnifying these images all the way up to 170% or more and then putting your eyes around 8-10 inches away from the screen. This will improve all the measurements made from color coding and further helps to define exact locations. The Temperature Anomaly and Precipitable Water maps have the greatest overall interest from a detail standpoint, while Sea Ice Extent and Average Air Temperature are currently high on the list due to some special circumstances. I have gained a better appreciation for the way delayed sea ice formation is now affecting air temperatures in this region, making the delay a greater than realized contributor to the high anomalies we keep seeing. As a result we need to make a better separation between this contribution and the one due to unusual inputs of high-altitude water vapor. Getting it right will always be a challenge if we don’t know exactly what the ice coverage was like at this date three decades ago, but we can be sure it was already much more advanced away from summer lows than it is today.

Some herbal remedies help the body by creating more bile, flushing the body of toxins, viagra samples for sale Source reducing pains and spasms, and lessening abdominal gas and bloating. A recommended dose of 25mg for older adults and 50 mg for adults with good health and age is considered as 50mg review india online viagra is recommended for normal healthy skin. Also only one http://icks.org/n/data/ijks/2019-1.pdf price levitra pill has to be taken in 24 hours. sildenafil rx The Gingerol compound in the Ginger is said to have the suggested quantity of the blue pill did by improving blood flow in the penile region and causing hard and stiff erection for intercourse.

Look closely at the anomaly pattern that circles the ocean shore in a fairly narrow band from Alaska to the Laptev Sea, then widens as it crosses more open water while heading downward toward Greenland.  Notice how most of the warmest parts make a good fit with the corresponding open water that we see on this next chart:

What we want to know next is the actual existing difference in air temperatures over ice-covered and ice-free areas that are in close proximity but not quite touching. That difference will presumably disappear once all the new ice has formed, as it probably had already formed at this date throughout the baseline period. A quick way to check out the temperatures will be to simply look at this next map and give it plenty of magnification:

What I see, by getting up close, is average air temperatures around minus-4 or so in the ice-free places that were most likely to have been frozen by this time in the early period, bordered by a line visibly marked at -10, and then a quick jump to measures ranging from -15 to -20 and higher.  Similar numbers can be found on the Windy website, with practice, except on that map they are always current rather than daily averages.  The main point is that warm anomalies ranging from 10 to possibly as much as 15 degrees are most likely now being activated in certain particular spots that have been slow to freeze over this year.  The immediate impact from water vapor excesses would still have some responsibility for the daily anomalies that are reported, but just not as much as we may have once thought. I believe the extra vapor inputs remain the dominating factor of warming for all areas that are iced up.

The Precipitable Water map for today has ample evidence of continuing vapor penetration causing warm anomalies, with the strongest inputs seen coming from the direction of Scandinavia. Viewing with magnification parses out many little details, and there is one detail in particular I want to point out today just because of its very small size. Back on the first map you can see a tiny white spot in the middle of the ocean, signifying normal air that must be very cold—the temperature map shows it at about -22. On the PWat map you can see this little spot just as clearly, with a lowly reading that appears to be only 1kg. There is a similar situation close to the north shore of Greenland.

Carl

Posted in Daily Climate Letters | Comments Off on Climate Letter #1803