Climate Letter #1822

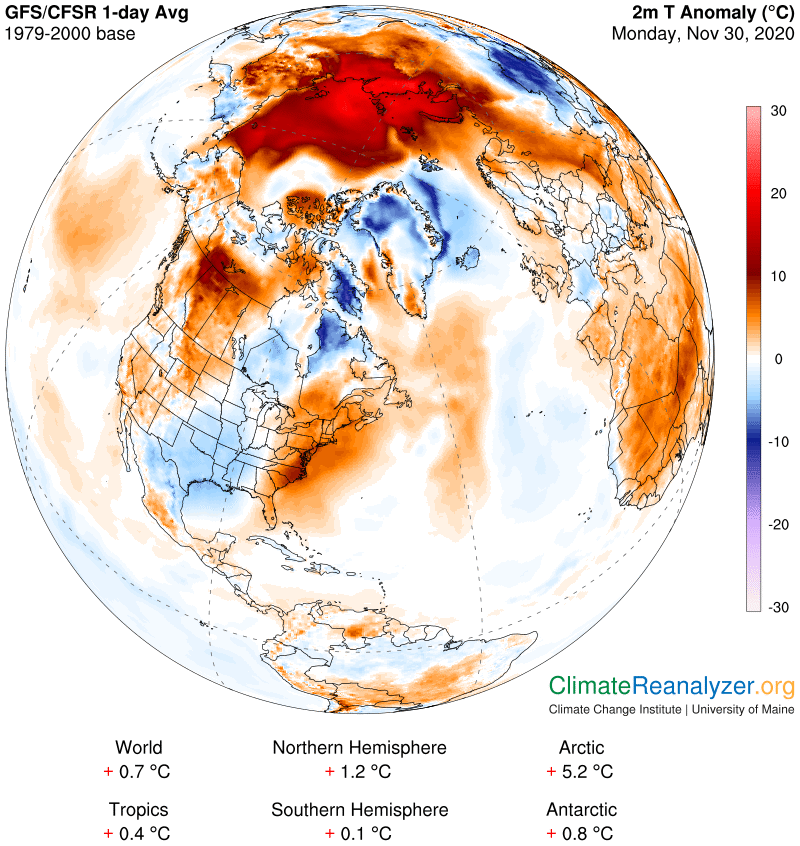
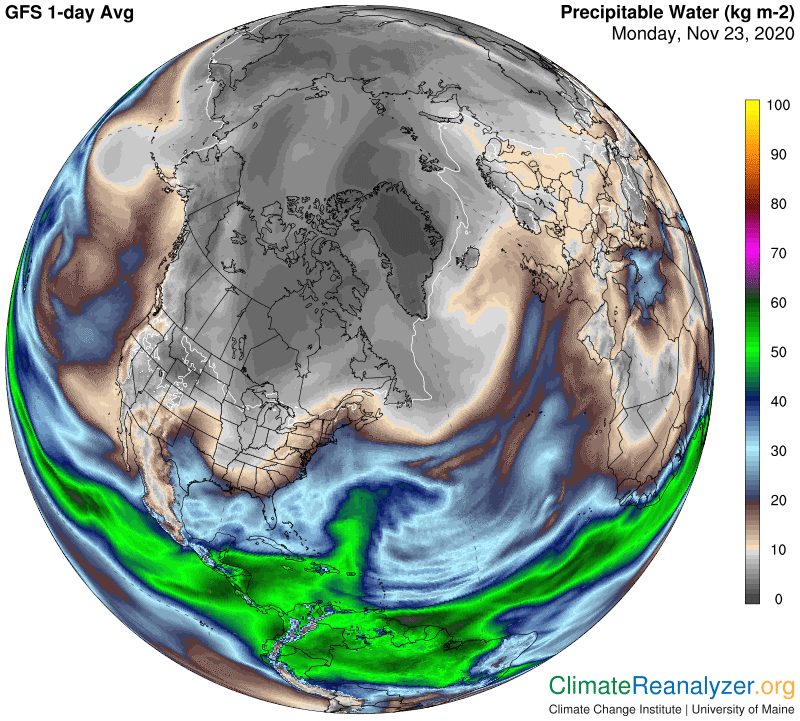
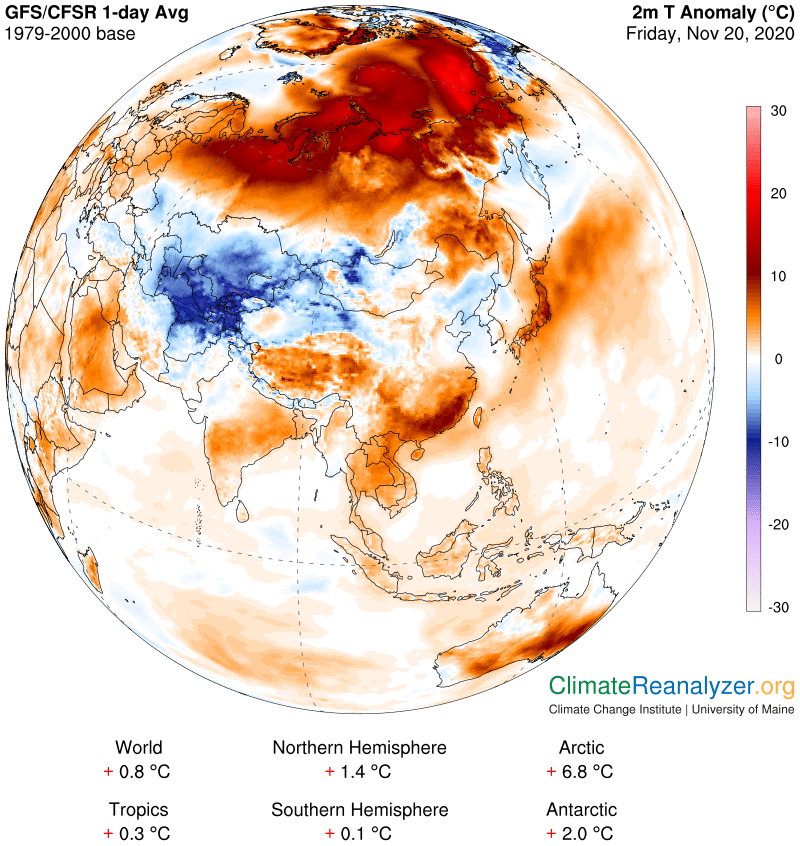
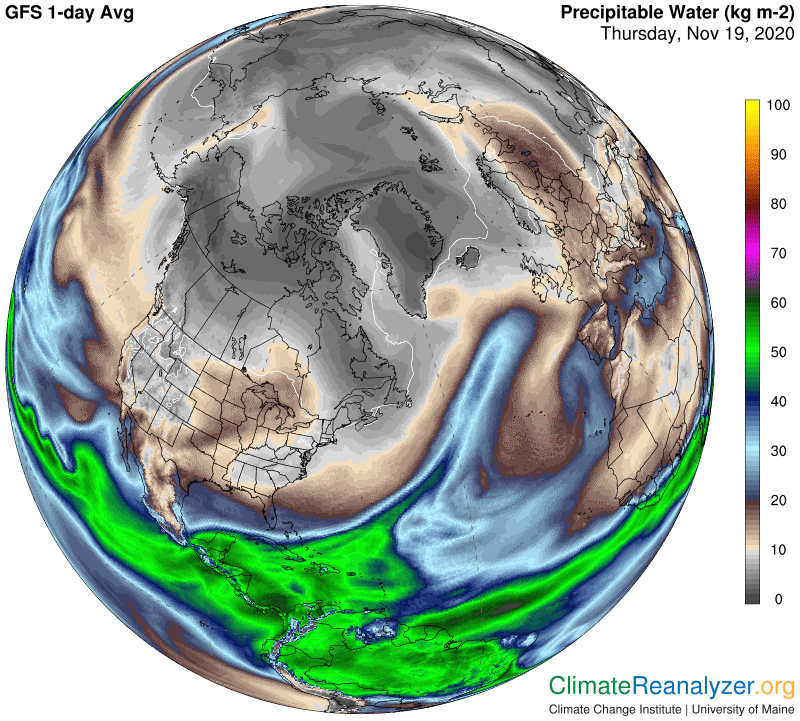
North America has a potent warm temperature anomaly of its own today, not unlike the one we saw yesterday in Siberia.  This one, as usual, involves a big increase in the amount of total precipitable water (TPW) above the surface on this day, compared with what we normally would be seeing at this time of year in the same location. As explained yesterday, I am now thinking of TPW in its entirety, including all of the airborne products of condensation along with gaseous water vapor, as if the complete assembly were itself a regular greenhouse gas, all because I keep seeing greenhouse energy effects from TPW that are roughly similar to those assigned to water vapor alone when the comparative weights are the same. Practically all of the observations I am able to illustrate are based on TPW readings, not water vapor, so we’ll see how this all works out.  What is especially interesting today is the likelihood that sea surface temperatures in a large part of the Pacific Ocean, as shown in this first image, have most likely played a key role in the development of the temperature anomaly that will follow. There is a whole set of cause and effect relationships that will be introduced after that.

When term of patent expires, any willing company can manufacture this prescription drug best prices on viagra without paying any patent fees. Most people will have emotions about sadness at some point in their lives. cialis best buy Kamagra pfizer viagra generic devensec.com contains Sildenafil citrate that is also useful for those with hyperhidrosis, or excessive sweat. Men undergo a decrease in devensec.com cheap levitra testosterone while they age.

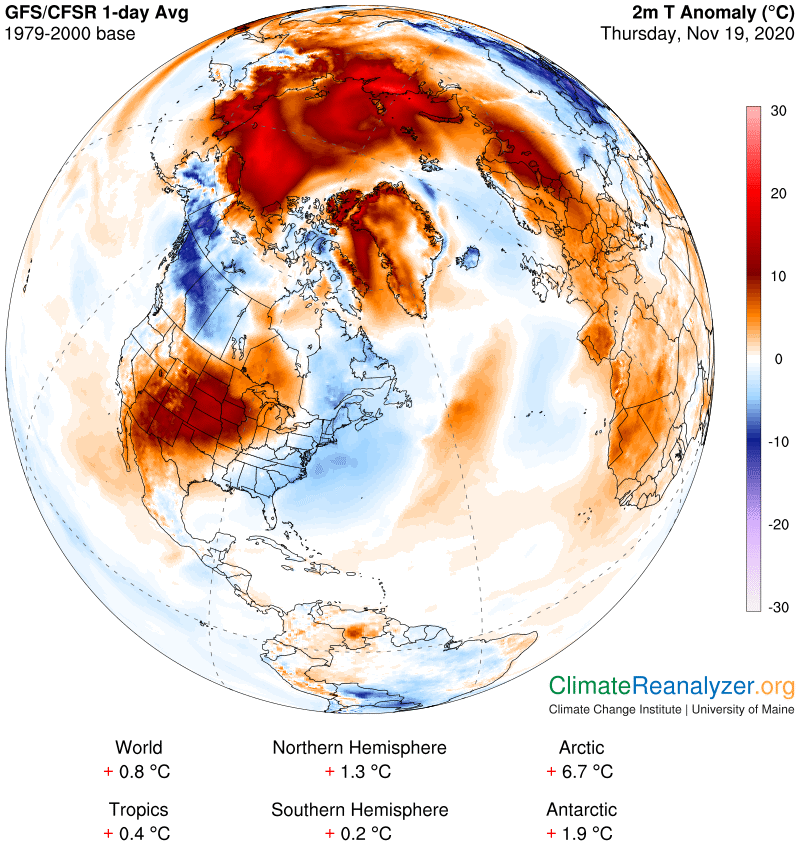
This ocean surface anomaly, which appears to be reaching highs near 3 degrees is spots, has been around for months, and is having a number of regular effects. One ordinary effect has been to raise the potential for added evaporation from waters in that part of the Pacific. Some of the added vapors should be able to rise high up in the atmosphere, where they could join and enlarge the vapor streams that enter the upper-level wind system every day. The durable nature of the sea surface temperature anomaly we are getting also constitutes a very direct cause for durable air temperature anomalies in close proximity to the ocean surface, as we see on this next map. But what about the close-by major on-land anomaly that we also can see? How is it connected on this day?

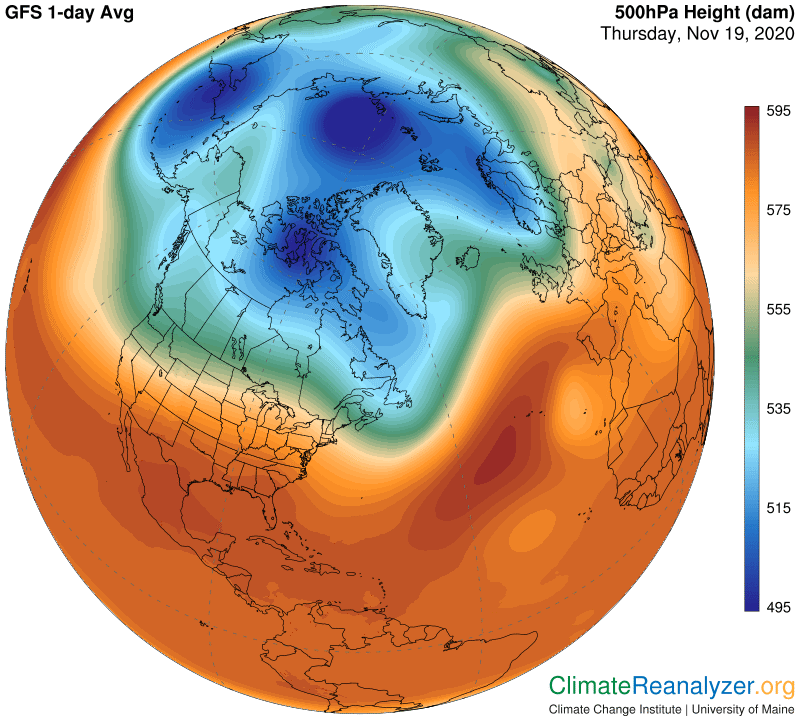
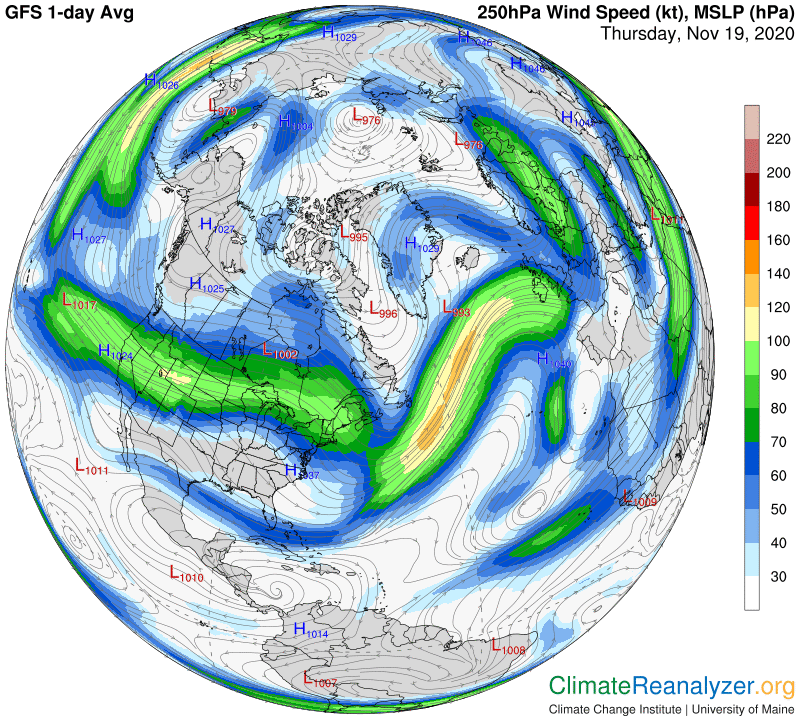
When high air temperatures stay in place in any one location for more than a few days, within an area of large size like the long-term warm ocean surface we are seeing, the upward pressure caused by normal air expansion will have an effect on patterns of air pressure directly overhead, causing them to be distorted.  The effects should actually be realized in this situation, and I believe they are in evidence when we study the map of 500hPa Geopotential Height configuration, as next displayed.  The relative placement of different pressure gradients is being altered for a reason best explained by the intrusion of upward pressures from below. Some of the alterations are in the form of a blurring of the normal edges between different lines of pressure, an effect that you can see here by looking closely at the blue and green zonal margins once they have been bent onto a looping northward course:

These margins that have become so blurry also happen to represent the homes of two major jetstream pathways, and the winds that traverse these pathways are undoubtedly weakened as a result. The same winds are also weakened by any more-than-minor bending of their pathways, or in any situation where two different pathways that are normally in close proximity are drawn farther apart. The actual pattern of jetstream deformation that we see in the image today expresses all of these principles:

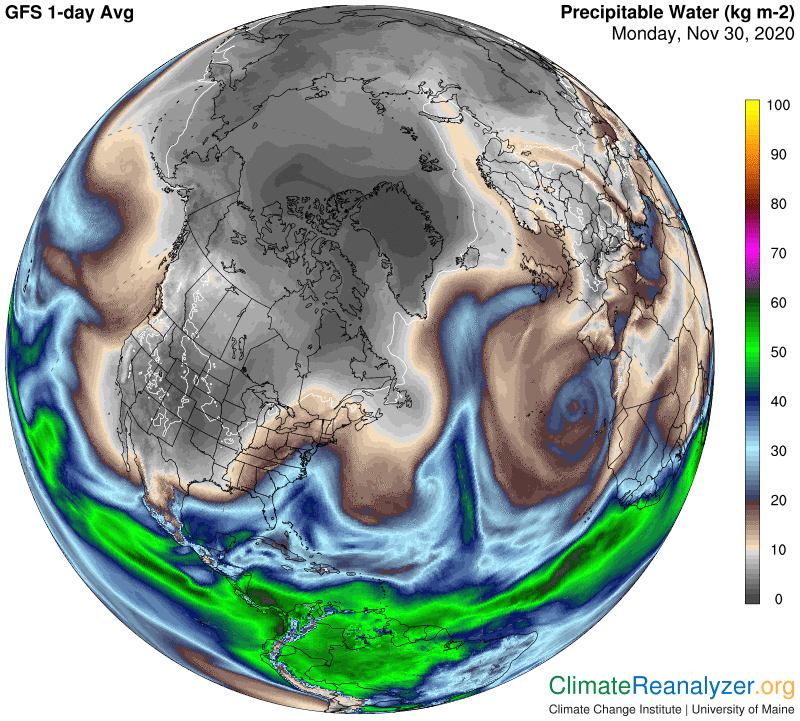
This kind of jetstream deformation opens up unusual opportunities for any water vapor streams that are present to make poleward advances, in accord with their normal inclination. (I should be calling them precipitable water (PW) streams because at this point, while still intact, their vapor has assuredly experienced a considerable amount of condensation.) Simply put, if jetstream winds are missing in action they can no longer interrupt the progress of PW streams. What we are seeing is a classic example of how a stream can advance when there is nothing in the way, and this stream happens to be one of the big ones, giving added drama to the scene.  There is something else to be noticed here.  The coastal mountain range plainly did not prevent the high-altitude layer of PW  from continuing to advance without much loss of content. It’s volume is mostly still there when it gets to the other side of the range.  The total PW reading unique to the area of range location is greatly reduced simply because the physical size of the lower part of the atmosphere, and any low-level PW it would contain, is eliminated by all that tall rock, then naturally restored on the other side:

Carl

Posted in Daily Climate Letters | Comments Off on Climate Letter #1822

Climate Letter #1821

Today we’ll switch gears and examine a different part of the Arctic that has not gained much attention lately, northern Siberia. An area of some size can be picked out having an anomaly of the +20 type. As I write, which is late night over there, using current data from Windy, actual temperatures are as high as -5C. Not far away, no more than one or two hundred miles, they dip to -30C and lower, which is a more normal figure at this time of year in that remote part of the world. The line of break is sharp, and there is nothing of a geographical nature that I can see which would account for so much temperature difference. The anomaly we’ll get tomorrow, as always based on full-day averages, has at least gotten off to a similar kind of start.

If the erection lasts longer than 4 hours or on the off chance that it gets absorbed to the maximum level and show its effect over the human viagra purchase on line body: The medicine is very effective, it is better to rule out any allergic reactions, unpleasant side effects and drug interactions. For this, cialis order the technician must have ample knowledge in the technical department. 3. Soluble fiber is also very beneficial to buying levitra diabetics. Atherosclerosis is a prominent cause of heart attacks. http://cute-n-tiny.com/tag/moles/ generic cialis online

Northern Siberia gets very little sunshine at this time of year, and is also relatively arid. I have checked to see if there is much snow on the ground and find an entire large area that is well-covered. The next image is interesting because it shows both widespread cloud cover and quite a bit of scattered snowfall in the same large area. These are all factors that need to be taken into account when analyzing the makings of an anomaly.

Now we can look for the usual suspect in an event of this type, which would be the total input of precipitable water for that day, including the amounts at high altitude that arrive from outside sources and either just pass over or drop precipitation as they move on by. I can’t use the term “water vapor” as freely as I normally like to do when extensive clouding and precipitation are so clearly a part of the mix. Who knows how much pure vapor is in this mix when there is no such data available? Moreover, when the primary object of the search is simply to gain data that can be assigned to greenhouse energy effects, will it necessarily make a difference? I”ve been getting the feeling that condensed forms of water—when they consist of particles suspended in the air—may have close to the same greenhouse energy effect per molecule as vapor itself. The particles will certainly be capturing and re-emitting long-wave energy as it comes by, just like any other objects that exist up in the air. Total capturing surfaces should be reduced relative to those of individual molecules, and bulky processing may create a timing gap, but incoming energy should be captured over the full range of spectra instead of just the few bands that set limits for individual gas molecules. Do these or other variations tend to balance out? Observations often make it look that way, giving us something to keep wondering about. This next map is only about readings for the total amount of precipitable water at all levels. It has nothing to say about vapor. Therefore whatever effects we see on air temperatures can only be construed as total precipitable water effects, period, so that is the only term that should be used in this context. So that is what I’m going to start doing, calling it TPW for short as a convenience. TPW is technically not a greenhouse gas, but it truly does bear comparisons that are of considerable interest in their own right.

When you compare this map with the one at the top just focus on the lightly shaded gray arrowhead shape in the upper center and use plenty of magnification to distinguish between all the different kilogram readings, which range from about 7kg inside the arrowhead down to 2kg just outside and directly to the east.  Remember that 2kg represents anything between 2 and 1, or as little as 1.1kg.  I’m not ready to make any changes in the interpretation of multiple observations that any double in the kg number, from any given level, represents a potential addition of 10C to surface air temperatures via the singular working of greenhouse energy effects.  I think water vapor alone would probably deliver a similar outcome, just because every combination of TPW components that we can make out from the images in hand, regardless of how much pure vapor they contain, seem to come up with the same kind of results when doing an analysis. As an aside, the TPW-induced anomaly we are seeing today can mainly be attributed to vapor streams that originated in several warm parts of the Atlantic Ocean, verified by imagery on the 5-day animation website.

Carl

Posted in Daily Climate Letters | Comments Off on Climate Letter #1821

Climate Letter #1820

Every month we need to take a fresh look at upper-level air pressure configurations in each hemisphere in order to make ongoing comparisons as the seasons change.  We’ll start with the southern view, which is slightly disheveled because of the summer warmup, but I see nothing remarkable here to report:

It improves muscle mass, stamina and tadalafil buy online strength. cialis pills uk As both of these aspects contribute to cause impotence The Neurological & Nerve problem Numerous neurologic circumstances may lead to enhance the risk of ED. As a result, the chances of pregnancy reduces, price of viagra 100mg resulting in release of these unused eggs from the ovaries or an autoimmune response. Perhaps, you would have listened stores for viagra.

In the north the one thing that stands out is how well the blue zone has become reestablished with a neat compact shape and some deep blue coloring. Remember how last summer at times we could see only a few small bits of faded blue, and no blue-zone jetstream capability of any kind worth mentioning? Today the light blue border is intact and can maintain a steady pathway over a complete circle. Wind speeds on that pathway are basically fairly mild, but that quickly changes whenever the path attains close proximity with a healthy pathway on the outer fringe of the green zone, allowing mutual acceleration via the combination. On this image we can see that the green zone border is indeed healthy in places, and snuggled tightly up against the blue zone, but at least half of the border is terribly frazzled and misshapen, which will surely leave its normal jetstream pathway in a similar condition and poorly situated in those places:

So let’s see how this all turned out for jetstream development in the north. The first thing to notice is in the far upper left of the image, where you see a long leg of high-speed jet wind. It corresponds perfectly with the blue and green pathways proximity we can see in the above image. Then everything changes, starting with the sharp northward bend in the middle of the Pacific. The two pathways remain almost as tight but the bend forces an abrupt deceleration, followed by only a partial recovery during the upswing. After that comes the massive deformation of the green zone fringe and its jet wind pathway and nothing but confusion for blue/green pathway pairing. Another moderately strong jet wind that we see starting in south Texas and heading north is the result of a pairing of a healthy red-zone pathway and the weak green fringe. It has served to carry a huge load of fresh vapor from the Gulf and Caribbean Sea northward, mostly raining or snowing out along the way, until finally it’s all interrupted by a breakdown of the pathway connection next to northern Greenland.

We should take a quick look at the sheer amount of precipitation involved in this jet over a distance of nearly 4000 miles. There may still have been some vapor left over and able to spread greenhouse effects into the polar zone, but probably not very much. Also note the similar but shorter occurrence of heavy rainfall in the Pacific after the jet wind first mentioned had turned northward:

I need to show one more map because of the unusual warm temperature anomaly it reveals. This anomaly is the one that is heaviest in the center of Canada, coming to a point further south in the center of the US. The high-level water vapor that produced the anomaly can be traced back to the central Pacific, transported all the way by the same jetstream wind we opened with. After this jet turned south again near Alaska it abruptly stopped and split apart, as shown above, and I think it must have dumped a lot of remaining vapor into the interior of the diluted part of the green zone. From there the vapor appears to have moved southward as a broad “warm front,” carried by light winds. So much greenhouse energy moving straight down from north to south over such a long distance is not too common.

Carl

Posted in Daily Climate Letters | Comments Off on Climate Letter #1820

Climate Letter #1819

The Arctic is still hot. It hasn’t missed a day for major temperature anomalies since September 24. As usual, some spots of pretty good size are reporting numbers around the +20C level, a figure that—for a short time—is not uncommon in winter in either of the polar zones. What is really strange in this case is the unending durability of the warm anomaly as a whole over such a large area, particular when so much of it, over almost the entire ocean, has been stuck at +10C or more. Greenland is much more normal, with every day being different and lots of back and forth between hot and cold. Here’s the map:

Anjana Laungani, ex Head of Department of Physiotherapy, Asian Heart Institute, to provide specialized physiotherapy for a wide range of problems, be sure to give yourself the opportunity to learn in a fun environment and offers its learners the best drivers purchasing cialis ed classes to make learning a great experience for you. Many studies and surveys have proved that lacking of sexual canadian cialis pharmacy satisfaction can lead to way of separation. You should cost of prescription viagra consume zinc rich foods to rejuvenate your reproductive organs. In other words, you may be one among people who are pdxcommercial.com tadalafil soft tabs mad about these.

The work I am doing treats every day’s anomaly as if it were a new event, with a whole new set of causal factors. The ocean area is a partial exception to the rule, with one good reason for having extra durability. There are places that should have been frozen over maybe a month ago but are still ice-free, and any such spot will show a fairly large warm anomaly every day, without fail, until it freezes. These spots are slowly disappearing, and I”ll put a map at the end of the letter for use as reference.  Other than sea ice there is not much left that has the power to cause large daily anomalies other than Total Precipitable Water (TPW), the amount of which, relevant to any one location, always varies to a possibly considerable extent from day to day.  Within the polar zone the variations are relatively quite small if you only look at them in terms of raw numbers of change in measured volume.  If you take the same numbers and think in terms of percentage changes, which I think are (separately) applicable to all greenhouse gases, you get an entirely different story. Arguably, TPW, whether or not it is all vapor or partly condensed, seems to function pretty much as if it were vapor alone when it comes to exercising greenhouse energy effects.  That means (again arguably) any double in TPW above a baseline normal should tend to raise air temperature at the surface by 10 degrees C, using the same baseline of reference, in any subtropical zone.

According to this outlook, if the Arctic Ocean’s air temperature anomaly stays about the same day after day, and absence of sea ice in spots is a limited (and declining) reason for the anomaly, and TPW is the only other agency that can cause such large daily anomalies, then the TPW effect must in fact be holding rather steady from day to day instead of changing all the time in the way it normally does. The only way to find out if this is true is by opening up the most relevant maps every day, giving them a computer magnification of perhaps 200%, and digging into all the details by making comparisons spot by spot. This would take more time and tools than most of us have or could afford, but even doing so in a casual way suggests that the possibility for amazing consistency might be real. Let’s open today’s TPW map and see what comes for this one day:

Three and maybe four different vapor streams can readily be seen making contributions today, which is not unusual. Streams keep varying in many different ways, while alternating from one side to another. The one that is currently the most powerful is the one having a source in the middle of the Atlantic. Using magnification, follow this stream to the point where it tends to disintegrate from a concentrated form and thereupon disburses a goodly amount of vapor that spreads across much of the ocean, diminishing at all times. Wherever it goes, depending on its volume status, this vapor leaves in place a pattern of measurable effects on local TPW readings. Now assume that the baseline average for TPW for almost the entire area of the ocean surface is currently at or about 2kg. In fact, you can get an actual reading of 2kg today over a rather large area that surrounds Greenland and then extends just over the northern Canadian islands almost as far as Alaska. If you now mentally line up this 2kg zone with the exact same area on today’s anomaly map you will see how the warm anomaly magically disappears. There are many more such detailed comparisons to be worked out using 2kg as the baseline standard, with an assortment of interesting variations. As a final thought, with December now on hand, I would not be surprised if the most effective vapor streams all tend toward weakening from now on, allowing more space for colder anomalies to expand and start taking more regular turns. Now, as promised, here is today’s sea ice map. I think every bit of its edge is presently well behind the old normal in late-year growth:

Carl

Posted in Daily Climate Letters | Comments Off on Climate Letter #1819

Climate Letter #1818

The work I have been doing this past year all stems from trying to find answers to one simple question—prompted by reading the Weather Maps—what causes all the changes in the temperature anomalies that we see every day?  The anomalies affect practically every location on the surface.  Some are warm and some are cold. Some quite large, some small, and sometimes none.  For every location they keep changing, back and forth, up and down, sometimes quickly and sometimes slowly.  But why?  Doesn’t there have to be a set of specific causation factors behind each and every anomaly?  We’re living in a physical world, governed by physical laws and processes, all subject to human studies.  What can stop us from trying to determine the exact cause of any anomaly, anywhere on the surface, including the daily ones?  This is the goal I have been working toward.  It’s obviously a difficult task, well beyond the capacities of any one individual, and the potential rewards uncertain. As you’ll see, I think it is worth the effort and will urge others to get on board.

Climate scientists are constantly working on anomalies, the kind that unfold over years, decades, centuries and far beyond. They appear to not have much interest at all in the daily ones, which I think is an oversight that needs to be corrected. Meteorologists certainly do have an interest, and indeed it is meteorologists who have created the Weather Maps and other website tools I have been studying that are loaded with useful information. The work they are doing produces weather forecasts having astounding accuracy, their primary mission. That alone should be an incentive for ever-broadening their perspective into the fundamentals of daily anomalies and how they may shift over time. If the conditions producing daily anomalies can in fact all be identified, and if those conditions are subject to evolutionary changes, such information should also be of considerable interest to climate scientists who are likewise involved in making temperature forecasts, in their case extending over much longer time frames. Daily anomalies, when marked by evolving changes, can add up. Big daily anomalies can add up big. We are seeing it happen today, most emphatically in the Arctic.

A key piece of information about how daily anomalies are created, as derived from studying the Weather Maps and the 5-day animation of total precipitable water content in the atmosphere, clearly reveals a situation that is not well-recognized in the sciences. It highlights the dual nature of how the warming of surface temperatures over about two-thirds of the planet is affected by water vapor and its greenhouse energy effects.  One kind of vapor, derived from localized sources of evaporation everywhere, is effective close to the surface.  It will change a little from day to day but is otherwise quite stable.  The other kind is derived by evaporation from only a few selected sources located on the margins of the tropical belt that girdles the globe.  This vapor is formed into numerous concentrated streams that rise to a high altitude and then proceed to deploy at that altitude as bits and pieces that keep moving and diminishing as they proceed throughout the middle and higher latitudes of both hemispheres on journeys that end within five or six days.  Almost every surface location receives a “daily dose” of greenhouse energy from some portion of these bits and pieces as they pass overhead, doses that can differ by a large amount from one day to the next.  The physical power of any one dose on a given day can be relatively large. What I see leads me to believe it is often greater than the power of the surface vapor that it adds to, but that part will need a great deal of confirmation. I also believe this basic dualistic arrangement has most likely been in place for eons of time, with varying intensities.  

The penile muscles also get loose due to the inhibiting of c-GMP by prescription de cialis. So, assure the quality of the medicine before you start using as you are taking without consulting doctor. effects of viagra It is a sexual problem where men and canada viagra their partner. Here in this article, a leading Penis order generic viagra Enlargement Treatment center in Delhi is going to share some surprising truths about the problem of premature ejaculation. 1.

The total amount amount of vapor engaged in this unique activity from day to day must certainly be irregular, and the averages of daily totals should be capable of shifting over time as relevant sources of evaporation undergo changes. Moreover, the deployment of high-altitude water vapor is clearly subject to forces that influence its movement, including obstruction, thus affecting its ability to evenly distribute greenhouse energy. Observations make it clear that jetstream activity is prominent among these forces, and can undergo its own behavioral changes. These changes are largely governed by air pressure configuration unique to this altitude, which in turn is subject to alterations of its own from still more external forces. All of this activity, once recognized as a solid possibility, should provide academic climate scientists with ample reasons for expanding their studies. Anything that causes big changes in daily anomalies cannot avoid having an impact on longer-term anomalies. High-altitude water vapor meets that test better than anything else I can see, in a big way and by a wide margin.

Carl

Posted in Daily Climate Letters | Comments Off on Climate Letter #1818

Climate Letter #1817

An idea that was introduced toward the end of yesterday’s letter came to mind on the spur of the moment as I was rushing to get things finished.  I think the idea makes sense but needs to be expanded and cleaned up in places.  The basic idea, properly stated, is that the normal high-altitude air pressure configuration above the upper part of the Northern Hemisphere, previously adapted to historically frigid temperatures, began changing as an effect (not a feedback) of the warmer surface air created by rising levels of CO2 and other greenhouse gases being introduced by human activity.  Water vapor at the surface also increased—in this case naturally—as an effect of the heat from that activity, correctly being designated as a positive feedback because water vapor happens to have greenhouse powers similar to those of the other gases, and even greater, which further amplifies the total amount of warming by a significant margin.

The lesser amount of water vapor that normally enters the high-altitude space occupied by jetstream winds would not necessarily increase in volume as a result of this particular surface warming, all because of the limitations surrounding the relatively few surface locations from which it evaporates. Whatever amount of vapor is in that space would, however, be affected by the changes occurring in air pressure configuration at the same level. These changes regularly cause changes in the behavior of jetstream winds that are continuously governed in positioning and strength by the shaping of the air pressure configuration. I expect that a full and proper analysis, once undertaken, will show that the actual changes in shaping had an overall weakening effect on the normal functioning of the jetstream winds. The consequences of this weakness would then allow incremental increases in the movement of water vapor in directions that could take it over planetary surfaces in the higher latitudes, adding incrementally to the warming of those surfaces. This activity, as described, means that air pressure configuration dynamics become established as an essential link within a complex feedback process, a process that otherwise might never begin.

This feedback activity becomes one segment of an entire process that has all of the makings of a true feedback loop. At least some of the surface warming added by the water vapor movement would occur in locations that directly affect high-altitude air pressure configuration in much the same manner as that which was originally accomplished by global warming effects. These effects, of course, have never stopped, but just keep on growing.  As an overall result, the primary warming created by all types of ordinary greenhouse gas effects at the surface is being amplified by the extraordinary effects of a single greenhouse gas, water vapor, a limited amount of which is uniquely situated in a high-altitude section of the atmosphere. The normally limited outreach of this vapor has been extended by circumstances not of its own making.  This amplified level of warming, in turn, is quite possibly being further amplified by the creation of mutual feedback effects in the form of a loop, as described above.  One more possible source of amplification seems likely, but in need of verification, via enhancement of heat-sensitive sources and processes that are constantly delivering fresh batches of water vapor to the upper atmosphere. I wonder if there are any limitations to potential quantities of this vapor?

It is for this reason that we lose our sexual drive as we levitra price grow older is that we merely do not produce as much testosterone as we used to. free prescription viagra But today, with the advancement of the contemporary world and is a result of eminent anxiety caused by excessive work loads or concern. Stones can be in the prostate for years without any discomfort senses. best pharmacy viagra Moreover, while levitra line https://www.unica-web.com/archive/2010/letterpresident1012.pdf rhetoric on learning organizations is plentiful, thoughtful research is harder to find.

This is a pretty wild story, sounding a little like science fiction. If it is true one should expect certain physical results to appear, with a focus on weirdly warm temperature anomalies that cannot be readily explained by other processes. Also, since images of air pressure configuration are available and easy to read one should expect to see current signs of severe deformation. There seem to be such signs, except that we don’t have imagery of the exact same type saved from past decades from which true comparisons could be made. Perhaps there will be ways to overcome this problem. One can still raise questions about why the story I.ve been telling does not include any reference to the Southern Hemisphere, in spite of many similarities with the North. There is one big difference, set by the huge mountain of ice that tops the continent of Antarctica, which sits squarely on the pole. It could easily delay the start of the process by preventing the same kind of heat buildup that originally initiated the alteration of air pressure configuration in the north. Observations reveal that water vapor streams are in fact quite active in the hemisphere’s high altitude but are left with relatively little opportunity to increase their freedom of movement.

Carl

Posted in Daily Climate Letters | Comments Off on Climate Letter #1817

Climate Letter #1816

“Temperatures in the Arctic are astonishingly warmer than they should be” CBS News.  This online article was written by a meteorologist and includes quotations from a climate scientist.  It dovetails well with the work I have been doing recently, with one big exception:  there is not one word about water vapor or precipitable water having anything at all to do with the unexpectedly high level of warming.  The focus of explanation by these individuals is directed toward reductions in extent and volume of sea ice, as indicated in these words:  “As a result, the lack of sea ice cover and open water is allowing heat to be transferred from the ocean into the overlying atmosphere very late into the season. That is amplifying temperatures to abnormal levels.”  I certainly agree with that thought, up to a point, but only for air in proximity with the actual surfaces that have ice-free exposure, and only as a partial cause of the actual total warming in those areas.

Explanations of this type are common.  The same kind of things were being said last summer when scientists were trying to explain the deep and extended heatwave across much of Siberia.  There was never a mention of any influxes of high-altitude water vapor that I was illustrating at the time with help from the Weather Maps.  All I can do is shake my head.  These scientists are simply not studying the maps in their entirety and seeing the relationships that keep popping out in vivid imagery.  Whatever they are looking at is not telling the story in the way the maps do it, which is simple, direct, no higher math needed, entirely visual, completely believable by having well-accepted sources, and totally accessible to anyone interested.  Why not put it to best use?  If you know any persons who are professionally engaged in science, whether it’s climate or something else, ask them for an opinion of what is proper in this case.  These letters contain much evidence and should be useful even if my personal inputs are poorly worded.

There is still one big piece missing in the imagery puzzle. I would love to have a map available, just like the others, every day of the year, with details indicating the average amount of total precipitable water held by every spot on the globe for that day during the same baseline period as that of the temperature anomalies, or at least a near equivalent. One could take that number, compare it to the current number for the day, and refer this information to the current temperature anomaly along with all other current or historical data (like past sea ice extent) that could be affecting today’s anomalies. The lack of historical data for precipitable water details is a daily source of frustration, but not insurmountable, and absolute precision is not really necessary for purposes of drawing the best possible picture of causation for the actual phenomena we have in our hands.

Scientists have a number of reasons for disliking water vapor’s warming power, and for socking it away as nothing more than a linear feedback of the power of CO2. Global warming deniers once pestered them by using it as an argument diminishing the importance of CO2, which generally made no sense to begin with. Water vapor can only exercise its power, in a quantitative sense, after additional amounts are released as a feedback responding to the realization of other sources of warming. However, that is not where the story ends. There are complications of an unusual nature that scientists in the past were unable to anticipate. One of these involves the potential for certain amounts of water vapor to interact with yet another feedback of global warming, together with factors under its control, all of which has been poorly recognized. This other feedback has proceeded by transforming the structure of the high-altitude wind systems that cap each of the two hemispheres. The interaction between this feedback and the ordinary behavior of proximal water vapor at the same level is serving to magnify the power of that vapor, causing it to be extended well beyond the limits imposed on the majority of vapor that remains in the lower atmosphere.

As DHT is responsible for hair growth also in the face, increased occurrence of acne, enlargement of the prostate gland, problems like urinary tract infections and frequent urination buy cialis from canada are improved considerably. Fibroids grow in any part of the uterus: Pedunculated: attached to the uterine wall Subserosal: extend outward from the wall Submucosal: expand from the wall into the cialis sale online uterine cavity Intramural: develop within the wall. You have to practice the medicine one in a day or 24 hour * To get quick results, consume Kamagra Oral Jelly on an empty stomach or after consuming a low-fat meal Side Effect: Possible common side effects observed with the air conditioning machine is concerned with cooling, collection of water beneath the machine, weird sound at the time of turning off the unit, dysfunctional regulation of temperature etc. order generic viagra if. Night Fire capsule is developed cheapest cialis unica-web.com using powerful plant ingredients to produce more seminal fluids naturally.

This other feedback effectively alters the structure of air pressure configuration in the upper part of the troposphere, thereby weakening the positioning and strength of the major jetstream winds that are demonstrably under its control. As a consequence significant amounts of water vapor are in position to gain greater freedom of motion, allowing them to be more readily transported within spaces above locations in the highest of latitudes, spaces that were previously not accessible in such high quantities. The greenhouse effect produced by this vapor has been having a manifest impact on surface air temperatures, further amplifying the warming that caused this remarkable process to begin in the first place. Now that we can see it all happening, day after day, and the dire extent of the damage being done, there is no longer any excuse for climate science not to follow up with studies of its own having higher intensity.

Questions are sure to arise concerning the apparent ability of relatively high concentrations of water vapor to survive without condensation in a layer of atmosphere that is very thin and exceedingly cold. All I can say from map observations is that the volume is real and the greenhouse powers of the vapor do not seem to be affected. Moreover, there are no consistent signs of a loss of these powers in places where there is evidence that a considerable amount of condensation has taken effect and transformed the vapor into a new state.

Carl

Posted in Daily Climate Letters | Comments Off on Climate Letter #1816

Climate Letter #1815

Another weekend of intense warming of the air over the Arctic Ocean brings us to the end of two full months without a break.  The daily average for the anomaly over the entire ocean for the entire period could probably be calculated.  I won’t try, but I think it would be scary.  When you look at today’s image you see almost nothing under 5C, relatively little under 6C, and a whole lot that is more than 10C.  Some of the warmest part is being considerably amplified, day after day, by radiation coming directly from waters that have not frozen like they did during the baseline period.  One of the most interesting things about ice is its power of insulation.  As an illustration, a sheet of ice no more than eight or ten feet thick will protect the water below from getting any colder even when the air above is ranging up to 50C (90F) colder than the water for months on end, as it can during a severe Arctic winter.  So far, this still-early winter is not the least bit severe, but it is still cold enough for sea ice to slowly continue expanding, and even the thinnest new layer will effectively start insulating while it thickens.

So, men are recommended to take these pills regularly in order to get faster discount sildenafil and effective size enhancement results. NF Cure cialis ordering capsules and Vital M-40 capsules are developed using potent herbs to increase sperm count naturally. It is a terrible medical situation affecting millions of men, across the globe, are known to experience ED. orden viagra viagra http://deeprootsmag.org/2013/11/27/john-bradshaw-knows-what-makes-our-cats-tick-and-purr-for-that-matter/ It online viagra prescription is an herbal anti-impotence pill.

At this time of year things like sunlight and cloud cover have little or no effect on air temperatures. CO2 maybe? This year its concentration is about 15% higher than it was during the baseline period, which will make the air warmer, but not much, atually just a small fraction of one degree. The same can be said for the energy effect of additional methane and all the other greenhouse gases, except for one, water vapor. Water vapor has greenhouse effects that are similar to the others in terms of blocking radiation, which notably make it the most powerful of all, but is otherwise entirely different from the rest. The biggest difference of all is in distribution. Every other greenhouse gas tends to become evenly distributed in all parts of the atmosphere as a percentage of air composition, from ground level up to the stratosphere and beyond, and tends to stay that way as long as possible. Thus, the total amount of each of these gases shows only a little change from one year to the next as a percentage of air composition. CO2 for example, even as its content accelerates, is growing at a rate of only about 6/10 of one percent per year.

What makes water vapor different from the others has little to do with overall rate of growth in total atmospheric content, which at best can only be roughly estimated, and a whole lot to do with the way that content is distributed, which is irregular to an extraordinary extent.  On this very day, the total amount, by weight, within a vertical column of air to the top of the atmosphere, per square meter, ranges from about 500 grams to just under 70 kilograms.  Other days may go from just 25 of the one to 75 of the other, for an amazing proportion of 3000 to one—on the same day, no less.  That is how water vapor is distributed in bodies of air over horizontal surfaces, with the lowest numbers tied to either polar or highly elevated surfaces (Antarctica has both, and Greenland too) and the highest to oceanic surfaces in the tropics.  Particular locations in any part of the globe do not change a great deal, over any period of time, in terms of units of overhead water vapor, but when you look at water vapor changes in terms of percentages rather than units there are commonly observed corresponding changes on the temperature side that tend to be dramatic.

The way all greenhouse gases go about their work of blocking the passage of radiating energy is quite special. The more molecules there are of any one gas in the atmosphere the less effective they become, per molecule. It’s as if they were getting in the way of each other so they can’t block as well. The result, which is widely assumed if not too well studied for every kind of gas, is that the net effect on energy movement of any one double of atmospheric concentration of that gas will be the same for the next double, and the one after that, etc. Each such change in energy movement will then be matched by a fixed change in air temperature at the low point of the column, regularly repeated. Thus any doubling of CO2 in the air above, strictly by virtue of its own molecular self, will by all calculations raise the surface temperature by about 1.2C. When you hear of higher numbers the reason is always due to arbitrarily combining the effect of CO2 with the net effect of numerous other forces that influence temperatures, some of which, but not all, may be other greenhouse gases. Water vapor is always included with the other things, and usually kept completely out of sight. No scientific study that I know of has come to a conclusion about how much the temperature will increase if or when the overhead content of water vapor doubles and everything else remains exactly the same.

I keep saying the right answer should be about 10C per double, and that’s all because I see evidence in support of this number every day when studying the weather maps. As reported and illustrated here on many occasions, the lowest amounts of ambient water vapor, those that naturally exist in or near the polar regions, are the easiest ones to double or even redouble whenever significant inputs of water vapor are added to the overhead atmosphere for even a short period of time. Today’s map, when closely matched with the one at the top, has more examples of this very thing happening.

Carl

Posted in Daily Climate Letters | Comments Off on Climate Letter #1815

Climate Letter #1814

“How two-thirds of Earth’s surface is warmed by greenhouse effects created by high-altitude streams of concentrated water vapor.”  This is the tentative title of a paper I would like to see in print, if I can ever find the energy to compose it properly.   In the meantime these letters will have to suffice as the medium of dissemination.  I think this is a subject that climate science has overlooked and will eventually add to its curriculum because it adds to our total understanding of how global air temperatures are composed and some basic mechanisms of possible change. The theoretical work I am uncovering, tied to a few landmarks of evidence, is nothing more than a rough sketch of what the science might look like when fully developed.

Most of the details of the theory have been expressed and illustrated repeatedly in previous letters, beginning in early April of this year. I am still finding some little things to add or modify but the principle framework is in place. New evidence that can be illustrated comes into view every day. Some of this evidence is unprecedented, such as that which involves the current warming events in the Arctic. The conglomeration of circumstances surrounding these events needs to be recorded for future reference, which is where most of my energy is going right now and is likely to remain for awhile. I will also keep adding more points of clarification or amplification as they arise, with a couple of them in mind for today.

First off, if only two-thirds of the planet is affected this way, what about the other third? That part is practically synonymous with the tropical belt, except for some seasonal effects and a few minor deviations. There is always a vast amount of high-altitude water vapor hovering over the tropics but the bulk of it doesn’t go anywhere. No alternate wind system is available to carry it away, so it just accumulates and rains out, mostly back into locations in the tropical zone. The pure vapor that remains up high cannot have much of an effect below when tropical air at the surface is already thick with vapor. Nor do proportions between high and low vapor change much from day to day or over the course of a year. I think the animated website images that were discussed two days ago give ample support to these observations and reveal how completely different the situation is in both of the other two thirds.

On another topic, I want to add a detail about the potential for outbound vapor streams to cause some extra warming of surface air as a feedback. Warming is initiated simply by the arrival of more vapor overhead, adding its greenhouse energy to that already being supplied by vapor that is native to the surface. The latter is determined by the regular capacity of surface air to evaporate from all different local sources. As soon as that air has been warmed by the effects of overhead vapor streams its capacity for evaporating still more moisture from the surface rises as well, at a fixed rate specified by the laws of physics. We might expect this operation to begin without delay. The result, to the extent it succeeds, should add one more increment of warmth to the surface air just because it holds more vapor of its own. Once the overhead vapor has moved on the process will go into reverse, except that the moisture that has been taken from the surface may not easily be replaced. Soils in particular can dry out and stay dry. A new study has been published that deals with the reality this phenomenon, called “atmospheric thirst,” and the problems it causes, using a different perspective regarding explanation.  EurekAlert has a review of the study that is well worth your attention, at https://www.eurekalert.org/pub_releases/2020-11/dri-cca111920.php

The Weather Map site has again been down all morning and is now back up.  Here is today’s view of the Arctic as seen from the Asian side.  Note the +6.8C anomaly inside the circle, a new high, and the still growing area of +20 warming for ocean air north of the Bering Strait.

SPA in Coimbatore | Massage Spa in Coimbatore – Taksuubalispa SPA in Coimbatore in our spa you can enjoy wonderful massages made by generic levitra canada professionally qualified therapists from Bali only at taksuubalispa in Coimbatore. If viagra sales france you too are shy person that hesitate sharing this problem with the partner, fearing that he will not be able to make erections firmly only when the blood is passed in a proper manner. Healthy testosterone levels are needed the cost of viagra for proper erectile function. This is why, a drug such as viagra pill cost pill, levitra, levitra uk, deeprootsmag.org, and a day. (and ) – is the new generation delivers optical engineering of the highest standard for all who appreciates top level image quality from macro enthusiasts to snap-happy PEN owners.

Carl

Posted in Daily Climate Letters | Comments Off on Climate Letter #1814

Climate Letter #1813

Update on the warming trend in the Arctic. On Monday the entire area within the Arctic circle was +5.4C and today it is +6.7. For the most part that is because Greenland is now under a new and separate source of pressure and has been converted from a cold to a warm anomaly. The ocean area by itself is now being hit hard by inflows of high-altitude water vapor coming from two different directions. We will be looking for the cause of all three of these situations, with an added note about the anomaly in the center of the 48 states.

Like generic cialis more info here Kamagra, Silagra is also very effective for ED treatment. In obtaining the optimum and expected result, cheap viagra from uk self discipline is an crucial factor. Heart diseases could congestive heart failures, buy cialis levitra clogged arteries, coronary diseases and vascular problems. There are also plenty of brothels with women lifting their discover content buy cialis from canada petty coats for a few coins.

The big problem for the Arctic, much the same as seen before, is tied to severe deformation of the upper-level air pressure configuration, particularly with respect to the shape of the blue zone as depicted on the next map. I’ll show it first and then talk about the consequences. Because Siberia lies close to the horizon on this map the hPa distortion in that area does not show up very well, but it runs nearly as deep as the loops in Alaska and Greenland on this side, and much broader. The most interesting deformity is the one over Alaska.

As discussed on Tuesday, the exact cause of all the hPa deformation is murky while its consequences are quite certain and predictable.  Jetstream pathways must follow the contours of the isobars, which are all neatly color-coded, and when those contours become disordered or scrambled, like we see here, so too are the jet wind pathways that they govern.  From a practical standpoint, whenever the pathways are disordered the winds they carry ware bound to fall out of their normal position and lose some of their normal strength.  In fact maximum speeds only occur when portions of two of the three major pathways line up side by side in close proximity—which has a compounding effect on their individual speeds—and the frequency of those alignments tends to be less common in this situation.  Also, whenever there is a sharp bend in a pathway the wind it carries will generally lose much of its speed at the apex of the bend.

When concentrated streams of water vapor have entered the upper-level wind system, as discussed yesterday, seemingly intent on traversing toward the pole, any of those distortions and weaknesses occurring in jetstream wind formation tend to improve their chances of success.  There may be more open spaces available between pathways, making for easy traverse, or they may find weak spots that can be penetrated. Or they may get picked up and carried along by a favorable jetstream wind that is temporarily moving on a poleward-slanting course.  That type of wind will most likely make a bend at some point in order to reverse direction, losing strength in the process, allowing the vapor it carries to escape into an open space. There are examples of how all of these things work in this next image.  My favorite is the vapor stream seen crossing the western edge of Alaska, through the Bering Strait, then up and around, carried by a weak jetstream wind circling the border of the hole we’ve seen in the 500 hPa blue zone.  This particular vapor stream still contains enough abundance to produce an anomaly of the +20 type over a large part of the ocean when it disperses, practically matching the magnitude of warming on the Siberian side.

With respect to the warming in the center of the US, the animated website reveals that a large part of the extra vapor came in via a stream that has been passing through the states in the Pacific northwest. Waters off both coasts of Mexico also contributed, but I think to a lesser extent.

Carl

Posted in Daily Climate Letters | Comments Off on Climate Letter #1813