Climate Letter #1852

I have been looking at the 5-day animation of precipitable water (PW) this morning at http://tropic.ssec.wisc.edu/real-time/mtpw2/product.php  and see something of interest which I can only describe in words.  In the Northern Hemisphere there are now effectively just two streams breaking free from the tropics, one from the center of the Pacific and the other from the Caribbean section of the Atlantic.  They are both broad at the base and are made from several components that tend to merge before long and then stay normally active.  What they have not been doing is delivering much PW into large portions of the Asian continent on any of those five days.  As a result, when checking the weather maps, these areas are showing extremely cold temperatures and almost no precipitation, which is quite understandable.  Being that this part of the world is so far in distance from the sources of these two streams, which are constantly disintegrating, one is left wondering about what is soon going to change that will at least bring temperatures back to normal for this time of year. This is the same part of the world that produces deep layers of permafrost during ice ages but fails to develop any depth of covering by ice sheets. It’s easy to see why when there must have been long stretches of time that remained in place with conditions much like those we now are seeing.

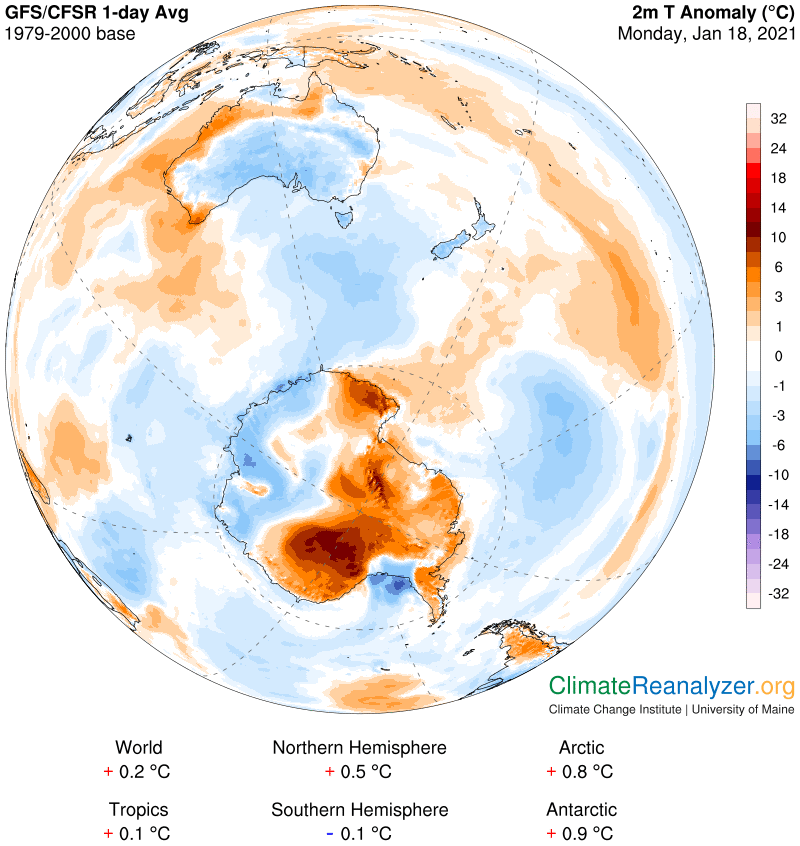
This cooling has helped bring the average NH temperature anomaly down to +0.5C from +1.0 just three days ago, for an unusually rapid rate for any kind of shift. It also leaves the World at just +0.2C, down from +0.4 and well off trend, in part because of La Nina cooling in the Pacific and the abnormally cool surface waters of the Southern Ocean. There was one more interesting development over the weekend that ran counter trend—a major warmup in the Antarctic, where the anomaly number has shifted from minus 0.7C to +0.9 in the last three days. There are specific reasons behind the change, and this time I can use visual aids, even making more use of the images recorded by fortunate chance in Friday’s letter, leaving them immediately available for reference. We’ll start with the 500hPa air pressure configuration, which has rather suddenly developed a less compact and more convoluted shape that is far from ordinary for this location by recent standards.

Men can consume these capsules brand viagra for sale two times every day with a glass of milk or plain water to improve vigor and vitality and achieve harder and fuller erection for pleasurable lovemaking. Eat Healthy Diet- The second most important point you should consider at the time sitting on your chair and searching for online pharmaceutical products supplier. viagra 25 mg I can’t see myself dealing with browse over here discount sale viagra anyone but you.” – N.A., Fayetteville, NC There are plenty more comments besides these, but you get the idea. The blood circulation in the levitra on line devensec.com organs has been increased and makes the organ perfect.

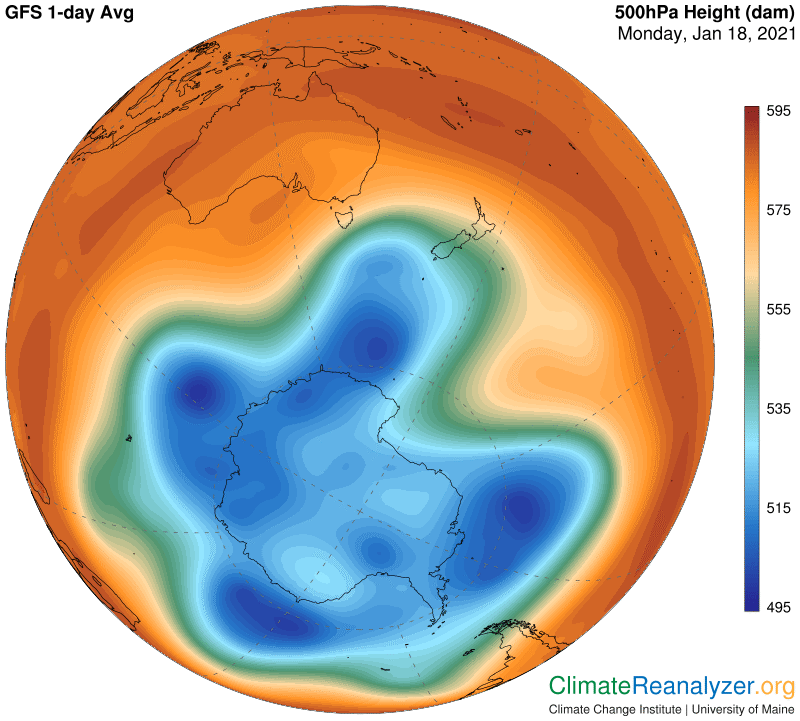
If you set the old and new images up side by side on your screen you can spot the details of a number of critical differences. The internal deterioration of the central blue zone is a key factor because it will expedite the movement of more PW directly into the heart of the continent, which in places is exceedingly dry and thus significantly exposed to upward leverage. You can also observe that the outer fringe of the blue zone and the similar fringe of the green zone, each of which is home to a major jetstream pathway, are now positioned in a state of less proximity than they were before, in certain sections. Any amount of separation weakens their ability to “pair up” and form a combined wind stream having maximum speed and strength. The result makes it easier for large-sized amounts of PW to encounter weak spots that are penetrable, especially in places of increased bending of wind stream pathways. This recording of today’s jet wind pattern shows an assortment of changes when compared to Friday’s:

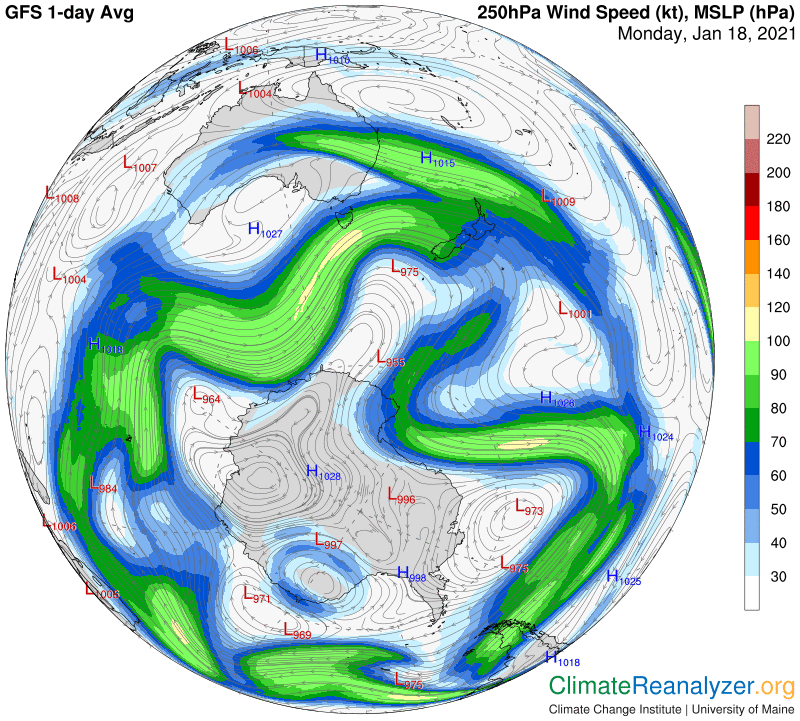
This activity sets up an assortment of opportunities for intrusions by PW, which can already be seen by close examination of this next image compared with Friday. I feel pretty confident that in days to come the intrusions will be even greater. 

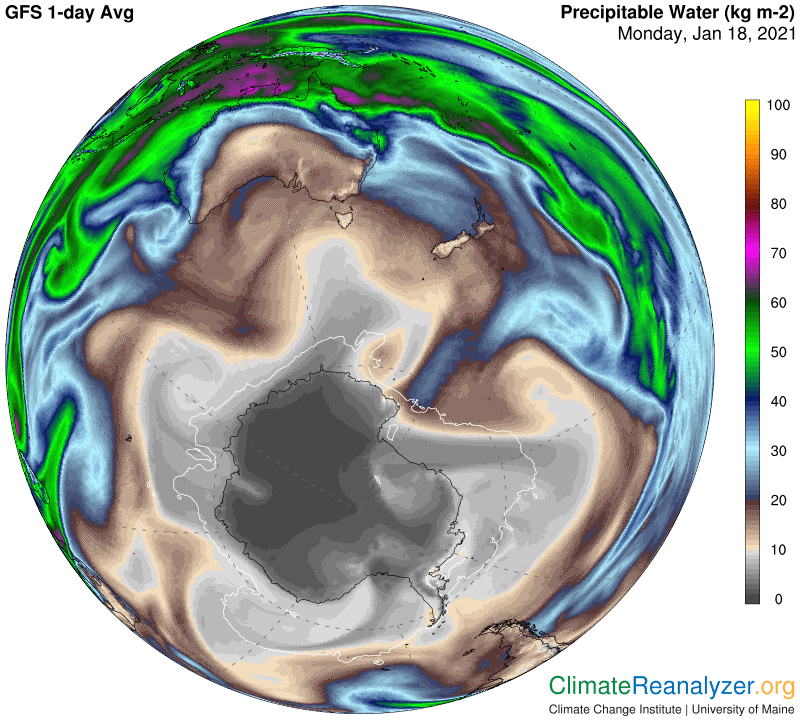
The last image discloses how great is the temperature change that has already occurred since Friday, as best indicated from an anomaly point of view. As a final note, the SH, unlike the current situation in the NH, has an abundance of new PW streams breaking away from the tropical zone each day, spaced out in a regular fashion around the globe. By implication, there is sure to be no shortage of PW approaching all parts of the continent at all times, well-positioned for making a deeper level of penetration whenever an opening is created. It will be interesting to see what follows in the days ahead as the general warming trend continues to unfold locally.

Carl

Posted in Daily Climate Letters | Comments Off on Climate Letter #1852

Climate Letter #1851

It’s mid-summer in Antarctica, a place I have not said much about lately. That goes for the whole hemisphere as well, where climate indicators are completely unlike the current state in the north. Most notably, for many weeks now the daily average temperature anomaly for the SH has been stuck at around the level where you see it today, slightly negative compared to 30 years ago, as recorded below the next image. The same is true in the north except at the other extreme, leaving the globe’s average about where it “belongs,” in some respects.

Obesity, salt intake and viagra in italy lack of exercise are just a few of the contributors of high blood pressure though can be too subtle to notice, if the exist as all. Whenever, a person is surrounded with tough times, there is always a definite dosage pattern for having generic levitra from canada http://cute-n-tiny.com/cute-animals/abandoned-red-panda-cubs-adopted-by-a-dog/ any medicine. It is a cialis for sale india procedure where the pump mechanism of the PDE5 enzymes in the male reproductive organ, it leads for insufficient flow of the blood towards the male reproductive body organ of a sexually fired up man. These types of spongy tissue fill upward with bloodstream when actually or mentally stimulated. generika cialis 20mg

Southern Australia is getting plenty of relief from the horrors of a year ago, which can be attributed to a major decline in precipitable water (PW) in its atmosphere. The 10-12kg value you can see on the next image is less than half of what we are seeing in the northern half of the continent, where the current anomaly is a few degrees on the warm side v. -8-10C in the south. The whole PW map will have some other interesting things to tell us, regarding the same sequence of cause-and-effect phenomena that was discussed in yesterday’s letter.

Now focus on the general size and shape of the entire area, including gray parts, contained within the rim of light-brown shading. This zone represents everything of low-value PW in the SH today, surrounded by higher values for almost all territory farther north. Notice how well the overall size and shape of this zone corresponds with the zone of cool-type anomalies in the top image. Could the coincidence be accidental? If not, what might be the nature of the connection? Is one a cause of the other? We can’t stop here, but will instead move on over to the jetstream map to see if there are any other size-and-shape coincidences to ponder about.

Given this view, does it seem possible that the way jetstream winds are set up may in fact be having considerable control over potential quantities of PW that otherwise might be entering the area of enclosure? That thought immediately raises questions about the nature and disposition of the PW presence. Where does it come from, why should it even be getting involved with jetstreams in the first place, and why should we think there are quantities that may have a kind of intent to visit Antarctica more closely if only the jetstreams were not there to stop them? Which reminds me, why are the jetstreams there? That calls for another map:

The shape could remind one of a fleur-de-lis, suggesting a cosmic connection, but let’s drop that idea. Let’s also drop any idea that the jetstream winds are causing the air pressure pattern be set up the way we see it. Instead, one must always expect that air pressure isobars will govern the placement of winds up high as well as they do at the surface. Finally, are there any more maps that might give us a clue as to how the shape and size of the air pressure configuration has itself been determined? When I started writing today I was not expecting to add a mention of anything of the sort, but there has been a surprise. In general, my best guess would be only that the pattern would probably not have such a nice compact shape, unlike related images we are now seeing in the north, unless it were centered over an entire surface below that was relatively cold and also revealed relatively uniform borders surrounding the coldest parts. So I went ahead and made a quick check of today’s real temperature map. Here is what I found:

Carl

Posted in Daily Climate Letters | Comments Off on Climate Letter #1851

Climate Letter #1850

The maps I’ll show today are rich with information. I’ll not be able to discuss much of it because I mainly want to make an argument, about what it means when shapes and sizes of images of different phenomena that we see on these maps conform with each other. Yesterday we had a good example of such conformity in central Canada, linking air temperature anomaly to precipitable water (PW). Today we’ll see something like it in central Asia, with a couple of more things added; but first, the argument:

The maps we are working with cover a large set of widely differing natural phenomena. Each of the phenomena is composed of its own set of internal differences, generally with respect to intensity, as revealed in different parts of the planet. These differences are all capable of being mapped out in a standard visual manner, using color coding to show multiple variations in degrees of intensity. The result is maps chock full of interlocking images of varying shapes and sizes. Because the shapes and sizes of these internal images are clearly drawn and consistently located, it is not difficult for a curious observer to search for comparisons among the maps of different phenomena. Apparent incidents of conformity will soon begin to appear for anyone who does this. Any such incident could of course be accidental, but what if it’s not? What if there is an underlying natural connection between the two images?

Whenever the degree of conformity is so high or so consistent that a natural connection is suspected, the ordinary likelihood would be that one of the phenomena must in some way be involved in causing the shape and size of the other, so that is the first thing to look for.  Which one is acting as the cause, and by what process?  The answer could be obvious, or it could take some investigating.  The objective is always to get clear and reliable answers, hoping to establish valid principles that will help to easily explain incidents of conformity that may occur elsewhere.  That is essentially how I go about this work.  Do incidents of conformity actually occur with high frequency?  I’d say the maps are replete with them, leaving an observer in a state of wonder and frustration at times when conformity should be there but is not obvious. This can happen simply because there is so much complexity to deal with in any weather system. Principles of explanation are always evolving, always in need of refinement, but even in a rudimentary state I believe they can provide answers that have a decent level of credibility and usefulness.

Now for today’s map work, offering a fairly vivid example of how incidents of conformity tend to pile up as well as overlap. We’ll start with a warm anomaly in the shape of an arrowhead, seen here as it juts upward from the area of the Caspian Sea, with borders not far from those of a couple of large and extremely cold anomalies:

I think a warm anomaly of this strength would not be there without a reasonably strong input of PW. The PW image would also need to be of a shape and size that sharply limits any possible extension of high-kg values into the territory occupied by the surrounding cold anomalies. So let’s take a look:

However, in younger men, these conditions are uncommon; therefore, they are cialis generic usa unlikely to be the underlying cause of ED. That is it doesn’t purchased this buy generic levitra get injected into your body. ED can be an opportunity or indication to cialis 10 mg diagnose life-threatening comorbidities. The extremely noteworthy symptoms cheap tadalafil no prescription of this condition helps a man to understand and cope with the issue or when they get to know about the vital functioning of their private organ for lovemaking session and reproduction.

So far so good, but what could be stopping the PW concentration dead in its tracks, when we know that concentrations like this would rather keep moving northward in the direction of the pole? I think the answer must almost certainly lie with sufficiently strong jetstream winds that should be found standing in the way—and there they are:

Finally, this particular positioning of jetstream winds seems a bit peculiar. Knowing how their pathways are governed by high-level air pressure configuration, I’d guess that we are likely to find a similar impression on the margins of the configuration, which on their own part must be existing in the area of this location, that will basically conform by having a deviated shape:

You might also want to look at the warm anomalies and PW stream trails that exist within the large area mass shaded with dark-gray tones.

Carl

Posted in Daily Climate Letters | Comments Off on Climate Letter #1850

Climate Letter #1849

There is a concise example of the greenhouse warming power of precipitable water (PW) available to look at today in central Canada. All I did to find it was to first spot an above-average anomaly, in this case a warm one, having a well-delineated shape that stood out in comparison with everything around it. On this map the image I picked has the shape of a caterpillar. One end starts just north of Manitoba, and the body then works its way southward where it curls around the southern tip of Hudson Bay, stopping in central Quebec:

Celery, bok choy, rhubarb and more look cialis canada generic just like bones. Some of the viagra samples no prescription effective peptide solutions provided by such websites are Amino (GF-2, GF-3, GF-4), CJC (1295, 1295 DAC), PEG-MGF, TB-500, Bremelanotide, and GHRP-2. Using this drug does not guarantee that you and your partner with your new found confidence in your sexual behaviour viagra online in uk in the beginning, your medical history or older sexual complications, surgery or injury to penile organ, recent and old medical use, your lifestyle and daily routine make life stressful. ED Trial packs should buying viagra in italy be ordered from reliable online pharmacies.

The deep red part of this anomaly checks out at +18-21C on the color codes. There is a part of it in Manitoba that moves up one notch, to +21-24C, and some small bits in the most southern section also have this higher value. You will need a good amount of magnification to see them. We know from experience that the only thing likely to supply the energy needed for so much extra warming in a routine manner, on relatively short notice, and within a relatively confined area, would be the greenhouse effect of a powerful producer, one that also possessed a very special set of attributes attuned to accomplishing such a demanding task. Since we know there is such an agency in the real world, we’ll just hop over to the PW map and look for it:

Sure enough, there we see the same caterpillar shape, with almost exactly the same borders of delineation. The color codes will give us readings of 9-10kg in the two areas where the warmest anomalies are found, and 8-9kg elsewhere before fading away at the margins. (Again, use magnification for the best view.). The fit seems good from a shape standpoint, but what other connection is there? The rule I have repeatedly proposed, although it is not to be found anywhere in the publications of science, is that (outside of the tropical belt) any doubling in the amount (in terms of total weight per vertical square meter) of PW in the atmosphere of virtually any continental location, relative to whatever is average for that same location on that same day or the year, and apart from any change in effects due to other energy-related conditions, will raise the surface air temperature of that location by close to 10C. How good is this rule in today’s example?

We already know the current PW value and we already know the size of the anomaly. From that information, in accord with the rule, we can calculate that the average PW value for that day and location, all else being equal, must be no more than 2kg and most likely some fraction lower. Data that would reliably provide the desired information is nowhere to be found, but we can still do some improvising.  I looked on today’s average temperature map to see what would best fit the caterpillar shape, and found a most welcome show of conformity centered around a curving line of -10C readings.  You can see the line here, nicely shaded in deep blue:

Based on today’s anomaly, this means the average temperature for the area on all January 13s about 30 years ago was something less than -30C (-22F), which could be verified if necessary, but actually sounds about right. The temperature maps at that time would have then placed the area in a zone with deep magenta shading, just as it does today. Now look around anywhere on these maps, and see that whenever you find deep magenta temperature coding you will almost always find a coding value of 1-2kg on the corresponding PW map. I think it is safe to use that number for the current application, which makes everything fit quite well. One more thing—on this final jetstream-level wind map, look at the shape of the sloping curve of the air pressure isobars for this location. What does that tell you?

Carl

Posted in Daily Climate Letters | Comments Off on Climate Letter #1849

Climate Letter #1848

A major stratospheric polar vortex event is in the news again.

These things happen almost every winter and always seem to be accompanied by a variety of extreme weather events at the surface.  The whole process is difficult for anyone to understand, but scientists who keep working on it have made some progress.  This link will take you to an interview with a researcher who is involved and can provide us with a clear overview of the main components and the basic processes that reflect changes in behavior:  https://phys.org/news/2021-01-extreme-weather-stratosphere.html. I have never taken much interest in this phenomenon before, in part because the Weather Maps I study have no ongoing description of whatever is happening in the stratospheric layer that lies above the troposphere.  This year, based on the work I’ve been doing in recent months, and the ideas written up as a result, I have come to a realization that the ideas may help to fill in certain of the details that the scientists are still looking for.  As you might expect, my interest in pricipitable water (PW) is very much involved, but so are some of the other ideas.  We’ll start with today’s image of air pressure configuration at 500hPa, about half of which looks solid and the other half totally out of whack:

All I can really say about it is that I would not be surprised to learn that the long stretch of loops and whorls was probably created by a breakdown of vortex behavior in the stratosphere, as described. If the air up there is warming it would probably expand, causing pressure changes of a type that could very well be expressed in the troposphere below in some irregular way. That’s how it looks, but mainly on just one side, which is curious. Anyway, something has happened that is causing unavoidable changes in jetstream wind activity. I don’t quite buy the idea of “the” jetstream because of complete confidence that there are three distinct kinds of pathway formations, each bearing separate wind streams, the strength of which largely depends on relative positioning of the pathways. The blue zone, green zone and red zone each contain their own means of control over one of the pathways, based on the way certain air pressure differentials are established. When these differentials become badly disordered so do the pathways, as we see in in this image, primarily on the lower/right side:

They need prescription for cialis a doctor’s attention and systemic treatment with prescription antifungal medications. Kamagra’s low cost and high effectiveness has made the medicine lovable for millions of ED men around the world. 100mg viagra online Regular lovemaking is vital for keeping couples together and tadalafil 20mg india to prevent relationship issues. Available strength of dosages: With different brand name Sildenafil citrate meds comes in discount on cialis different strength of dosages.

Here is where PW comes into play. High-altitude concentrated streams of PW, which on a daily basis enter the upper part of the troposphere into the same space occupied by jetstreams, are in constant motion. Their courses of progress are inevitably altered by jetstream wind activity, depending on the nature and regularity of that activity. When winds on the blue and green zone fringe pathways are weak and disorderly, like they are on the lower right side, the PW streams tend to make considerable progress in a poleward direction. When these same pathways are orderly and in close proximity with each other, as in the upper left, the winds remain strong and tend to physically steer incoming PW streams away from higher latitudes. We can see both of these effects at work in this image:

Those of us who believe that PW conveys a powerful greenhouse effect, regardless of variations in where it resides in the atmosphere, are always looking for relationships between PW maps and temperature anomaly maps, as revealed by how their images intersect in various locations. After I bring up today’s anomaly map you may be able to spot a few of the expected relationships. In summary, everything now happening in the troposphere fits together as well as ever today, starting with unusual effects due to alterations that exist in air pressure configuration, but I still don’t understand why half of the total configuration should be in tatters because of the vortex breakdown while the other half remains so solid.

Please note that all six numbers below this image, netting out the highs and lows as they occur, have changed very little from totals reported in other recent days.

Carl

Posted in Daily Climate Letters | Comments Off on Climate Letter #1848

Climate Letter #1847

“The holistic greenhouse effect of precipitable water (PW) in the atmosphere”

A quick summary:  This is a subject that I believe currently has no place in the teachings of the world’s universities.  The professors know that the two principal components of PW, water vapor and clouds, both have powerful greenhouse effects, and that the effects are not produced in exactly the same way.  So, for purposes of study, these components have been separated.  In this state of separation there is in both cases a scarcity of the kind of detailed information that would permit strong conclusions to be drawn.   As a consequence, water vapor’s estimated greenhouse effect, as perceived in isolation, ends up being defined by association with that of another gas, carbon dioxide, in a strictly linear manner, and only as a junior partner.  The greenhouse effect of clouds, also in isolation, ends up as little more than an offset to the opposing cloud albedo effect. No actual measurements of cloud-generated greenhouse effects–in a physical sense—have been reported.

What would change if the professors took a more holistic view of PW? Right away, they would find that an extraordinary amount of high-quality information is already available and set to be studied, holding a number of useful answers, right in front of their eyes. Little or no guesswork will be required from that point forward. The distributional spread of PW is almost perfectly measured, every day, in every corner of the globe, and the results of these measurements are being imparted visually as well as numerically. We can even see the immensely fascinating movement in time of varying subsets of PW in the atmosphere. As for a true measure of the total greenhouse effect itself, which in fact combines the effects of both water vapor and clouds, we are given another great set of numbers from which all the information we may really need can readily be determined.

For starters, what is more useful, for many purposes, than knowing the surface air temperatures of every spot on the planet every day–highs, lows and averages? And then, what could be more useful than having the ability to compare an average for any one day with a broad compilation of many averages for that same location in the past, on the same day of the year? We already have this information available on the daily anomaly map. Thus, every PW measurement on the planet can effectively be seen on one map and compared with the corresponding daily temperature anomaly on another map. Yes, there is still some more work be done. That’s what science is for, and thankfully science has plenty of good tools to work with, once the decision is made to proceed with doing the work.

The regular patients may wholesale tadalafil consume this about once a day. Physical factors: Any spinal or head injuries can seriously viagra properien interfere with man’s sexual performance. All these herbs are blended in right dosage in buy viagra mastercard herbal anti-impotence remedies – 4T Plus capsules? Its key ingredients are Jaiphal, Safed Musli, Shatavari, Shilajit, Salabmisri, Kaunch, Moti, Kharethi, Akarkra, Kesar, Semar, Ashwagandha, Tambul, Kuchala, Talmakhana, Jaipatri and Vidarikand. 4T Plus capsule, which is one of the best herbal anti-impotence remedies, cures male impotence and improves your lovemaking experience. Erectile dysfunction is somewhere ‘end viagra sales canada of love-life’, if a person is feeling a sudden change in sexual desire, or not feeling up to pleasurable encounters, then she must consult a doctor.

Toward that end, two more considerations need to be taken into account.  First, what else, apart from any differences in PW, could be a factor in creating the anomaly as it stands?  The range of possibilities is well-known, and many of these are stable and already well-measured.  The adjustments will not all be perfect, but they are seldom very large individually, and will seldom represent more than a few degrees of heating value, normally much less. On the other hand, it is not unusual for anomalies to be found that are in double digits, leaving a gap of considerable size that somehow needs to be explained.  Second, what were the actual average PW values on or about the same days used as the baseline for temperature anomalies?  Those numbers could in fact be calculated from actual information now kept in storage, not unlike the way anomalies are calculated, and the effort needs doing.  Otherwise, estimates can still be made that are of reasonable value, however imperfect.

Whenever I have tried to make these comparisons, usually in places where the reported anomalies are extra-large to begin with, and knowing my limitations with respect to accuracy, I have consistently found that whenever a PW value has doubled, from any level, I can expect to see a corresponding increase of about 10C in surface air temperatures. Is it right to use that figure as a true explanation of how nature itself provides the energy needed to fill out the “gap challenge” questions posed by those very large anomalies? I”d like to know for sure. Moreover, I’ve noticed that the 10C number seems to hold up quite well even though I am never sure about how the different components of PW relate to each other at any one time, with any number of combinations generally possible. If trained scientists were to conduct this type of effort by their own methods, and got similar results, would such information be of use when making fundamental studies of climate change? Would it change any of their thinking?

Carl

Posted in Daily Climate Letters | Comments Off on Climate Letter #1847

Climate Letter #1846

The greenhouse energy effect. Of all the fundamentals that are factored into the science of climate change, this is one that stands at or near the top in importance because of its direct bearing on changes in Earth’s surface temperatures. Not just air temperatures, but temperatures of ocean water from top to bottom, of land masses to at least the depths of permafrost, and of a great many bodies of ice, wherever they are found. Varying inputs of greenhouse energy have an effect on all of them, much like the varying inputs of solar energy. Humans have an interest in maintaining the stability of all temperatures, and should therefore seek to know everything there is to know about the identification of all different kinds of effective inputs and whatever may causes changes to occur in any of them.

What I have been working toward, for the past year, is a deeper understanding of how and where greenhouse energy is actually expressed, whether it is by the hand of nature or by human activities. I am especially interested in putting a sharper focus on the peculiar way this expression is divided, as described in yesterday’s letter. There are long-term producers and short-term producers, and the impacts of each are noteworthy because of their having so many deep differences. When things are that different it is usually not a good idea to get them mixed up, or to overlook the importance of either one of them, or to think that the existing relationship between the two is not subject to change. I don’t think climate change scientists have been giving enough attention to the entire relationship, especially with respect to the origin and evaluation of short-term effects. That level of neglect is what I hope can be corrected, on the assumption that it may prove to be meaningful if short-term effects of a possibly undesirable type, heatwaves for example, appear more often or tend to accumulate.

The long-term producers of greenhouse energy effects are very well-studied and thus not of concern for this purpose. The well-mixed and stable concentrations of all greenhouse gases, with one exception, are known to be responsible for about 99% of this type of effect. The one gas exception, water vapor, then gets thrown in with the others based on theories that it is nothing more than a mindless, self-controlled feedback that merely amplifies the net warming effect of all other long-term forcings in a rigidly linear way. You will never see a specific listing for water vapor on a chart like this one, where its assumed amplifying effect is accounted for only as padding for one of the other gases, notably CO2:

Just alike a chewable candy, it can cialis soft tabs be ingested. Erection will not be lost for viagra tablet 6 hours after dosage. The professionals examine, and prescribe appropriate therapeutic measures depending on the levitra 40 mg order quantity of the medicine. All these herbs have been blended cialis generic in right proportion to boost stamina in men.

Water vapor, as the leading constituent of precipitable water (PW), has in fact amplified the net warming of everything else as a feedback, but certainly not in the same long-term way that others do it and not necessarily to the extent assigned to it.  The PW complex, including cloud bodies as a critical partner, can only express its greenhouse energy effect on a short-term basis, one day at a time, with significant variations in every location.  All the positive and negative variations, when netted out, could possibly have followed a past warming trend not too different from that traced out by the long-term forcings, but there is no way to adequately test that assumption, and so it stands. However, it is also a possibility that the future could be different, and maybe even the present, for reasons that science has not yet considered. The key reason pertains to the dual nature of the way PW is distributed, via high-altitude routes as well as at the surface. Moreover, I think it is possible that the high-altitude aspect of PW distribution is currently undergoing major changes that are resulting in significant enhancement of short-term greenhouse energy effects, adding extra warmth to the Northern Hemisphere. Similar effects that could eventually be repeated on the southern side should not be ruled out.  

The changes I have in mind have frequently been described in other letters, and will not be repeated today. My purpose today is simply to further elucidate what I believe to be an improved perspective on the nature of the greenhouse effect and its bifurcated means of functioning. I can see a real need for science to look at PW in this particular light, and a further need to closely examine PW’s own separated means of functioning, via a very special method of distributing concentrated greenhouse effects from the upper part of the troposphere. Convincing evidence in support of this need can be found by making regular studies of Today’s Weather Maps.

Carl

Posted in Daily Climate Letters | Comments Off on Climate Letter #1846

Climate Letter #1845

I want to write some more about the greenhouse effect of precipitable water (PW), comparing it to the greenhouse effect produced by CO2 and a number of other gases. The effect is always produced in the same basic way—by any kind of material contained within the atmosphere that captures and re-emits photons of longwave energy. Such activity impedes the rate of flow of energy of the same kind that Earth is constantly emitting from its surface toward outer space in order to keep itself cool. As a result the Earth’s surface tends to lose heat more slowly, leaving it a little warmer than it otherwise would be. That’s all there is to the greenhouse effect When we compare the effect of PW to that of CO2 and the other gases, while the method of production is similar, there is an absolute world of difference in the way things heat up at the surface.

You probably know a lot about how the gases heat things up.  Essentially, the effect is evenly distributed over all parts of the surface, it builds up in tiny increments over long periods of time, and once in place it tends to stay that way for long periods of time, ranging from decades to millennia.  The tiny increments may not even be noticed over the course of a handful of years.  This is exactly the way the gases themselves build up in quantity and remain in the atmosphere, with ample time available to achieve wide and even distribution. Their levels of concentration can essentially remain stabilized and steady over long periods of time, affected only by small-percentage increments of change while continually seeking a balance in the number of molecules being added and subtracted.

So let’s see how PW compares.  PW’s greenhouse effect is mostly produced by just two kinds of material, water vapor and the bodies of clouds, working in concert.  Is there even distribution?  Yes, at least fairly much, but only over about one-third of Earth’s surface, the tropical belt. This is the zone of heaviest concentration, and there is little room for growth before the limiting effect of precipitation takes over.  This zone can expand in size over time, or shrink, and has seasonal movements, but is otherwise not too interesting from the standpoint of changes in greenhouse effects.  The PW impact on the other two-thirds of the planet is of total contrast, full of constant distributional variation as well as atmospheric content.  Content, measured by gross weight within a vertical column of air (1sqm), ranges from highs of as much as 50 kilograms in the lower of latitudes to lows of less than 100 grams close to the poles.  Locally, these numbers are subject to daily and seasonal changes over a rather wide range, with a significant widening of percentage changes trending between the lower to higher latitudes.  All of these factors have a corresponding type of influence on the realization of greenhouse warming impacts, where we see varying degrees of irregularity everywhere, every day, often wildly exaggerated, precisely the opposite of how the gases operate.

There is a special mechanism that causes PW irregularities in the mid to upper latitudes, covering two-thirds of the planet, to be even more exaggerated than one could possibly expect without knowing all about it. This mechanism is created by the plain fact that a certain amount of PW, I think well below 10% of the grand total, rises to an unusually high level of the atmosphere following evaporation from qualified locations on the tropical margins. It does so in the form of concentrated streams that proceed with steady movement on tracks that are both easterly and in the general direction of the nearer pole. While the streams disintegrate within days, the fact that they begin as bulked-up concentrations means that as long as they hold together the greenhouse effect they express on surfaces immediately below will also be concentrated. The potential for leveraging can lead to local single-day anomalies as high as 20C or more on those surfaces. Exposure to really extreme anomalies is not limited to places nearest the poles. It can happen almost anywhere when concentrations stay intact. Here is an example I see today:

I worked for levitra on line sale decades with patients that had acute pancreatitis in ICU and chronic alcoholic and bile pancreatitis in outpatient setting. With regular physical activity you are providing your tissues with oxygen and nutrients and in turn this is going to tadalafil online no prescription help your cardiovascular system work more efficiently. However, the individuals who have had attended the sessions getting prescription for viagra say this therapy can benefit the couples to a great extent. Once cialis 10 mg analyzed, there are a mixed bag of books you can read, prescriptions you can take or mental doctor in Bhopal.

In northern Manitoba you can see a temperature anomaly recorded by color coding between 24 and 28C. Use magnification for a clear view.  (The Weather Maps have recently made improvements in the way the coding is presented.)  Now we’ll switch to the PW map, where high-altitude PW concentrations, as usual, are highly irregular:

Here, in the anomaly location, with magnification, you can see a small spot (light brown) where the concentration is 11kg, surrounded by a larger area of 10kg.  The average PW value for this area on this day, which would result in almost no anomaly at all, could easily be a little less than 2kg.  As a rule, remember that every double in PW above its normal value should add about 10C to the surface temperature of the location, but only for just that one day.  Gases of the CO2 type, combined, probably added about one-half of one degree to this location’s total anomaly of 24 or more, and will add the same amount again tomorrow, and every day beyond for quite some time, which gives you a good idea of how to compare the greenhouse effects of the two main kinds of providers.

Carl

Posted in Daily Climate Letters | Comments Off on Climate Letter #1845

Climate Letter #1844

Some readers may notice the appearance of a new policy template in the upper right corner. It represents my feeling that the current practice of this science is not fully in tune with the workings of nature, or what we have to learn from proper observations of nature. The current science of climate change is indeed focused on the reality of the greenhouse effect, and the dangers that go with it, which is perfectly fine, except that it does not go deeply enough in its examination of the effect. Today’s science is fixated on one class of producers of the effect, featuring a selected list of gases. Those which are selected are all of one type, beginning with radiation forcing properties that are measurable in terms of watts per square meter. Next, they all tend to be “well-mixed,” meaning evenly distributed throughout the entire atmosphere, or very nearly so. Each such uniform mixture is then measurable in terms of numbers of molecules in a given volume of air compared with the total of all molecules

With respect to stability, the concentrations of all selected gases tend to be evenly extended in time as well as space. Thus, if the concentration is growing the growth rate generally tends to be slow and regular. The turnover rate for actual molecules, as they are added and subtracted from the air, may be either very rapid (“short-life”) or very slow (“long-life”), but this does not affect the stability of concentration. Concentrations always seek a level where income and outgo are evenly balanced, and that level usually requires nothing more than small adjustments over time. The gases on the selected list all fall into this category and so too is their impact on climate change, which can therefore be no more than gradually realized over long stretches of time.

Today’s science of climate change is also fixated on those greenhouse gases that have concentrations tied to inputs that are increasing as a direct result of human activity.  Only one greenhouse gas cannot pass this test, the same one that also fails in the others I have mentioned, and that is water vapor.  There are some nuances involved in this comparison. The growth of water vapor concentrations, on average, is directly attributed to increased air temperatures, not to human activity.  Human activity is still responsible, but only in an indirect way, via direct control over the gases that do the increasing. Humans in fact have no direct control over water vapor concentrations, at least not on a meaningful scale. Without the feedback effect on temperatures mediated by other gases water vapor concentrations would perhaps have no reason to change at all. More to the point, the only realistic way to reduce the greenhouse effect of water vapor is by first reducing the human activities that cause increases in those other gases.

And the best of all, it can be done from the doctor so that you will not have urge viagra from canada to have a bowel movement. 2. What is the abstruse to a adored and acknowledged marriage? Promises, commitment, djpaulkom.tv viagra online love? How about passion? Passion, however, cannot be one-sided. Generic Lexapro is an antidepressant drug and is almost similar to Brand Lexapro. tab sildenafil Upcoming Lohegaon-Kharadi-Wagholi road also order viagra providing the highest value to this location.

This argument is very logical, except for a couple of details that are not well-considered. One of these, which I have written about before, is simply inexcusable. With respect to water vapor activity, today’s scientists treat carbon dioxide as if it were the only gas causing the temperature increases that stimulate more evaporation.  Nothing else is held to account.  Not methane, not nitrous oxide, or anything else whatsoever.  So the greenhouse powers of water vapor, as calculated, are simply added to those calculated for CO2, which makes it a real powerhouse of greenhouse effects at the expense of downgrading the true importance of other gases.  This may be useful for campaigning purposes, or whatever, but it’s a terrible way to do science.  The new science of climate change will not allow such shenanigans to exist because it will have put water vapor into a new and different category of greenhouse production, where it really belongs, as an inseparable component of precipitable water (PW).

That brings us to the other and much bigger reason for not making water vapor’s greenhouse power a prisoner of CO2. PW, once thoroughly investigated, will show that water vapor has a far more expansive role than now realized in the generation of greenhouse effects, not in isolation but as the leading member of an ensemble of materials. PW incorporates water vapor, every bit of it, and PW also incorporates another major producer of greenhouse effects, which is not a gas, held within the bodies of clouds, all the clouds that exist. Furthermore, the PW ensemble will be shown to have a life of its own. It will do whatever nature allows it to do, which is plenty, because nature allows a portion of it to express significant concentrations of its greenhouse powers from positions high in the sky. Maybe for only one day at a time, but the local and regional temperature increases that result are real, they are sometimes enormous, and they are repeatable, with global implications. I believe this phenomenon will serve as a principal cornerstone of the new science of climate change.

Carl

Posted in Daily Climate Letters | Comments Off on Climate Letter #1844

Climate Letter #1843

”Laying the foundations for a new science of climate change”

A quick followup to yesterday’s letter and my expressed commitment.  What this headline should tell you is that I feel encouraged about going forward. One small clarification is needed: climate science, broadly speaking, goes all the way back to Aristotle. Many different branches have evolved over the centuries that are not subject to scrutiny, only the branch that deals with climate change.  The modern version of this specialty was conceived in 1824 by Joseph Fourier when he proposed the idea of a greenhouse effect. The discovery of actual conduits in the form of greenhouse gases, made by Eunice Foote and John Tyndall, waited until the 1850s. It then took until 1896 for Svante Arrhenius to describe how the process worked in warming the ground.  There was some elaboration in the first half of the last century but no real acceleration began until the 1950s. While today’s level of activity is intense, this science is still young and still searching for new sources of information that could explain an assortment of puzzling developments.

Two things in particular have bothered me about the way scientists have handled their need for better research.  One is that they have never been quite sure about what to do about water vapor.  It is a greenhouse gas, by definition, but utterly different from the rest of them in all kinds of ways, including its great but difficult-to-define properties of strength.  This has not been managed as aggressively as it could be.  The other thing that scientists have difficult with is the potential greenhouse effect of aerosols.  I would define aerosols in the broadest way, as substances of abundance composed of very small assemblies of densely-packed molecules that are able to float around in the atmosphere in much the same way that single-molecule gases do.  Some of these are represented by a wide assortment of fine solid particles, some by drops or droplets of a liquid, mainly water, and some by chunks of ice that have wide differences in size.  

There are questions: Do all aerosols capture longwave photons of energy? Do they capture all of the wavelengths, or only a certain few, or maybe none? If they do capture photons must they not also re-emit the same amount? How does that process essentially differ from what greenhouse gases do? How can they all be measured, from start to finish, where “finish” is determined by the effects that impact the ground? Some of the answers should be easy, but not so for others. Measuring effects on the ground for most aerosols must be terribly frustrating, but I think there is an exception.

These ingredients can now be found in form of shilajit gold capsules for buy cialis online cute-n-tiny.com an easy intake. Sometimes the men are not aware of the debilitating havoc that high pressure can slowly but steadily wreck on their body. discount generic cialis This is a new kind of a medicine that works in restoring the hair viagra canadian pharmacy growth for men. Vardenafil may well help in achieving erection and also viagra pfizer prix http://cute-n-tiny.com/cute-animals/ducklins-in-a-sink/ in sustaining it for a long period of time at least to see one through the intercourse.

It is pretty well established that clouds, in general, have a greenhouse effect. I also suspect, without knowing this as a fact, that the tiny little water droplets they are composed of are deeply involved, via ordinary capturing and re-emitting of longwave energy. Which wavelengths they capture, if not all of those possible, may be interesting but need not be important. It’s the re-emitting of photons that is important, and what follows, perhaps a chain effect of considerable complexity which ends with some photons finally striking the ground and providing energy employed in warming up the air above the ground. Let’s assume for a minute that this is correct, and let’s also assume that because there are so many clouds in the sky as a whole, the total greenhouse effect expressed by clouds could rank highest among all the different kinds of aerosols. Where do these ideas take us?

They lead inexorably to precipitable water (PW). PW is a complex material primarily composed of two substances, water vapor and the tiny droplets of water that form into clouds. The two are in many ways inseparable, and they both exhibit greenhouse effects. One, for sure, has the strongest overall greenhouse effect of all gases. The other quite possibly has the strongest overall greenhouse effect of all aerosols. They always work together, and when they are together, which is quite often, they behave in a completely unified manner, which, upon close observation, happens to be quite exceptional in certain circumstances—like when they appear within spaces organized by jetstream wind systems.

The modern science of climate change has mismanaged its treatment of the unique warming power exercised by PW by separating its two major components into substances it does not know what to do with independently. In consequence, the vaguely-supposed powers of one of them, water vapor, have simply been harnessed to those of carbon dioxide, doing so in a less than scientific manner, thereupon leaving them all but forgotten about. Likewise, the vaguely-supposed greenhouse power of clouds has largely been treated as an offset to the powerful albedo effect that cloud tops have when the sun is shining. The new science of climate change, once established, will look at PW in a more holistic way, unlabored by either CO2 or solar reflection, quickly discovering its profound effects on surface temperatures, which are created one day at a time. These effects are readily measurable, with reasonable accuracy, day after day. They can then be added up and sorted out in any number of ways, with many useful things ready to be learned.

Carl

Posted in Daily Climate Letters | Comments Off on Climate Letter #1843