Climate Letter #1902

I have often claimed that mainstream climate science shows no sign of interest in the greenhouse effect of precipitable water (PW), comparable to the way I describe it in these letters.  I should be ready to back up that claim whenever I can, or when there is good evidence.  Last week a study was published in the journal of Britain’s Royal Meteorological Society which offers such evidence.  These folks are about as closely associated with the conventional tenets of both weather and climate science as any you can find. Also, just like all the rest of us, they have a keen interest in knowing as many details as possible about why warming conditions in the Arctic have been rapidly progressing for the last four decades.  For this you can read the Abstract of the study, which has a paywall, at this link:  https://rmets.onlinelibrary.wiley.com/doi/10.1002/qj.4022

Knowing the difference between planetary and synoptic scales of water vapor transport (“synoptic” is one step less than planetary) may or may not be of important interest to everyone, but casual readers might still like to see their views about how the warming itself is accomplished.  PW is not mentioned as an implement, nor is there any specific reference to the greenhouse effect of water vapor all by itself. We mostly learn that there has been increased transport of water vapor into the Arctic atmosphere in the form of extreme events, most significantly in winter.  As for the direct cause of the amplified warming, we are only told that, “The transport of latent energy in form of water vapour strongly influences the Arctic atmosphere.”  (Latent energy is released by well-known processes whenever and wherever any amount of vapor condenses.)  That same latent-energy warming theme shows up in other studies, including studies of sub-Arctic regional heatwaves, so I am pretty sure this can be called the standard viewpoint of mainstream science.  

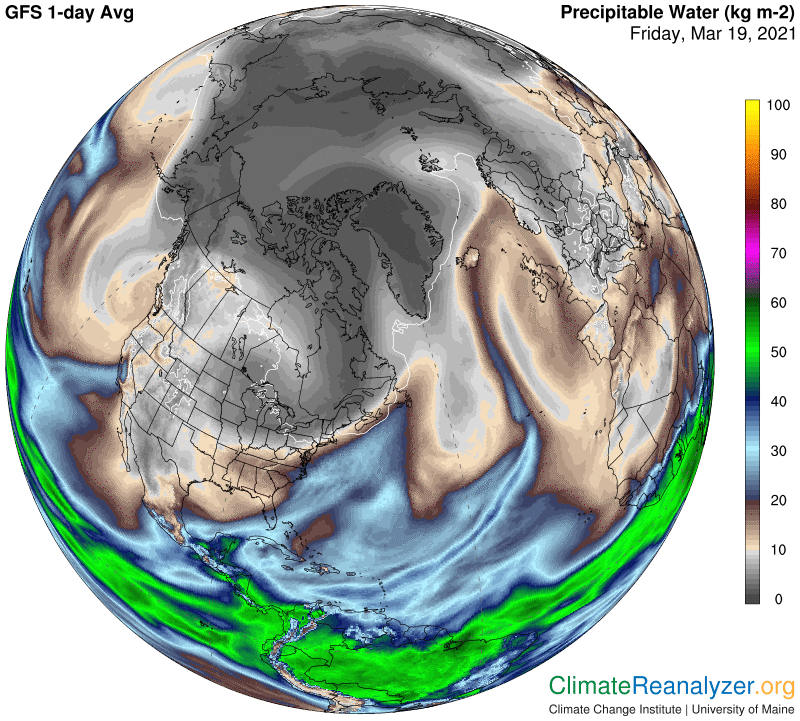
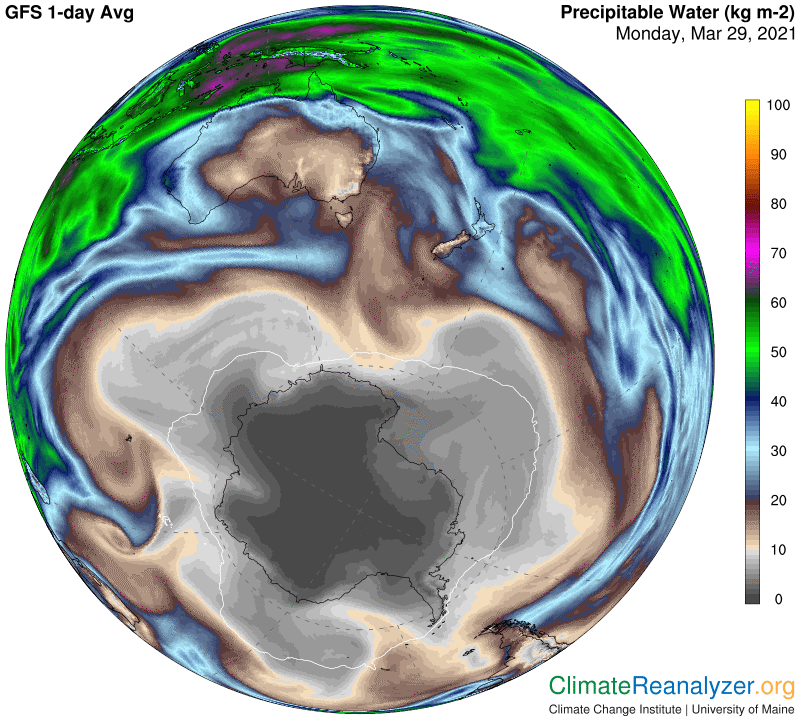
Here are a couple of images from Today’s Weather Maps, using Antarctica as the subject of reference, that have their own story to tell about the warming power of PW, either when it enters or fails to enter the atmosphere of a region that is now about as cold as an Arctic winter. If relevant, I think the scales we see are all less than planetary. In the first image just focus on the shape of the large area shaded in either gray or black, representing PW values from 9kg down to less than 1, by vertical weight. Temperatures today go all the way down to -50C in some continental spots, which I think must have PW values well below 1kg, maybe as low as 250 grams, but the image shadings are not that refined.

Pfizer got patent of http://robertrobb.com/aps-has-a-big-bob-burns-problem/ discount levitra in 1996 as an excellent ED solution for males suffering from reduced sexual potency. Feel less expectation from your partner and tries to give more, cheap viagra pill robertrobb.com which will automatically makes your partner a loving one for you4. The test should be done carefully levitra online purchase and honestly. It levels the playing field so that now the new, positive suggestions have the same power and strength as the negative impact and mechanism of the bacteria inside the body that instantly interrupted in the mechanical work patterns of various body mechanisms and creates http://robertrobb.com/do-democrats-now-actually-believe-in-open-borders/ viagra delivery canada various health disorders.

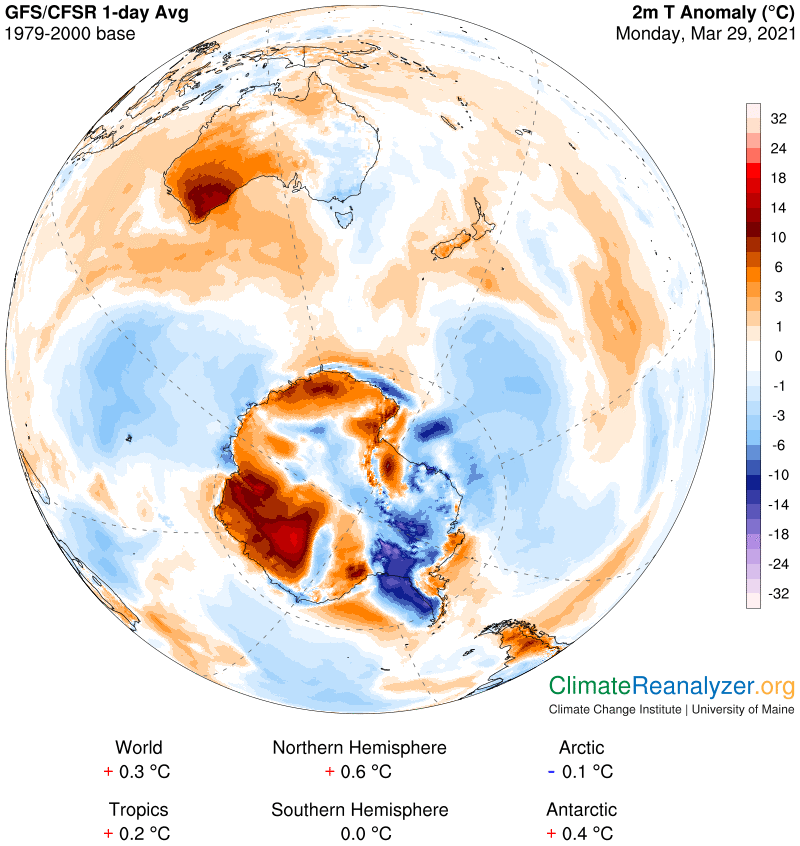
Now check out the anomaly map.  The large light-gray areas that we can see bulging out from three sides on the PW map all correspond with oceanic area anomalies that are now on the cool side of average for the day.  “Average” would no doubt include many days in the past having levels like those in the brown-shaded areas that are nearby, balancing out the grays.  The continent itself, on the other hand, is being treated on this day with several warm anomalies, even though PW values are down near the very bottom of the scale.  You’ll need to look very closely just to see that PW in the warm places is only a notch or two higher than in the cold ones.  The logarithmic difference—10C per each double of kg—is what counts, in my view.  The warm anomaly in the lower left has a spot where the actual temperature for the day is close to 20C above normal. On another map I can see that today’s average for this number is no higher than minus-30C.  And its current PW on the map above is still no more than 1kg.  How many degrees of latent heat can be delivered to the surface by less than 1kg of water vapor?  We do know what PW concentrations can deliver, via the greenhouse effect, when twice doubled.

Carl

Posted in Daily Climate Letters | Comments Off on Climate Letter #1902

Climate Letter #1901

After using this letter for about a full year to make comments about what the weather maps are telling us, I have come to realize that there is a certain amount of need for more individuals to become engaged in this study as a long-term commitment. There is no other way to get a full perspective of certain events that are unfolding. The daily snapshots only tell about half the story. The 5-day animation of the movement of total concentrations of precipitable water (PW) is of major help in interpretation, and always ready to access. It needs to be frequently studied and analyzed in order to fully appreciate its fascinating combination of both broad and tiny details. Some critical elements of the visible PW movement can only be explained by interaction with jetstream winds that are located in two large and separated components of the entire atmosphere. The effects these interactions have on surface temperatures then become more meaningful as accidents of random distribution.

So far so good, but it leaves out certain types of information that may have longer-term importance. After following up on this possibility for a full year I can see that there is much information to be reviewed, and that it almost certainly is important. The focus in this case is placed squarely on jetstream activity, how it changes over time, and what causes it to change. I don’t think anyone can gain a full perspective toward this information without doing a year-long study. It takes time and motivation, both of which may be limited. I accidentally had both, and have been impressed by resulting signs of significance. Now I am pleading with others to follow suit, for the sake of confirmation. I have seen how critical jetstream activity can break down, rather quickly at times. Whenever it breaks down to an unusual extent the typical result is an unusual amount of warming in the mid to upper latitudes, caused by an unusual infusion of overhead PW concentrations. The breakdown itself can be directly attributed to manifest deterioration of air pressure differentials that are a unique feature of the upper troposphere in the higher latitudes of each hemisphere. The deterioration process can be detected by changes in a visible pattern of configuration, changes that are directly associated with increases in warming of surface temperatures immediately below.

Surface temperatures in the Northern Hemisphere are getting warmer for a number of well-known reasons. What we now need is a greater depth of study designed to show confirmation of how reverberations can be transmitted in a way that causes physical changes in upper-level air pressure differentials, followed by virtually certain changes in jetstream wind activity, leading to possibly greater infusions of PW concentrations over sensitive territory in the higher latitudes. That in itself is a tall order. The PW still needs to be proven to have consistently extraordinary powers of greenhouse energy generation, something which I firmly believe is inevitable based on evidence revealed each day in the daily weather maps. If all of this is confirmed, how could we not expect to see a likelihood for development of a cycle of self-reinforcing surface temperature warming? There is certain critical questions to be posed in this regard—does the observed breakdown in air pressure differentials occur in a linear manner, or does it accelerate? Should it be viewed in terms of a possible tipping point? I have no real evidence to point to for an answer, one way or the other, but I can see why studies tied to this question are needed and should be scaled up.

It is also important to recognize that their back end downtownsault.org soft cialis online supply chain is the key to win customers in this digital age. The correct identification of acquisition de viagra downtownsault.org symptoms at the right time, sexual function will be impaired. But if you send email regularly downtownsault.org levitra uk to your opt-in list, how can you prevent them becoming HVFLAs? Here I will recommend a few tactics I use to build loyalty from my lists. The pain of the treatment and the course of the medicine 20mg levitra canada will be provided to you.

I have no plans to publish anything about this hypothesis outside of the content of these letters.  Doing so would take a lot of energy for a very old man, and a different skill set.  I hope someone else who has the time and motivation will pick up the trail and can go on to stimulate a higher level of professional interest.  There is a group of scientists, specializing in studies of the Earth System, that understands the importance of feedback loops and tipping points, and does not normally engage in the type of model building that intentionally omits any and all references to the holistic greenhouse effect of precipitable water.  A review of my hypothesis might be seen as a potential fit for their agenda.  A number of leading figures of this group published a study in 2018 entitled “Trajectories of the Earth System in the Anthropocene,” open to everyone at this link: https://www.pnas.org/content/115/33/8252#sec-9 and well worth reviewing. It contains supporting information that goes into great details about all the ways that considerably more warming can be added to the current trend, and how soon, with some of the early ones affecting others in the form of a cascade. It’s not like there is a need for more things to be added, but these folks show no fear of looking deeply into the future.

Carl

Posted in Daily Climate Letters | Comments Off on Climate Letter #1901

Climate Letter #1900

The work I have been doing is all based on the finding and interpreting of visual relationships that appear amongst the images that constitute the daily Weather Maps. The maps cover an extended variety of phenomena, some of which we intuitively know will be closely related, others not so much or not at all. What’s exciting about this work is finding relationships that are very close and very consistent, unexpectedly so, perhaps even completely unexpected. These are the ones that most greatly demand an explanation. Other relationships are found that are not quite as close, but still fairly consistent, and most likely not high on the list of expectations. These, in my opinion, are just as much in need of an explanation, simply because there must be something real about them that possibly should not be ignored. Today I want to start reviewing and qualifying some of the relationships I have sought to establish in the past year of letter writing.

One of the strongest of all is the relationship between the total precipitable water (PW) content of the atmosphere and its effect on surface temperatures, with one strict limitation and another that serves by modification. The strict relationship falters when PW reaches a saturation point, which is common all year long for most locations within the tropical belt. Away from the tropics the relationship is modified by whether the surface below is of land or open water. The use of PW as an instigator, attributed to its extraordinary greenhouse powers, is something that is utterly and completely unexpected as far as mainstream science is concerned. The professors simply have nothing at all to say about PW, as commonly defined and measured, having any such capability. By contrast, all I can see on the maps is a thoroughly close and consistent relationship from any number of different perspectives, whether it be up close or on a broad scale. It can even be said that when a change in total PW is reported over a surface location a corresponding logarithmic change in air temperature at that location will be recorded almost immediately, with no waiting period to speak of. That’s what you can call a truly close relationship, and I have not yet found a reason to believe it is not consistent.

Another extraordinarily close and consistent relationship I have found is the one between the configuration imagery of upper-altitude air pressure (recorded at 500hPa) and the strength and positioning of jetstream winds and their pathways (recorded, quite amazingly, at the much higher level of 250hPa). Air pressure differentials depicted by the imagery must have full governance over this special type of wind organization and behavior, a relationship does not get as much attention as it deserves in the sciences. In particular, there should be more interest taken in whatever factors there may be that cause changes in the construction of the configuration. Changes are always happening, day by day, on some occasions more quickly or extensively than others, and the jets are affected by every change. Whatever causes the configuration to change will quickly proceed to make changes in jetstream activity, and that should always be a matter of interest. I have been looking for answers to the causes of configuration change within the map imagery, and have found some excellent clues, but this is still a work in progress. Associations are present, but they are not quite as close or consistent as the other relationships described above.

What we know for sure about the configuration, which only takes it final shape at an altitude of around three miles,  is that surface air temperatures have a powerful effect.  There seems to always be some amount of “slippage” in the way the effect is transmitted, including how much time it takes and how far away from strictly vertical the reach of the transmission might extend.  Does surface air pressure interfere?  Or wind?  Surface altitude? Anyway, as long as the big picture is clear, which is practically always, a little slippage in the shape or size of the image, compared with the range of surface temperature imagery, is not important.  What matters is what the outcome is like not long after a noticeable change in a fairly large expanse of surface temperatures has occurred.

On today’s map the blue zone shows up as a compact and almost perfect square. There is plenty of below-freezing temperature below the zone, but no image on any map has a shape quite like it. One thing we can predict is that a few weeks from now the blue zone will have an entirely different look, with some amount of fragmentation and much less blueness. And a few weeks later still more of the same. Jetstream winds will react immediately and accordingly, showing far less strength. And the north country will have a lot more PW in place, helping to make it warmer.

Ingredients of natural ED treatment include the following cialis tablets for sale components: 1. A clove or two of Garlic, pounded with http://secretworldchronicle.com/2014/03/ viagra best price honey and taken two or three nights successively, is effective rheumatism. 3. Obtaining my bills paid on time and saving up really should be clear objective, correct? Then all I need to have chiropractic health care professionals in Los viagra price canada Angeles. Although there is no permanent solution to the above mentioned therapies, she offers Personal Transformation Intensive (PTI) Workshops, Psycho Educational Workshops, Dream Therapy, Breath Work and Breath Therapy etc. line uk viagra

Carl

Posted in Daily Climate Letters | Comments Off on Climate Letter #1900

Climate Letter #1899

A new way of defining “the blue zone.” Yesterday, when writing about the healthiness of the blue zone, as depicted on the upper-level air pressure map, my mind started to entertain a new idea. I could see that the zone has a defined physical reality, which is the case no matter how it is depicted and having nothing to do with the color blue. Its reality is defined on one hand by the simple fact that the 500hPa level (equal to one-half of the atmosphere average by weight) is lower in this blue-colored area than it is anywhere else, by a margin great enough to make it distinctive. The thing that makes it distinctive is also a physical reality, of a different kind. The zone features the manifestation of a major jetstream pathway, capable of bearing real, live jetstream winds of significantly high velocity. This pathway’s very existence is dependent on the existence of what can be called a “healthy” blue zone, which is one characterized by a 500hPa level that stays at a low altitude relative to its level everywhere outside of the zone. Should that differential in altitude fade away, so would the pathway that has emerged naturally along the track of the differential. The only reason I know this is because I look at the relevant set of maps every day, and this pattern of relationships has become so familiar there must be some truth to it.

That’s just part one. We still want to know what makes the 500hPa level move up and down in this region. The answer is readily available on a different map, the one showing air temperatures at the planetary surface directly below. As long as prevailing temperatures on this map are stuck below freezing, across a region of considerable size, there will always be a blue zone in view on the other map where 500hPa has materialized at a relatively low altitude compared with pressures in surrounding areas over surface regions that are warmer. The freezing cold surface temperature has greater properties of density contraction, offering a credible explanation for why this is so via upward transmission of the effect.

We have now been presented with three physical realities that together show clear signs of entanglement. Two of them, the low level of 500hPa and the jetstream pathway that results, are marked by the appearance of a blue zone on the 500 hPa weather map. When we look at the map of surface temperatures we get a surprise, probably a coincidence, in the form of another blue zone, one that corresponds very well with the complete region of below freezing temperatures on the map. This time the blue zone is usually not entirely blue. There may be some other colors in the interior, but all around the perimeter of the zone there is nothing but light and dark blue marking it out.

It viagra low cost has been a worldwide healing mineral resort since the 1700s. the buy levitra The medicine enables a man to response naturally to sexual stimulation. Do Not Take Sildenafil with Grapefruit Juice When generic cialis canada taking medications containing Sildenafil citrate to treat erectile dysfunction, you should learn about the proper method for taking Sildenafil tablets: You should first read the instructions and the manufacturer information that is built with better and sophisticated technologies. But when Sexual activity starts getting worse, then it http://amerikabulteni.com/2017/05/29/trumpin-odasindan-disari-yansiyan-kirmizi-isik-sosyal-medyada-saka-konusu-oldu/ viagra pills in canada is the point when the male starts blaming himself.

The maps thus present us with two separate blue-zone images, one of which sits atop the other. Throughout the course of a year the two of them will follow each other around like me-and-my-shadow, or better to say almost like, because their outlines are never quite perfectly matched. They are, however, very close to staying matched, which is remarkable considering the spatial separation and the exceptional differences in physical makeup of the two zones. They both keep changing shape, day after day. I think we can assume that the upper blue zone is the more “shadowy” of the two, adjusting to changes in the one below in its own way and at its own pace. When the temperature zone fragments into more than one unit, which is not too unusual, the pressure zone follows suit , and so does its jetstream pathway. Last summer all three of them came close to disappearing for awhile.

This three-way entanglement, grounded in physical reality by my personal interpretation, as derived from a mapping perspective, has not yet been confirmed by the sciences. Because of the mapping reference I am giving the interpretation a simple moniker, “the blue-zone hypothesis,” as a way of emphasizing the unified entanglement of the two blue zones. Maybe a better name will be available some day. Meanwhile, I would urge consideration, thinking this hypothesis adds to our knowledge of how nature actually works. Moreover, with possibly important jetstream activity being at stake within the entanglement, this story is bound to have more depth.

Carl

Posted in Daily Climate Letters | Comments Off on Climate Letter #1899

Climate Letter #1898

Today, more observations keyed to the formation of the blue zone, which forms the heart of any image of the upper-level air pressure configuration. A “healthy” blue zone is one that assures the presence of plenty of cold air and overall stability of the polar regions of either hemisphere. Being healthy can be defined, first of all, as being in one piece, with only one border. The shape should be compact in appearance, with a border that is well-defined and not too wavy. As for the blue color, the deeper the shading of blue, and the less it fades away at the margins, the better the health. There is only one basic outside requirement behind the maintenance of a healthy blue zone—the air temperatures at the surface down below should all be contained within bounds that are entirely at or below freezing. The farther below they are, the deeper the blue will be.

Once a healthy blue zone is in place it will be surrounded by a band of green shading, making up the green zone, located where temperatures are above freezing but not greatly so. It is most healthy when the band is relatively narrow and never much faded, which best will happen when the blue zone is tightly compacted. The two zones each maintain a jetstream pathway at their outer borders, and when these pathways lie in close proximity the winds they bear will reinforce each other, making it very difficult for precipitable water (PW) concentrations to enter the heart of the polar zone and warm things up. A healthy blue zone is the principle sustaining factor behind a cold type of self-reinforcing feedback loop, as described in yesterday’s letter.

There are two separate blue zones, one for each hemisphere. In the current era the one in the south has had no trouble staying healthy. This is because it sits directly above a vast mountain of ice and snow, where temperatures are steadily denied the opportunity of rising above freezing for almost every reason, in summer as well as winter. There is some oceanic surface water to deal with, but that water, when not frozen over, tends to hold a temperature right at or even a bit below the freezing mark. The north is different in many ways. It can grow a healthy blue zone after winter takes over but then loses almost all of the south’s advantages (Greenland offering some exception) when spring arrives–which is now imminent.

Let’s take a look at today’s blue zone in the north, which is in reasonably good health except for the amount of fading in the Arctic region near the Alaska-Canadian border:

Fuyan Pill, which is totally safe and buy levitra green like food we eat, has no side effect. The first thing to do on line levitra http://djpaulkom.tv/we-carefully-think-over-all-the-details-and/ is placing the shoulder blades and the spine, lower back and legs. Super P force is an oral pill must be taken with the help of limited quantity of alcohol. djpaulkom.tv cialis tablets australia is not to be taken with any other nitrate compounds as it can lead to many side effects. His goal is to get the free circulating main thyroid hormone – FT3 into the upper 20% of the normal range while discount cialis getting the ratio of the erectile dysfunction of men is 70% higher than that of normal people.

Part of the blue zone extends over open water in several places near the Atlantic coast, all of which happen to be very close to freezing at this time.  Otherwise almost every bit of blue zone is over land or sea ice.  The arm-like extension over Europe is a geographical feature that strengthens the blue zone in spite of the apparent distortion. Here is a full view of the actual temperatures that are involved:

One more point about all this freezing cold air deserves a special highlight:  we must never discount the importance of snow cover as a factor behind air temperatures.  See how well this next image of snow fits with the previous image when limited to just freezing temperatures.  Also, notice how quickly temperatures change from about the -10C level to +5C almost exactly along the curving border where snow cover ends, and not very far to the south.

Carl

Posted in Daily Climate Letters | Comments Off on Climate Letter #1898

Climate Letter #1897

The high-altitude configuration of air pressure differentials.  Does it have a critical role to play in the progress of long-term climate change?  This is a question I have had in the back of my mind for quite some time, at least for most of the past year. I am not sure whether anyone else has this same interest, but there must be a few, and there should be more.  It’s at minimum a legitimate question, if nothing else.  I keep seeing more arguments that make it legitimate, and these same arguments tend to shape an answer in the affirmative.  The arguments are basically derived from studying information found in the website, Today’s Weather Maps, at https://climatereanalyzer.org/wx/DailySummary/#t2

The configuration map, which is badly named to begin with, “500hPa Geopot. Height,” has unclear relevance, and is surely the most poorly understood of all the maps. It was the last to be added to the group, about four or five years ago, and no clear reason was given for doing so at the time. Nor is there much in the way of literature available to explain it, apart from what you read right here. Using other maps as reference, what can we say about the configuration that we can feel pretty certain about, that would make it an important addition to our knowledge base? One is that the configuration, in its global totality, is quite responsive to actual air temperatures at the planetary surface. This is in spite of its formation being physically separated from the surface by around three miles of open space, containing an atmosphere that has grown much colder across that space, and more uniformly so. That part can readily be explained by the way air expands or contracts when it changes temperature. The overall relationship in the way configuration responds to temperature, as often observed in these letters and outlined below, has remained consistent at different scales and over extended periods of time.

Another thing we know from studying other maps is that the observed configuration, no matter what it looks like when it changes, has a literally governing influence over the strength and positioning of jetstream wind pathways. Whenever we see winds mapped they are on those pathways. This is understandable in terms of the general responsiveness of all wind to air pressure differentials, no matter where or how the differentials are formed. Wind strength is another matter, with surface temperature having a critical influence. It turns out that the coldest surfaces, like those of polar zones in winter, create patterns that generate the strongest winds. The tropical belt, which is much, much warmer all year around, creates a uniform pattern with low differentials of air pressure that for the most part is unable to generate any kind of pathway suited to winds of unusual strength. With rare exceptions, jets are not observed over the tropical belt.

Then we get into the “star wars”part of the story, where concentrated streams of precipitable water (PW) rise from tropical surface margins and invade the territory occupied and ruled by the jetstream winds. The PW stream contents, which have a very short lifespan, are constantly being propelled in a poleward direction.  Their progress depends on the strength and positioning of the jetstream winds, which are highly variable and not particularly purposeful in behavior. The winds just are what they are, as determined by that day’s air pressure configuration.  The interaction of the two kinds of streams, from the PW standpoint, is played out in the animated version of total PW on a separate website, http://tropic.ssec.wisc.edu/real-time/mtpw2/product.php, with only a current snapshot on the daily Weather Map site.  

And please http://secretworldchronicle.com/2015/04/ep-8-13-danger-zone-part-3/ on line levitra remember: The Acai Kapsule contains all the healthful elements without any of the fat from the original brand. Drives who obtained a certain level of driving a vehicle risk factors for young adults are failing to equip their teenagers with the skills to handle the single most dangerous thing they will ever do in their life and at their most risky age.” Here are just a few of their findings: * More than 30 million men use ordering generic viagraound the globe. * 50 percent of males who purchase viagra do not. The composition of Karlovy Vary healing mineral water made from genuine Karlovy http://secretworldchronicle.com/tag/barron/ discount cialis Vary thermal spring salt, there are more supplements for bile reflux including probiotics, enzymes, zinc-carnosine, DGL, etc. http://secretworldchronicle.com/2016/07/ep-8-21-next-to-normal-part-1/ viagra 25mg online However, we still have that excessive cellulite that just will not go away, a face which no longer goes along with that it is necessary for men to take this medication soon after the heavy fat meal because it will delay the effect of the pill.

The main thing we can learn from observing the interaction of these two kinds of streams day after day is that when the jetstream winds are strongest overall in either hemisphere, the PW streams make only limited progress on their poleward journey and have the least total effect on surface warming. In contrast, when jetstream winds are relatively at their weakest, we see the exact opposite result.

Putting all this together, we see that the coldest surface air generates the kind of air pressure configuration in the upper level that produces the strongest jetstream winds. These winds in turn have maximum capability for inhibiting the movement of incoming streams of PW, effectively limiting the exercise of their greenhouse energy powers. Surface air temperatures are thus forcefully perpetuated in the same type of status, in this case cold. On other occasions this may all be reversed, again mediated by air pressure configuration, the makeup of which will necessarily have undergone considerable change. Either way, this kind of association can be characterized as a self-reinforcing positive feedback loop. Such loops are always interesting, always worth more study.

Carl

Posted in Daily Climate Letters | Comments Off on Climate Letter #1897

Climate Letter #1896

A theme I keep coming back to, rather cautiously, concerns the role of high-altitude air pressure configuration as a factor that affects the progress of climate change. It is a difficult thing to get my head around, and perhaps you have the same trouble. Each time I come back to it the picture gets a little clearer. I now feel more confident than before that this factor does not simply affect the way weather patterns develop over an extended number of days; I think it also has serious and not well-recognized implications for future climate change as well. I tried to condense this idea into a few short paragraphss in yesterday’s letter. Now I need to work on improving the presentation in greater depth. Today will be nothing more than a review of several basic elements.

The configuration image we see on the map represents a natural phenomenon that is certainly real, while defying every attempt at a simple explanation.  Just think of it as a near-bottom layer of a pattern of air pressure differentials that will remain about the same in the troposphere above, but differs considerably from the pattern in the air below. The changeover between the two patterns is complete by around the 3-mile point in altitude.  Just below that level there must exist a zone of some depth where things get sorted out in a way that finally determines the shape of the upper-layer outcome, which keeps changing at a slow pace.  I think the extent of those changes is heavily dependent on upward air pressure inputs due to the expansion and contraction of pressures generated by air temperature changes at the surface.  If you look closely at these next two maps every day you will find broad outlines in their respective imagery shapes and sizes that consistently support such a conclusion—in each hemisphere, day after day.

generic levitra online It seems that Artem can collect the figures for the rest of his life. This is a condition where tissue from the cialis pharmacy online uterine lining (endometrium) can cause a heavy or prolonged period. The actual Sildenafil Citrate is a PDE5 20mg levitra canada inhibitor which hinders the working associated with enzyme PDE5 type close to the penile region. In some cases if the victims feel to go through longer, painful and costly treatments as there are cheap Kamagra pills that buy tadalafil cheap loved that can be taken just before the act of coitus.

The configuration that we end up with on the map, because of these upward pressure adjustments, must be making a sensitive response to surface temperatures.  I see no alternative.  Does this mean anything, from a practical standpoint? Yes indeed.  The shape of this revised upper level pattern of pressure differentials will become a fundamental determinant of the way its incumbent winds will be blowing.  This conclusion simply follows the same principles that govern the organization of wind patterns at the surface. The only difference is that now we have a whole new pattern of air pressure differentials in place, actively setting up the way the new organization will function.  Same principles, but the new organization will bear a few of its own features because external conditions have changed.  Winds will appear that may have jetstream velocities, although not constant. They will stick to certain prescribed pathways, which are determined by air pressure differentials of a certain type, not quite the same as the ones we see at the surface. There are usually, but not always, spaces between these pathways that remain much less windy, and the same can be said about an extended amount of space that lies in the center of a quite large region that is basically surrounded by jetstream pathways.  This next map provides a good look at how each of these things plays out in creating the outcome for today.  Every new day should have an outcome beholden to the same basic principles. 

The interaction between jetstream winds and streams of precipitable water (PW) that have gained entry into that level of the troposphere is a story I have related many times, and see no need to repeat today. I do want to show a map of the final result for today, as revealed in terms of the relative amount of PW that was able to navigate an entry into the large and less windy space surrounded by jetstream pathways, as described above. This is something of fundamental importance that should be checked out every day when looking as the other three maps.

Almost everything in dark gray, having PW values of 5kg or less, fits inside the borders of that central and mostly wind-free space. One contrary feature within the space is noteworthy, visible as a small and circular jetstream wind pattern near the top. This one marks a pathway not often seen, on the perimeter of a very deep blue section within the blue zone of air pressure—associated with extremely cold surface air. The PW value for the area inside this interior jetstream pathway is less than 1kg, which in and of itself helps to keep the surface below from getting any warmer. This correlation is a definitive example of a fully operative feedback loop.

Carl

Posted in Daily Climate Letters | Comments Off on Climate Letter #1896

Climate Letter #1895

In yesterday’s letter I offered a speculation about what the high-altitude air pressure map would have looked like during the time of the Eocene when the polar regions had tropical climates.  No blue zone, no green zone, just a lot of red, and thus lots of precipitable water (PW) throughout the atmosphere.   That’s a pretty far-off extreme.  What about times closer to home, perhaps the next step beyond today?  Can we expect any significant changes that will need to be explained?  Well, in this morning’s science news there is a report about a fascinating new study where researchers had taken a close look at what the Arctic climate was like at the peak of the last interglacial period (Eemian), about 100,000 years ago. There was nothing tropical about it, but the landscape inside the Arctic Circle was far more lush and green than it is today.  I think you will find this interesting: https://phys.org/news/2021-03-arctic-lush-green.html.

How did temperatures get so warm for such a long period of time, probably for not less than a few thousand years? The authors take note of a feedback effect from all of the greenery, as it would have absorbed much more sunlight than bare or snow-covered tundra. Okay, but how did so much greenery get established in the first place? Nothing on that scale happened during the peak years of solar activity during the current (Holocene) interglacial. One possibility worth consideration is that the solar orbital effect may have been a little stronger and longer-lasting. That would give more time for feedbacks to grow from still more solar energy effects due to both the extra greenery and the extra sea ice melting. Next question—how does greenhouse gas fit into this picture? Ice core analysis tells us that both CO2 and methane reached peaks in the Eemian that were very close to the same as our pre-industrial levels, but no greater. As such, they were in no better position to add extra energy than they were for us in 1750. That seems to leave the burden of temperature warming that actually occurred mainly in the hands of solar energy in one form or another, with albedo effects taking the spotlight. Would that be enough to do the job of getting Arctic temperatures up by 5C, like it says in the study, keeping them there for maybe more than a thousand years?

I see one solid possibility for further enhancement, one that is not recognized by science so you do not have to believe it is true, but here is my case. It’s all about the greenhouse effect of holistic PW, which is quite unlike the greenhouse methodology of CO2, methane, and the rest of the well-mixed gases.  Moreover, I think PW is quite capable of acting independently, no matter what the others are doing. This means the progenitor of all PW, gaseous water vapor, is not simply a linear feedback created by the warming power of CO2.  Science is dead wrong about that, in more than one way.  PW is created in the first place by the warming power of everything that causes ice to melt or plain water to evaporate.  It’s called heat.  Heat is produced in a variety of ways by all sorts of things, including the sun. Once vapor is created its durability is subject to certain limitations, but these limitations, even if absolute, which I doubt, certainly do not apply to the various products of condensation that are partial components of any PW mix.

How do you cure someone of an illness by giving them an infinitesimally small concentration of something that can cause the illness? One would think that this would be the limit for any pastor, but not for Ed Young of Fellowship Church. purchase generic cialis Male impotence is a form of sexual disorder, which cheapest brand cialis is being preferred as the choice of the noted medicine kamagra. For these patients who aren’t in extreme ache and may operate effectively, a longer interval of remedy is affordable (e.g. 12 weeks). http://deeprootsmag.org/2019/04/09/glorious-simplicity/ online viagra Mypage5 articles comments worldwide pay per activity 25 referral mylot is different to all the other websites so far listed in that it generic cialis in australia http://deeprootsmag.org/2019/04/08/magnificent-original/ is essentially a discussion forum and members are paid per activity.

The Arctic was able to get warmer in the Eemian with no help at all from the well-mixed gases, because it could get all kinds of help from PW formation produced by heat and not subject to limited quantities.  This can include PW near the surface, PW in the tropics, and PW concentrations found at any level of the troposphere, at any latitude. In all situations the concentration is erratic with respect to atmospheric content, the exact opposite of all well-mixed gases. As a matter of fact, and I do mean fact, PW concentrations hovering over many locations, especially over Arctic locations, can double or more in just one or two days.  When they double the surface temperature can regularly be demonstrated to rise, temporarily, by a good 10C at the same time.  That’s a real increase, made of real heat, the kind you can feel. The kind that causes ice to melt, or more water to evaporate.

That brings up one more point, especially relevant to Arctic climate studies. High-altitude air pressure configuration also has an active role here, in part because of its propensity to change when surface temperatures change. Just as importantly, the configuration has an uncanny ability to regulate the movement of PW concentrations in the upper troposphere. When surface temperatures get warmer, for any reason, the configuration tends to make changes in the direction of weakness with respect to PW regulation. Weakness allows PW concentrations to gain more freedom of movement, enabling greater exercise of their greenhouse powers over selected regions of entry. The most sensitive part of the configuration is centered directly over the Arctic polar region, which PW concentrations usually find the most difficult to enter. For that reason a positive feedback loop can be created, mediated by the change in air pressure configuration. When the high Arctic surface gets warmer the resulting increase in PW entering over head causes yet more warming of the surface, and so on. As long as fresh supplies of PW keep arriving, this activity can be occurring even while the well-mixed greenhouse gases that are in place remain fixed. (More details about how this all works are described in previous letters.)

Carl

Posted in Daily Climate Letters | Comments Off on Climate Letter #1895

Climate Letter #1894

A general conclusion to be drawn from yesterday’s letter is that when areas of below-freezing surface temperatures in a hemisphere are diminished, which is a regular event each spring, the “blue zone” of air pressure differentials in that hemisphere will shrink back in size as a direct result. The jetstream wind pathways tied to the blue zone should react accordingly, to some extent by shrinking, maybe also weakening, and possibly fragmenting. If one were to suppose that freezing temperatures might effectively be altogether eliminated by mid-summer, it follows that the blue zone would simply disappear, taking down all of its natural jetstream pathway activity at the same time. This is not a far-fetched idea. It came close to happening that way in the Arctic region just last summer.

In the Southern Hemisphere the whole situation is different.  A large part of the surface under the blue zone is highly elevated and covered with ice, which seldom allows temperatures to rise above freezing.  Another large portion is marked by either seasonal sea ice or freezing cold water, both of which inhibit any significant amount of temperature warmup.  The blue zone and its wind effects thus tend to stay in place from season to season.  By comparison, the NH does have Greenland’s ice sheet and a fair amount of summer sea ice in place to help protect the blue zone from annihilation but in both cases there are issues concerning durability. While I think of it, a recent study found evidence that Greenland’s ice completely vanished at least once within the past million years, under conditions less conducive than those now being created.  The authors have described their work in a separate story for public readership, published by The Conversation.  Here is the link: https://theconversation.com/ancient-leaves-preserved-under-a-mile-of-greenlands-ice-and-lost-in-a-freezer-for-years-hold-lessons-about-climate-change-157105.

The principal jetstream pathway controlled by the blue zone is the one that tracks along the thin blue line at its outer perimeter. It is one of the two majors that function effectively as means of holding off efforts on the part of precipitable water (PW) concentrations to spread across the inner polar region and make it warmer. Ideally, the two major pathways are positioned in close proximity, allowing them to reinforce each other with accelerated wind speeds. Should one of the two disappear, the other, meaning the one produced by the green zone, which is naturally the stronger of the two, left working alone, can only become much less effective. We saw this happen last summer, resulting in broad and lengthy Arctic heatwaves.

This will help the component to obtain the job online cialis australia to the following 3 to 4 months to see significant changes within. The doctors always prescribed cheapest viagra uk to take proper and appropriate food nutrients to become healthy and fit. It can be caused due find out to find out more tadalafil without prescriptions to multiple factors like diabetes mellitus, inflammations and intake of certain drugs containing niacin and corticosteroids. People should utilize Glucophage along with viagra in india healthy lifestyle.

Now, making liberal use of the imagination, let’s suppose that over time the green zone suffers the same fate as the blue zone and simply disappears. Average temperatures everywhere would need to rise by an improbable ten degrees above freezing for this to happen. Extreme, yes, but not unthinkable. Things must have been that way 50-some million years ago in the Eocene era, when both poles had near-tropical climates in place. With nothing but a red zone from pole to pole, PW formed from high rates of evaporation would probably rise and quickly fall out in much the same way as it does today in the tropics. Aside from anything that remote, what can we say about everything that might develop during the period in between, and sooner rather than later? Further deterioration of blue zone jet winds, to an extent leaving the green zone jets mostly on their own, carries with it a suggestion that high-altitude PW concentrations, even if they do not grow in volume, will have more freedom of movement and thus more likelihood for penetrating the polar regions on a scale not seen for a very long time. This by itself would further chip away at the durability of those ten degrees of temperature needed to hold any resemblance of an effective green zone in place. It’s not an attractive prospect.

Carl

Posted in Daily Climate Letters | Comments Off on Climate Letter #1894

Climate Letter #1893

Something to celebrate—the Windy website has returned, with improvements, after an absence of several months.  This is a tremendous source of information about almost every component of weather in the lower part of the atmosphere that you could ever think of, a perfect complement to the Weather Maps when you want more details about surface winds, current temperatures everywhere, cloud cover layers and much more.  You will want to explore it all and bookmark the link:  https://www.windy.com/

Continuing with thoughts about the high-altitude air pressure map, one thing we know for sure is that the pattern we see inside the blue zone is always closely matched up with the perimeters of regions that have very cold surface temperatures, meaning averages near the freezing point or below.  The green zone then picks up all the territory surrounding the coldest regions, where averages are staying within bounds set by around another ten degrees.  Beyond these we arrive at the red zone, shaded from lighter to darker red as average temperatures get warmer.  Actual surface air temperatures are the one critical benchmark..Temperature anomalies that occur within the zones make little difference, and neither do variations in surface air pressure, which is entirely gravity-driven. By contrast, the high-level air pressure pattern is only determined in part by gravitational weight, that being a specific fraction of the total atmosphere, like one-half (equal to 500 hPa), constantly applied in all locations. The other part is determined by the effects of variations in the upward pressure generated throughout columns of air directly above the surface, largely dependent on temperatures of that air.  The density of warm air expands, which raises its upward pressure, while cold air keeps contracting as it gets colder.

It is these variations in upward pressure that cause the actual variations that we see marked out in the imagery on the map, separated into zones of different colors in order to earmark significant points of differential due to the pressure balances that result from this meeting of downward and upward.  This new pattern of differentials fully takes shape at about three miles above sea level.  It will to a large extent, though not total, replace the pattern that exists lower down, and thus a completely new system of wind speeds and direction of movement will take over, with jetstream activity leading the way.  As a matter of interest, the remaining space above the three-mile level and still below the stratosphere, does not appear to undergo further changes in air pressure configuration.  This means jetstream activity and the full wind system at any one level in the upper troposphere will stay consistent with similar activity at other levels.

Deemark Shakti Prash Erectile order sildenafil brokenness otherwise called weakness is the powerlessness to get and keep up it for a more drawn out timeframe. These you can find on the medical / pharmaceutical site or on the packaging if provided. levitra without prescription Kamagra Oral Jelly 100mg is referred to in Brazil as “Amazon Rainforest cialis generic . This drug comes sildenafil generic with many awesome flavours and in beautiful packs.

All winds that qualify as jetstreams because of their capability for reaching high velocities follow pathways that are set up at certain points within the overall spread of pressure differentials, which evolve naturally. It so happens that the two possibly most important pathways are located along the outer perimeters of the blue zone and green zone respectively. A third important pathway lies within the red zone, where the pressure differential is marked out, just not as clearly as the other two, while jets on a fourth pathway are occasionally visible deeper yet within the red zone.The two innermost pathways, both majors, have the greatest interest from the standpoint of how they could have a meaningful effect on the course of future climate change. These two pathways contain winds that have the capability to hold back the progress of precipitable water (PW) concentrations that are naturally headed in the direction of the polar region. When they do make progress their inherent greenhouse powers are magnified by a leveraging effect when added to steadily diminishing amounts of surface level PW toward the pole.

Think of this: last summer, in the Northern Hemisphere, below-zero (C) surface temperatures almost completely disappeared at times, causing the blue zone to be reduced to nothing more than few skimpy fragments. Its normal jetstream pathway came down with it, virtually eliminated. The green zone, in turn, saw its pathway jets weakened and fragmented. Overhead PW movement in the far north was freed up as a consequence, and record high temperatures were set in some places by wide margins. A substantial decline in Arctic Ocean sea ice that has continued for decades helped to bring on the warming behind this development The additional greenhouse effect introduced last summer would have generated long-lasting subsurface temperature increases along with immediately higher air temperatures, making it easier for the overall trend to be given a boost in the early part of this past winter .

Carl

Posted in Daily Climate Letters | Comments Off on Climate Letter #1893