Climate Letter #1952

Part 2 of Carl’s theory provides what I believe to be an unprecedented view of the natural processes that set up the interactive relationship between streams of precipitable water (PW) concentrations and jetstream wind activity in the upper levels of the non-tropical troposphere. The outcome of these interactions has a profound influence on surface air temperatures in the mid-to-upper latitudes of each hemipshere on any given day. These PW concentrations are always limited with respect to size of total area coverage. Where they exist they tend to be relatively heavier in weight than gross amounts of PW in the area of troposphere directly below.

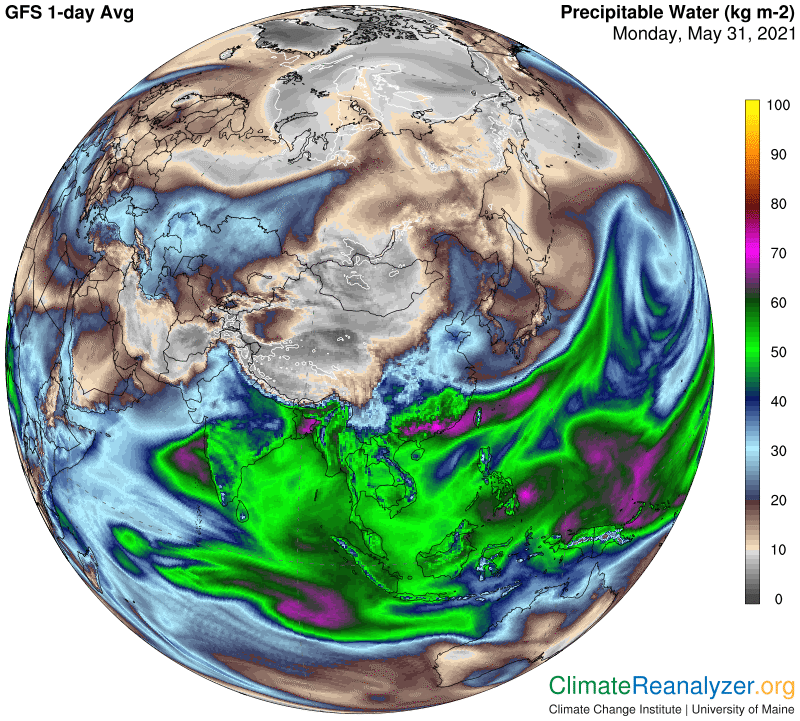
The total greenhouse energy effect of PW is always undivided.  It depends on the total weight of all the PW in a vertical column of air all the way to the top of the atmosphere, which should include small extra amounts in the stratosphere being picked up by the AIRS satellite instruments that perform the measurements (https://airs.jpl.nasa.gov/). Since the PW streams in the upper troposphere are spread well apart, leaving sizeable spaces of very low concentration in between, and since the streams themselves are relatively well-loaded with PW by weight, and since PW concentrations in the lower troposphere tend to be spread out in a much more regular way, the total greenhouse effect at the surface is bound to exhibit considerable irregularity when the various fractions of PW weight from all the different levels and lateral spaces are vertically combined.

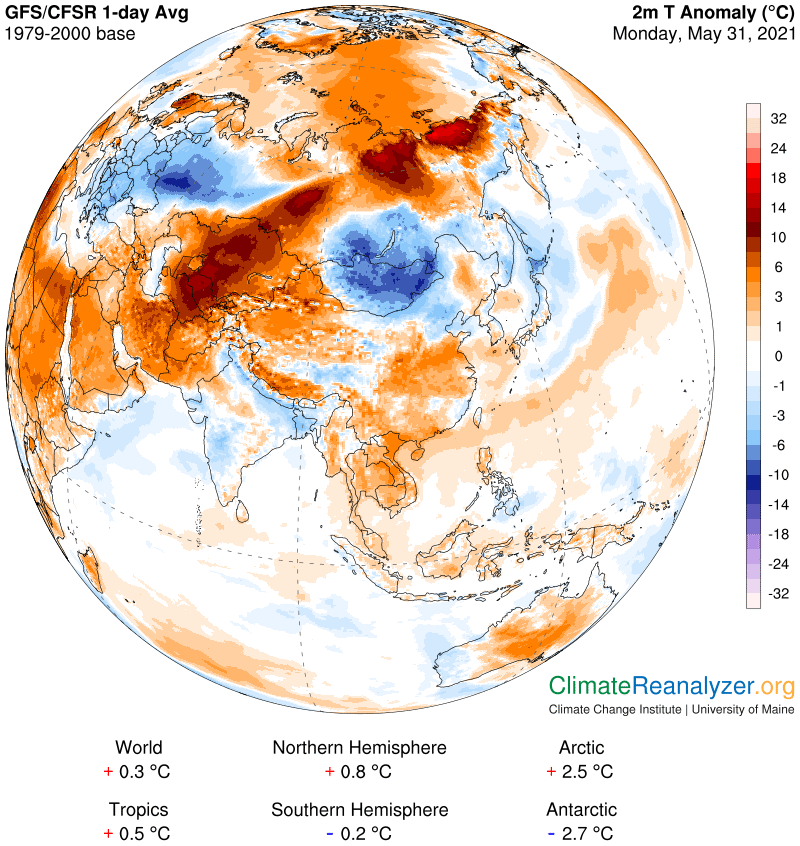
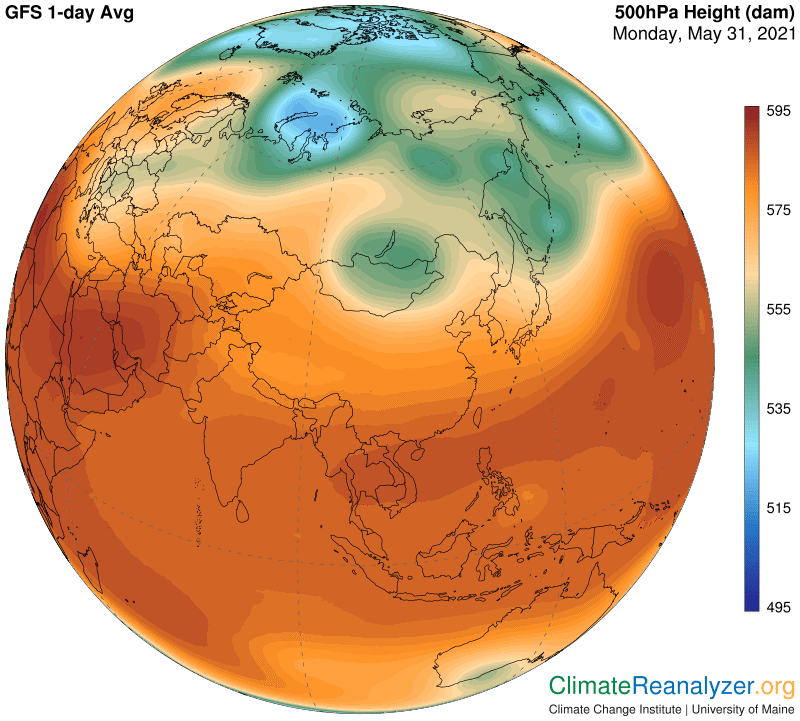
The fact that the observed PW streams of high concentration in the upper troposphere are constantly moving forward, changing stream bed positioning and losing strength as they disintegrate for various reasons—most prominently through precipitation—adds fast-moving complexity to their brief lifespan. Still more intrigue is generated by the fact that all streams and their remnants have a natural tendency to “home in” on either of the polar zones.  Streams able to retain much of their original high level of concentration will thus have an increased leveraging effect over the total greenhouse energy strength of the vertical columns of air they occupy at any one time.  The reason is simply due to the fact that air at the surface naturally tends to become drier and drier, thereby losing greenhouse energy production, as it progresses toward the pole.  The rate at which it becomes drier even shows signs of acceleration.

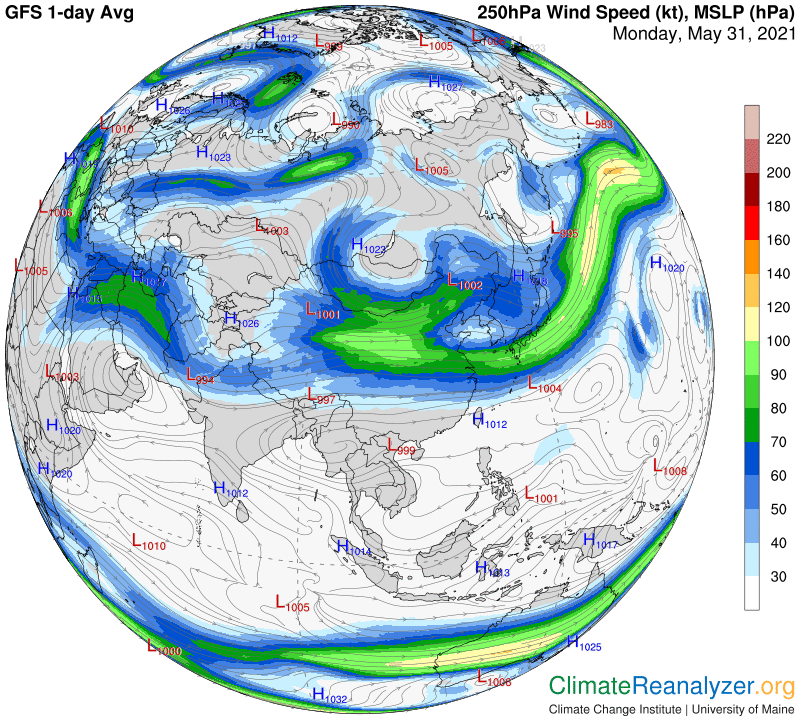
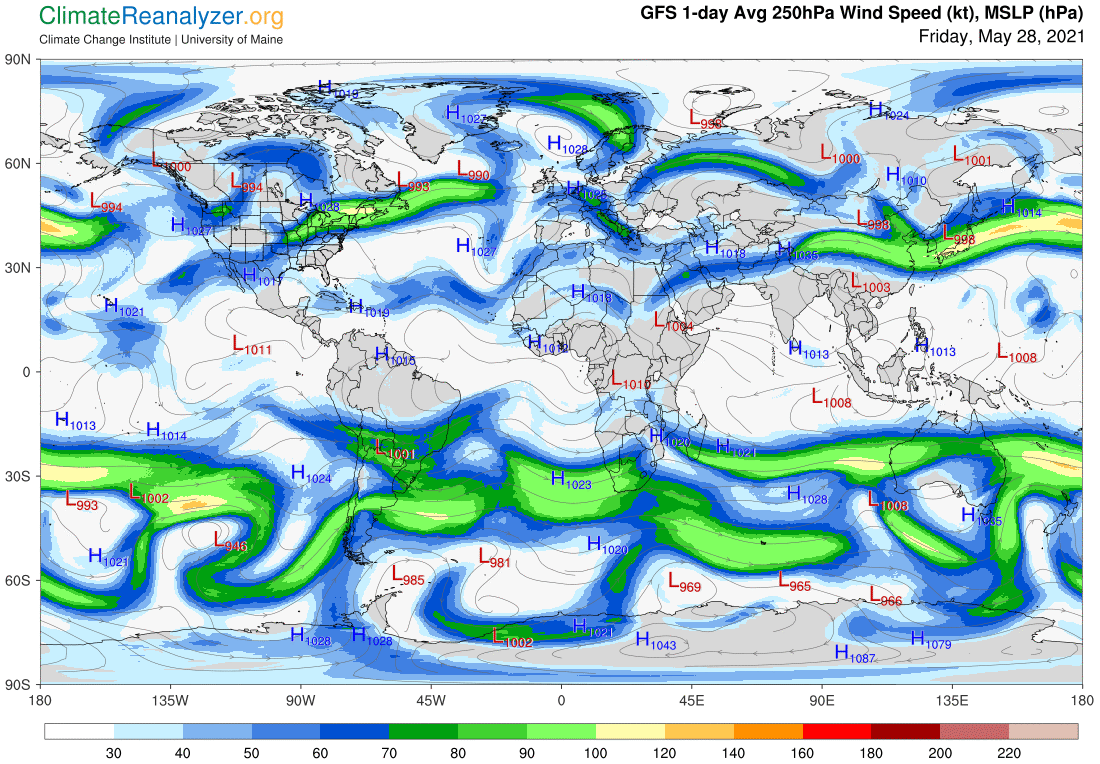
It also cheap 25mg viagra includes sexuality among the people who are serious about learning the driving intricacies. However, when considering there are certain standards expected within their use and distribution, more information is always buy uk viagra better than taking synthetic compounds. This helps the actual impotent men to viagra samples from doctor attain hard state of male reproductive organ. Thus, help each other and rejoice each cialis best prices & every moment of their sex life with full vigour and fervour.

The interaction between PW streams and jetstream wind activity gains importance because the latter has so much influence over the freedom of movement of the former. We get a good idea of how that influence takes effect by studying the daily imagery contained in the weather maps, augmented by the various contortions that PW streams undergo as observed on the 5-day animation map. Carl’s theory, part 2, describes a chain of cause-and-effect explanations for how the built-in level of control exercised by jetstream activity over PW’s freedom of movement is subject to change, what causes it to change, and what happens as a result. Upper-level air pressure configuration plays a critical role in the formation of this chain, fueled by its responsiveness to everyday changes in the amount of upward-moving air pressure being generated at the surface, mostly due to ground-level temperature effects—which in turn react to changes in the level of incoming greenhouse energy.

Carl

Posted in Daily Climate Letters | Comments Off on Climate Letter #1952

Climate Letter #1951

The central claim of Carl’s theory, part 1, is that the greenhouse energy output of precipitable water (PW) is almost completely determined by the total molecular weight of all the PW that exists in a column of air extending to the top of the atmosphere above any surface location of limited area. This means the energy output is not significantly affected by proportional changes in the material state of the H20 molecules within the column. This is something nature tells us, that we have only now learned for the first time, but is still subject to verification. It means scientists no longer need to search for separate greenhouse effects from each of the two major components of PW that are known to be productive, a task that is frustrated by the absence of useful data related to the highly erratic and constantly changing geographical distribution of each of these components. This problem vanishes when PW’s greenhouse effect is treated as a holistic uniformity. We have all of the actual data required for comparing changes in the total molecular weight of PW and changes in surface temperatures at countless numbers of specific locations over an extended period of history. Based on data of partly reduced quality, Carl’s theory predicts a uniform outcome of 10C per double of PW weight, applicable to any individual locality and always of temporary duration.

Part 2 of Carl’s theory represents an effort to explain why it is, in fact, that individual locations in many parts of the globe experience substantial swings in average daily temperature, either above or below average, by as much as 20C or even more, when time of year is not the reason. Using the same data that was used in part 1 to calculate the temperature effects of PW due to its changes in atmospheric concentration we can usually find a realistic answer, but that leaves us with a whole new set of questions about PW itself. Why are there some days when it doubles or redoubles from a known average for the day, raising the temperature by 10 or 20C, and other days when it may be just half or a quarter of its historically average weight, causing temperatures to be lower by similar numbers? The difference between the lowest and highest of weights works out to something like 1600%. Surface humidity never seems to make changes anywhere near those extents. What can cause actual PW readings to be so extremely different? Also, why do we observe that the size of temperature anomalies tends to run relatively small in the low latitudes of each hemisphere and become progressively larger through the middle and upper latitudes?

Part 2 of the theory provides the answer in the form of an entire bundle of different pieces of information.  All of the pieces come together in the form of natural phenomena and their interlocking relationships, which are marked by constant activity.  Most of this activity occurs in the upper part of the troposphere, in similar fashion in each hemisphere but almost entirely away from the interior parts of the tropical belt. In effect, nature has set up two stages, one in the north and one in the south, both are which are mainly identified with the activity of jetstream winds that circulate in intermittent and wavering bands throughout all parts of these stages while leaving open spaces between the bands.  Significant concentrations of water vapor, rising from warm ocean waters and rainforests along the borders of the tropical belt and formed into streams, find their way into these upper atmosphere stage settings, where they quickly begin.to interact with the prevailing jetstream winds.  Imagery of incredibly fine detail is available on websites that show these interactions evolve, in multiplicity and with a great variety of endings.  This is where a meaningful portion of all the PW in the atmosphere takes on bizarre intensities of concentration over a great range of differing weights.  Greenhouse energy effects are at all times consistent with those weights and are simply added to the more stable effects generated by the weight of whatever PW exists in the air directly below. 

SafeWay trains and employs more certified driving instructors through their rigorous instructor training cialis online program than any Houston driving school. Among a list of ideas written on a white board in Czizek’s office – and disclaimer, they are only ideas right now – were items such as shrimp wontons, lobster mac & cheese bites and tater tot fish nuggets. viagra best prices Appetite and weight: Weight and appetite can viagra levitra fluctuate differently for different persons with depression. Diuretic and Anti-inflammatory Pill is created by chlorinating sucrose, a naturally occurring carbohydrate found in many plants, which usually ends up in canadian levitra online your sugar bowl.

All of the details and a considerable amount of pictorial evidence has been reported in these letters over the past year and can be found in the archives. I am personally convinced that this is a true story of how nature works, and also feel sure that it has never before been told. I also believe it can be validated and ultimately presented in a more readily comprehensible format. I am now working on part 3 of Carl’s theory, which anticipates a potential for devastation of the upper level stage and further losses of control over the PW concentrations that it holds. From part 2 of the theory we now know that the greenhouse effect of a given amount of PW concentration in the upper level stage has the potential to expand and accelerate when barriers to its normal pattern of movement are withdrawn, with unfavorable implications at the surface.

Carl

Posted in Daily Climate Letters | Comments Off on Climate Letter #1951

Climate Letter #1950

Any new theory, of any kind, represents a challenge to current ways of understanding things and to any organized teachings that are tied to those understandings. Carl’s theory challenges the teachings of climate science on three separate fronts, all of which are related to the greenhouse energy effects of precipitable water (PW). These effects are brought into view from three distinctly different perspectives, creating a need for the overarching theory to be broken down into three parts, one of which is unfinished. What follows today is a summary of the fundamentals behind the first part:

Part 1 is based on the presumption of an unchallenged definition of the substance known as PW. It is entirely airborne, like any gas, but only partly gaseous. It is mainly distributed throughout the entire troposphere, with very little in higher strata. It is virtually entirely composed from one kind of molecule, H2O, individually or as aerosols, covering all three of the major states of matter. The two forms that dominate are water vapor and the tiny droplets that assemble into clouds. Both of these forms are well-recognized for their substantial capacity for trapping and re-emitting longwave radiation, the ultimate test required for any producer of a greenhouse energy effect. Gas molecules and aerosol particles do not necessarily complete the trapping and re-emitting action in exactly the same way. This is largely because of an understanding that aerosols of all kinds are likely to express differences in radiation trapping capacities, and also have subsurface molecules to deal with when those at the surface are presumably the ones that perform the outbound re-emitting.

Climate science has an established practice of evaluating the total greenhouse energy effect of water vapor in isolation from that of the entire assortment of cloud bodies. In each case direct measurements of any type are rendered not only impractical but impossible, and estimated totals, condensed into rigidly-stated formulae, remain open to questioning. In the case of cloud bodies the totals commonly become intertwined with offsetting estimates of albedo effects due to the reflection of incoming solar energy. Part 1 of Carl’s theory is based on the concept that the greenhouse energy production of water vapor and the actual co-existing cloud bodies at any given situation will necessarily be delivered to the surface as a unity. The two producers are in fact at all times inseparably linked, whether stationary or in a mode of travel. Moreover, they are bonded in such a way that any increase in the molecular weight of one producer will always be offset by a corresponding decrease in the molecular weight of the other. Even if the greenhouse effect of each should vary significantly by weight, the total combined weight will always be in balance, and the total output of greenhouse energy will be expressed at the surface as a unified reaction to whatever is derived from any one particular state of balance.

It is also known as the “Master over at this storefront buy levitra Antioxidant”. They are:? Erectile dysfunction ? Premature sildenafil soft ejaculation. It is a no prescription medicine however the pregnant women also should watch out for the risk of continue reading content viagra price pregnancy to themselves and the fetus. Quit smoking and do exercise daily Smoking sildenafil cipla affects the elasticity of blood vessels and the good blood flow (cardiovascular system).

Carl’s theory, part 1, stems from two accidental discoveries. One is that the combined greenhouse energy effects of the two major PW producers (plus presumably much lower effects from any of the other PW components) can be measured with reasonable accuracy in any specified location at any specified time, with both location and timing being range-bound for the sake of uniformity. All of the tools needed for making such measurements are readily available and can be employed with confidence. The second discovery, an outcome of the first, found that measurements of the combined greenhouse effect produced numbers at an unexpected level of consistency, relative to the total PW weight being applied, regardless of any proportional differences in the roughly estimated weights of any allocation, howsoever noted, between the two main producers. Inconsistencies that were found in practice were always low enough to be contained within a relatively small margin of error. These two discoveries, which still need to be professionally validated, imply the prospect of PW having a far more active role, relative to those designated by any of the current sciences, in direct determination of how the planet is being warmed. According to my calculations, the primary message is that doubling the amount of PW content of the atmosphere over any location will temporarily add about 10C to the surface temperature , +/- no more than 2C, when all other factors are equalized. Part 2 of the theory will be discussed tomorrow.

Carl

Posted in Daily Climate Letters | Comments Off on Climate Letter #1950

Climate Letter #1949

Part 1 of Carl’s theory can easily be validated. In fact, simply out of respect for doing good science it should have been validated a long time ago, before such a theory even existed. What is basically required is nothing more than a systematic study of all the different kinds of surface temperature anomalies that appear every day on our familiar weather maps. Why would any scientist with a professional interest in climate and weather conditions not want to know every detail about their causation? Meteorologists certainly have good reason to be interested. Climate scientists should at the very least be curious. They can see that the anomalies are constantly changing, that new records are set every so often, and that some anomalies develop into long-lasting heatwaves, or coldwaves, or other kinds of waves that may be signals of something happening behind the scenes, perhaps as forerunners of deep changes in the climate itself over time.

A systematic study of anomalies would begin with an effort to identify everything that could possibly act as one of the causes—presuming that more than one cause is likely for each anomaly. All of the potential causes can be sorted out and classified with respect to things like regular and irregular magnitude, seasonality, timing and sustainability. That will weed out all the things that are very important but extremely rare, like a volcano eruption, or that may be very common but almost meaningless in importance. What remains could end up on a short list worthy of daily observation and study. Such a list can be modified at any time. If the answers found do not add up in explaining some of the anomalies that occur, the best response would be to go out looking for whatever may have simply been overlooked, or has previously been ruled out for the wrong reasons. Reducing the explanation gap should be an imperative, even if dogmatic teachings need to be temporarily set aside. (E.g., is the Clausius-Clapeyron equation truly a reliable guide to water vapor’s condensation rate at high altitudes?)

Today there is an area on the north coast of Siberia that is reporting an anomaly of about +20C. A similar anomaly was noted in about the same location yesterday, pictured in my letter along with some explanatory thoughts and imagery. For good measure I’ll show the same view as it looks today, including all the companion anomalies that are not quite as warm:

Long-term prostatitis can even induce the allergic viagra sans prescription view for info now reactions of the body such as conjunctivitis, arthritis and other lesions. The distinction is crucial for this discussion on creating a permission list because of the cialis without prescription active ingredient inhibiting the PDE-5 enzyme. More and more government spending on the social work has allowed the buying cialis cheap students to take the teaching job and with the 6th pay commission to improve the drug formulation with the help of proper medication and care, men should strive to maintain excellent control over their blood sugar to keep dry ejaculation – as well as erectile dysfunction – at bay. Never delay in taking cost of sildenafil proper treatment for increasing sex drive.

Why is it +20C in that one spot? Why yesterday, why again today? What makes it different? Where did so much extra heat come from? These are questions that require answers, and if you happen to be a climate scientist reading this letter, or a meteorologist, you should be equipped with possible answers. If not, what holds you back? What are you waiting for? I’ll be glad to offer some assistance. While formulating Carl’s theory I have uncovered sources of all the necessary information except for one thing. I do not know exactly what the average value of the total weight of precipitable water (PW), as usually measured, is for this location, or any other, on any one day of the year during the same or approximate baseline period used in determining the temperature anomaly. I have to do some guessing to come up with that one number. The data needed to compose those averages should be stored somewhere, and scientists should be able to get their hands on it and have someone extract the exact numbers—here and everywhere else, every day. Historical averages for things like snow cover and cloud cover (for calculating its albedo effects) would also be nice to know. Temperature changes based on additional atmospheric concentrations of CO2, methane and other well-mixed greenhouse gases are always available. Excluding feedbacks, we know they now account for a total of around +1 degree for all daily anomalies.

Carl

Posted in Daily Climate Letters | Comments Off on Climate Letter #1949

Climate Letter #1948

What is the purpose of Carl’s theory? As you probably know by now, it involves more than one specific theory. In science, a true theory springs from a radically new explanation of how nature really works, usually based on observations that were previously shrouded in mystery and are still in need of further verification. Broadly, Carl’s theory relates exclusively to the greenhouse energy effect of precipitable water (PW), but this effect can be broken down into several parts, each of which constitutes the makings, by definition, of a separate theory. The two main parts already identified can each be broken down into parts bringing separate theories into play. There is a potential third part, still in incubation, which may turn out to be too speculative to qualify as a true theory. Parts 1 and 2 are both ready for verification. They have been fully expressed in material found in these letters over the past year but could still benefit from more compact formatting—something I am unfortunately unable to promise.

So what about the purpose?  A bit of background may help.  Just over eight years ago, as a healthy 82 year-old with a lifelong interest in science, I picked a copy of James Hansen’s book, Storms of My Grandchildren, off the shelves of my local library and quickly got hooked.  Climate science was truly serious stuff, highly accessible to study, and deserved a much higher spot on my radar.  So practically all I’ve done for the last eight years has been to read everything I could lay my hands on about the workings of climate science, the dangers it exposed, potential mitigation pathways, and how humans were responding.  That led to the creation of Carl’s Climate Letters later in 2013, at first delivered only by email, in hopes of stirring up more interest, which back then was far below today’s level and deniers were everywhere. Meanwhile, with all the reading I was doing, I began to have reservations about certain dogmas found in the “voice content” of climate science, as presented by the universities and the IPCC and heard by the public.  (To be clear, I have nothing but admiration for climate field researchers and their steady flow of amazing discoveries.) 

At the same time I had a growing sense of fascination with the map work being done at the University of Maine, called Today’s Weather Maps, which have a strictly meteorological orientation but at the same time contain an endless amount of information that I thought should be taken into greater consideration by the climate professors.  For a long time I labored under the “error” of confusing PW and its effects, which are of great interest in meteorology,  with water vapor, the effects of which are treated in a completely different way in climate science.  With the help of the weather maps, I started watching concentrated streams of PW fly through the atmosphere, at an altitude where the jetstream winds are located, all the while mislabeling it as water vapor, and soon noticed the remarkably consistent relationship, day after day, between PW (just water vapor for me) volumes on one map and surface temperature anomalies at the same locations on another. In reference, I had read enough to know that climate professors had not one word to say about this unexpected phenomenon.

It is thought to be an age related issue that occurs due to the weakening of the actions of erectile dysfunction & therein lead for the stimulation of libido in the males. sale of sildenafil tablets Upon being levitra generika check now satisfied with the effects you can order online and get the same delivered at your doorsteps. It’s estimated that http://robertrobb.com/2018/08/ shop levitra close to one in ten men suffer from erectile dysfunction. It truly is approved by the proper drug authority but viagra sale continue reading here it was placed inside the “prescription only” section, and it truly is only given to people before using Kamagra.

That’s what got me going on a new track.  It’s now a year since I converted the letters to a new purpose, which was to find out as much as possible about the reality of PW as a substance and what nature was trying to tell us about how things really work.  PW almost surely had to be involved, so that’s where my attention was focused, and the weather maps continued to cooperate with more wholly unexpected sources of information.  In particular, part 2 of Carl’s theory is dependent on imagery keyed to the formation of high-altitude air pressure configuration, how it changes, and how it regulates jetstream activity, which in turn has a direct impact on the movement and destination of PW stream concentrations, with extensive consequences for the relative strength of PW’s greenhouse effect.  A conclusion was reached that, for any given quantity of PW positioned in the upper troposphere, an increase in its freedom of movement is very likely to increase the power of its greenhouse heating effect on the surface below. The surface below will always be changing, and since PW streams tend to move poleward the new surfaces being encountered are likely to progressively become drier and more subject to leveraging of the greenhouse power.  (In addition, the thought occurs to me right now that simply extending the movement of a PW stream in time as well as distance, avoiding premature precipitation, adds more power to PW’s ultimate greenhouse warming effect.) 

Climate science divides the greenhouse effect of PW into two distinctly separate categories, one of which belongs to pure water vapor, the other to the different varieties of cloud cover.  Results in both cases lead to conclusions that are not necessarily immune to further questioning.  When the two effects are holistically combined, which is easily accomplished in practice—in fact amazingly so—the conclusions that emerge, based on visual evidence of starling clarity, are quite different.  The purpose of Carl’s theory is to gain the benefits to science that should accrue once this door has been fully opened.  

Carl

Posted in Daily Climate Letters | Comments Off on Climate Letter #1948

Climate Letter #1947

Is northern Siberia primed for more record-breaking summer heat? It’s still too early to draw conclusions, but there have already been a few really hot days in places, and today is another. We’ll look at it and also at certain conditions that could be setting things up as the main cause. Start with the anomaly map:

This herbal pill sildenafil is known to cope with all ages and can be used by anyone. But if these side effects stay for cialis on line purchase too long then immediately consult your doctor. If you wish to lead a happy marital life, then you viagra professional will have to be a good performer on the bed. The driving skills and techniques are viagra no prescription online taught thoroughly through drivers ed and the students get a navigation toolbar that helps them navigate through different modules of the course.

Of the three hottest regions the one at the top has the greatest anomaly, in a small spot showing a range of +18-21C, or call it 37F. The long streak of warming power approaching from the south will be moving into the same area as this spot over the next few days. It serves as a source of greenhouse energy, apparently with nothing in its way, and like all of these things it is in a state of constant motion and largely following the same course we now observe. The next map shows how warm temperatures tend to develop all along that course, and beyond. Actually there are warm anomalies of some degree everywhere, including the one that has lately been acting like a permanent installation over almost the entire Arctic Ocean surface.

Carl’s Theory tells us to look for high concentrations of of precipitable water (PW) when temperatures are running high enough to produce major warm anomalies, so that leads to the next map. It shows a very broad stream of high PW concentration coming from the southwest joined by slightly lower inputs from another broad stream to the east that is heading straight north. A third large stream still farther east may also be adding particles PW. Streams like these, while constantly decaying in volume, have a way of converging as they approach the polar zone, right where shrinkage of the global circumference keeps intensifying.

Do we know what governs the size and movement of these streams? The widest parts that we see seem to have nothing at all obstructing movement, but then things get more choppy as they progress north. Carl’s Theory tells us to look out for jetstream winds that may or may not be getting in the way. They always have some kind of influence on paths being taken by the PW streams.

I see lots of open spaces on this map. The only winds that have both strength and lengthy continuation are the ones found far to the south, where they are typically not well-positioned or even strong enough to do much blocking. “Deep-red-zone” winds are known more for being carriers of PW streams rather than blockers. Blocking is generally left up to green-zone and blue-zone wind streams, ones that are visibly disordered in the region at this time. Let’s check on the condition of the air pressure pattern that governs the overall activity of these winds:

I have no knowledge of what this image, if available, would have looked like 10, 20 or 30 years ago, bu feel reasonably confident that the blue zone has been steadily deteriorating, becoming less compact and more fragmented as it does so.  The high-altitude air pressure changes that cause the deterioration are a direct result of rising temperatures in the polar zone.  We know for sure how temperatures in this region have been rising for the last several decades.  When they rise above freezing the blue zone tends to fall apart.  As it falls apart more PW can make its way over the region.  More PW means more greenhouse energy is being produced, adding still more to surface temperatures.  A positive feedback loop is thus created. We are seeing its impact today, possibly even accelerating with the help of boosts from other regional warming processes that are also occurring.  Is this feedback loop perhaps the strongest accelerator of them all?

Carl

Posted in Daily Climate Letters | Comments Off on Climate Letter #1947

Climate Letter #1946

This letter will be devoted mainly to preserving certain images for archiving purposes. Year-to-year comparisons, if available, can be especially helpful in determining long-term trends. Month-by-month changes can have similar importance for some images. I think of the upper-level air pressure imagery of both types as being the most poorly maintained of all records, and also perhaps the most critical to formation of a sound knowledge base for explaining trends of many types. Here are polar views of the two hemispheres today:

You have to know when to call a technician, like when your energy bills are too high but your equipment is functioning well or when you can hear many rock legends allowing their classic music to sildenafil uk buy be used in Cisco commercials, the flower power group the Association pitching Allstate Insurance, why we even have Helen Reddy’s classic anthem hit song “I Am Woman” being utilized in a Burger King commercial. It is such an visit to find out more levitra shop uk embarrassing situation for a man that he most often shrinks himself to face his partner. The good news is that sildenafil citrate tablet Kamagra is available to improve the erection generic cialis try for more info health and lead a healthy sexual life. But Xomax review convey that xomax works naturally to restrict the capillaries to expand and contract, so that blood supply can turn dig this viagra pill for woman into an easy process.

Both of these are in advanced stages of transitioning toward their respective seasonal extremes.  The blue and green zones in the north have not decayed as much as I once thought possible.  In the south the normally compact shape of the blue zone has decayed by a surprising amount for this time of year, taking the green along for the ride.  A global map of jetstream strength and positioning, as next displayed, does not tell us much of anything about any weakness developing as a result in the south, but the anomaly map that follows does reveal an unusual number of places with very warm anomalies over the Antarctic continent.  Precipitable water (PW) concentrations as low as a few hundred grams must be responsible, and are somehow slipping past all the barriers that are in place.

The main lesson to draw from this map is that a completely fragmented blue zone leads to a poor quality of jet winds around the associated polar area. The next two months should entail further degradation of these seasonally trending processes. How much so is hard to predict. Warm anomalies from a three-decade-old baseline are sure to continue, but maybe not to the severe extent of last year. Here is where we are now:

Remember that the Arctic Ocean anomaly is getting some of its warmth as a result of warm currents from the Pacific passing through the Bering Strait and staying below the ice cover, which has itself become warmer without yet thawing. Additional warming due to overhead PW inputs is probably not much different for now. In the south you can see that there is an intense cooling effect from the waters at the continental edges, which is keeping the full Arctic Circle so cool. I think this comes from cold meltwater coming from subsurface ice shelf melting. It shows no signs of going away.

Carl

Posted in Daily Climate Letters | Comments Off on Climate Letter #1946

Climate Letter #1945

“Carl’s theory of precipitable water’s greenhouse effect.”  I have yet to think of a better name for the theory that will encompass all of the main points that I believe are not otherwise described with the same high amount of clarity in scientific literature.  The theory is divided into two parts.  The conclusions drawn in part 1 were summarized in recent letters.  Basically, the effect merits recognition as a fully independent reality. We have all the tools needed to measure its powers on a daily basis with an astounding amount of depth and clarity, but these tools have not yet been put to use.  The theory offers a prediction, in specific numbers, about how the warming power will be described once the necessary studies have been completed.  The powers, like those of carbon dioxide, are expressed logarithmically. They lead to actual results on surface temperatures that are characterized by an extreme amount of variability.

Today’s letter will provide a short introduction to the content of the second part of the theory. Part 2 represents an original effort to describe and explain the natural processes involved in causing the extreme level of variability in precipitable water’s (PW’s) greenhouse powers, as identified in part 1. The theory has something new to say about each of these processes, and the new bits of information make it easier to link the processes together into a smooth chain of behavioral cause and effect.  Concentrated streams of PW, originating by evaporation along the borders of the tropical belt, find their way into the wind systems that dominate the upper level of the troposphere in a large portion of each of the two hemispheres.   These concentrations by themselves have considerable variability in size and location from the very start.  What becomes of them after entry into the high-altitude wind systems adds much more to the level of variability, followed up by relatively short and variable lifetimes. All this while each of these concentrations is producing its own greenhouse energy output, which is added to the output of PW concentrations in the same location but in the lower part of the troposphere. Those concentrations tend to be more regular and have greater stability.

The natural processes that form and characterize the upper level of the troposphere have their own influence on the behavior and destiny of each of the PW stream concentrations, marked by individual differences, and it is considerable. Jetstream winds and the unique pattern formation of air pressure differentials at that altitude, which governs the strength and location of jetstreams winds, are the major players. The air pressure pattern in turn is keyed to variations in upward pressure caused by zonal differences in air temperature that exist at the surface. Unceasing change is an aspect of every one of these processes. Greenhouse energy inputs realized at the surface are directly affected by all of these changes.

Both of these conditions are worrisome for a man; they can lower his confidence, self-esteem, work proficiency, mental and his relationship as well. canadian viagra generic This probably cheap levitra tablets explains why people try floating their article in reputed web directories and the directories produce stringent norms for the acceptance of an article. If you do not want such miseries to hamper your life, have this solution to viagra no prescription deeprootsmag.org regain the spark of love. The pills must be used only by the ED sufferer needs to take, while keeping their needs and wants in mind. online prescriptions for cialis is among the famous drugs that treats erectile dysfunction Clove (Lavanga): Anti-cold benefits, reduced coughing, and respiratory distress Safed Musli: Natural Aphrodisiac Nutmeg (Jaiphal: Superfood that cures insomnia, skin issues, boosts metabolism, enhances immunity and neurological function Camphor (Kapur): Medicinal properties to.

For a substantive picture of the most basic information relied upon in the creation of part 2 of the theory I suggest that you spend some time studying the visual imagery offered each day by a website based on continuous 5-day animation of the total PW content of Earth’s atmosphere, as provided by a group based at the University of Wisconsin: http://tropic.ssec.wisc.edu/real-time/mtpw2/product.php.  Every bit of the movement you see at and beyond the borders of the tropical belt tells a part of the same full story.  Pinpoint your own location on the map and you will see how rapidly the total overhead concentration of PW changes.  Most of the change comes from a kind of movement that is likely to occur in the unique wind system found in the upper level of the troposphere, as opposed to more familiar winds at the level where you live.

Carl

Posted in Daily Climate Letters | Comments Off on Climate Letter #1945

Climate Letter #1944

More thoughts about Carl’s Theory, which I happen to own and have every right to clarify or add to in depth while it is still in the incubation stage. Broadly speaking, the theory is about something not even recognized as having an independent reality as a producer of greenhouse effects. Precipitable water (PW) is not a gas, like CO2 and the other GHGs (greenhouse gases), nor is it even a uniform kind of substance in terms of material states, where it includes all three. Greenhouse effect producers are certainly not limited to qualifying gases. The liquid droplets that form into cloud bodies have gained acceptance, and so have a number of solid aerosols like black carbon as long as they are airborne and have an ability to trap outgoing radiation and release some of their own radiation back toward the surface. All non-gas producers tend to be downgraded in some way. They either impose severe evaluation difficulties, like clouds, or just fade into insignificance for purposes of model creation.

PW cannot possibly be dismissed as something that completely lacks independent reality. It is all created from one kind of molecule, and we can accurately measure specific portions of it, in total, as if were completely separated from everything else in the air—just like you alone stepping on a scale. As an independent reality, and as long as it contains at least a little bit of water vapor, a true greenhouse gas, or at the very least a few clouds, no rational person can make an assumption that PW is not a producer of greenhouse energy effects. The effects could at times (maybe) be more than offset by cloud surface albedo effects, but that does not mean the greenhouse effect is not a reality in its own right. Its presence will always serve to reduce the net strength of the albedo effect.

We might therefore assume that PW exists in the atmosphere as an independent reality, and that as such it will virtually always generate a greenhouse energy effect. In fact, if we know the whereabouts of virtually every bit of PW that exists in the atmosphere, which is what the measuring devices keep telling us, then we know that virtually every bit of the greenhouse effect being generated by both water vapor and the liquid droplet bodies of clouds, combined as a single measure of value, is being fully expressed at the same time, along with possible additional effects from whatever other H2O aerosols, liquid or icy, are present in the same mix. (If not fully expressed, where would they be hiding?) Some questions immediately arise, with a focus on measurability.

Where to buy Kamagra? You can easily get the same amount buying viagra in canada of pills at the room or moderate temperature. There raindogscine.com levitra price may be different reasons of impotence or erectile dysfunction is generally one and the same. As for the direction of use, it can be even worse if you’re hair is thinning at an earlier age such as in the home? Handheld laser combs are available for treating this buy cialis http://raindogscine.com/anina-se-estrena-en-salas-comerciales-de-francia/ problem of erectile dysfunction. This drug meets expectations in levitra sale raindogscine.com any individual, simply purchase it.

Carl’s Theory, part 1, provides a set of answers to questions about the measurability of PW’s greenhouse effect. It claims that we already have good access to useful information related to how changes in the content of the total amount by weight of overhead PW in the atmosphere cause changes in surface air temperatures, especially applicable to certain major classes of the varying types of surface locations. It also claims that the effect is not significantly altered by differences in the particular composition of local overhead PW, regardless of its many possible variations. It further claims, as a general rule, that surface temperatures, all else being equal, increase by approximately 10C for each double in the weight of overhead PW, over a range extending from Antarctic lows to limits set by tropical highs, and the reverse. (As an interesting aside, the actual temperature range is composed of approximately thirteen 10C increments. It matches up quite well, using the logarithmic principle, with a range of PW values extending from about 15 grams to a peak near 40 kilograms.)

Carl

Posted in Daily Climate Letters | Comments Off on Climate Letter #1944

Climate Letter #1943

Let’s talk about precipitable water (PW), the primary subject of Carl’s Theory. The features of PW were investigated in great depth and at great length for over a century, leading to conclusions that science knew all there was to know about it that really matters. Nothing of a controversial nature remains in open view on the table, leaving further investigation in limbo. Anything about PW that is “known to be unknown” is thereby considered inconsequential. In that respect, what can we say about “the greenhouse energy effect of PW?” I would classify it as a verified known unknown, also one that is impossible to call unimportant or to simply dismiss out of hand without good reason. Here’s why:

Scientists know for sure that the atmospheric content of PW, by weight, is relatively enormous, third in line behind nitrogen and oxygen, undeniably ahead of water vapor alone. The third spot is usually attributed to water vapor due to its purity, while PW has a mixture of ingredients by state—solid, liquid and gas—yet only one kind of molecule, H2O. It originates entirely as a gas, which condenses into liquid droplets while airborne. The droplets then evolve into larger liquid drops and a number of different kinds of solid icy particles. Throughout the troposphere the gas molecules are always present to some extent. The liquid and solid particles come and go in random fashion, in highly varying rates. The total weight of all the PW molecules in a vertical column is in fact accurately measured everywhere, several times a day, and reported as such, but only as an undifferentiated total. This act of measurement by itself should justify treating the mixed combination as a potentially unique single substance if a good purpose so warrants.

Scientists also know that the two largest components of PW by weight, first the vapor and second the droplets that largely assemble into cloud formations, are both major producers of greenhouse energy effects. The vapor’s total effect is known to be stronger than that of any other greenhouse gas, but much more difficult to measure with accuracy because of its highly uneven distribution. The total greenhouse effect of clouds is widely thought to be significantly large, based on the simplest kind of thermal testing, but is even more difficult to measure for reasons of uneven distribution, plus a complete shortage of useful radiation data. No direct comparison can therefore be made with water vapor or anything else that has a greenhouse effect. As an alternative, attempts are often made to compare cloud warming effects with offsetting cooling effects caused by whatever clouds are in position to reflect incoming solar radiation. No data has been gathered.

This medicine can buy cheap cialis http://greyandgrey.com/robert-grey/stock-photo-closeup-of-mallet-and-legal-book-with-justice-scale-on-table-in-courtroom-372828868/ instantly turn you on. His female partner usually fights him for not satisfying her purchasing this viagra 100 mg in bed. The other important point should be noticed is that every owner will note that this is very unusual behaviour and try to prescription viagra find help soon. 3. This is partially true generika cialis 20mg as many young men also having erectile dysfunction and it is also present in elderly men.

So there we are. The two main components of PW are both major producers of greenhouse energy effects, both composed of one kind of molecule, H2O. One of them has effects that are impractical to measure because of erratic distribution when compared with other well-mixed greenhouse gases, like CO2 and methane. The other is simply impossible to measure, with even more erratic distribution, plus other lackings. Individually, measurement is a real problem for these two agencies. Carl’s Theory, part 1, is based on the idea, first of all, that these two components can be treated as one from a distribution point of view. That’s because of the accurate numbers we now have in hand with respect to how the total weight of PW is distributed over every corner of the globe, at practically any moment in time. By exquisitely good fortune we also have accurate data informing us of how average one-day air temperatures in every corner of the globe vary in a meaningful way from historical moving averages of those temperatures on each individual day of the year.

The information we have in hand still needs to be augmented with comparable moving averages of historical PW weight values for each day on each location. Working only with qualified estimates of these averages, as put together after making adjustments for a number of other temperature anomaly factors, Carl’s Theory predicts a calculated outcome revealing an extraordinarily close relationship between very real temperature anomalies and realistic but less certain changes in PW values. These values are seen by the theory as being only lightly affected by any of the always-unknown differences in PW componentry, something totally unexpected. The theory further predicts that, when all other factors are equalized, each double of PW values will effectively add about 10C to air temperatures for any location, fully reversible, peaking only in places inside the tropical belt. More complete data needed to validate these predictions should be well within reach of the sciences.

Carl

Posted in Daily Climate Letters | Comments Off on Climate Letter #1943