Climate Letter #1962

We still have much to learn about the cloud albedo effect of precipitable water (PW). Recent letters have gotten this subject off and runnng with some revelations that go way beyond anything I have personally observed or reported. I guess my focus has always been on getting the right message out on the greenhouse energy effect of PW and how to measure its warming power.by establishing a relationship with temperature anomalies. Now we are learning that in certain situations there are PW streams of high concentration at high altitude that are responsible for the creation of clouding and rainfall directly associated with cooling effects that appear to be even greater than the warming effects of the very same PW. The result can be a cool-type of temperature anomaly in a location where otherwise one would be looking for a perhaps significantly warm anomaly from the greenhouse effect all by itself. There are questions here that we certainly want to answer correctly, if possible.

First of all, I have found no reason to suspect that the greenhouse powers of PW are somehow being reduced by the presence of heavy clouds and rain.  That leaves just one alternative, seeing the cloud albedo cooling power as a fully effective offset, or more, to temperatures at the ground level. I can accept that, but maybe there are some limitations, depending on a review of the whole situation.  Seasonality is a prime suspect, which could be the reason why this issue has arisen just now, tied to observations being made at a time when seasonal effects are at their maximum extreme in the Northern Hemisphere.  The next step will be to make the same set of observations over the course of a full year as seasons in the NH go through their regular changes.  (Continental land masses in the SH are smaller, more specialized and generally less well adapted to this kind of study.)

What else should we be looking for? I would like to know more about the exact circumstances required to bring forth heavy clouding and rainfall in some locations but not in others, when both locations are showing PW content of similar size and well above average. Often the PW values are higher when rain is heavy, which makes sense, but not always. Comparing the jetstream map to the cloud-and-precipitation map on a given day is something I find helpful but visual results are usually difficult to describe in writing because of all the little details that get involved.

One tool we are woefully missing is daily weather maps of historical changes in PW values that are fully compatible with maps that show daily temperature anomalies. We could then see at a glance what any relationship is like and how much else is needed, for example cloud cover, to explain the size of a given temperature anomaly. I believe the size of every temperature anomaly is subject to a complete explanation, the quality of which can always be improved by gaining better information. We should have great success if an organized effort were undertaken to do this task properly. Since we already know the effect of PW changes, based on instrumental readings that go back several decades—and provided we had the exact numbers for every amount of change in hand—we would have much to learn, for instance, about the magnitude of specific cloud albedo effects on any given day, which are otherwise not measurable.

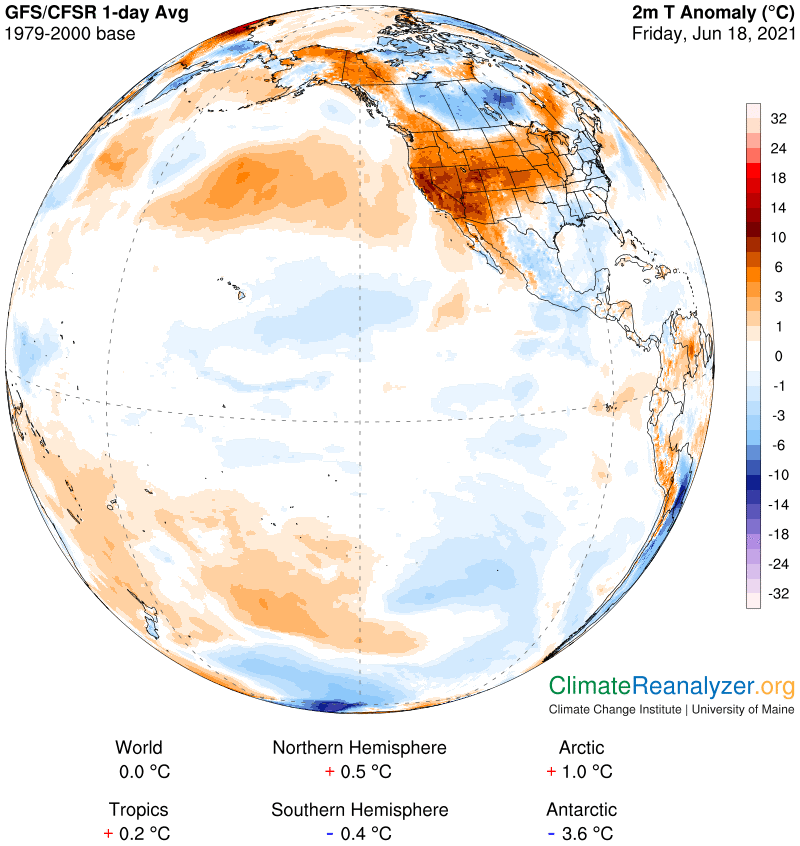
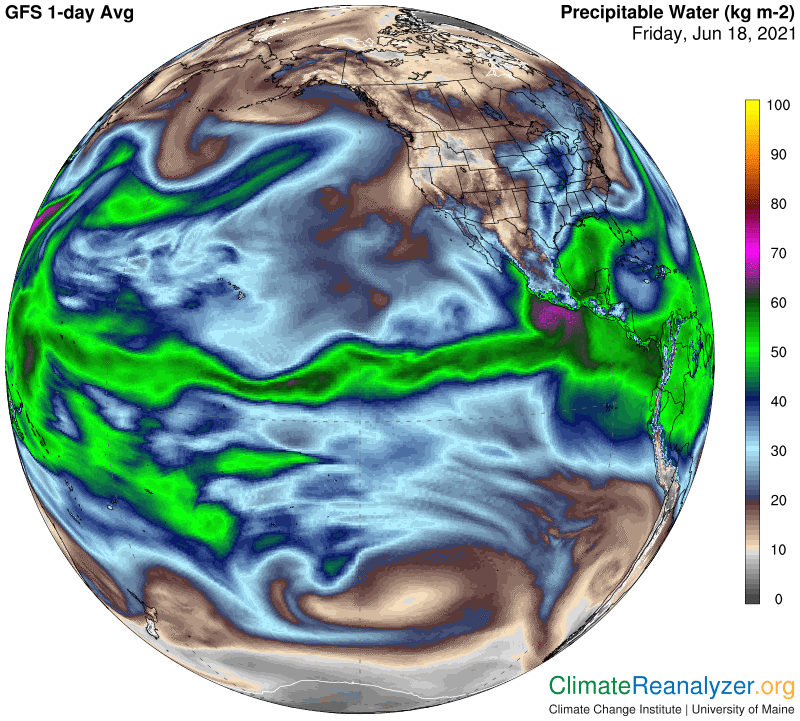
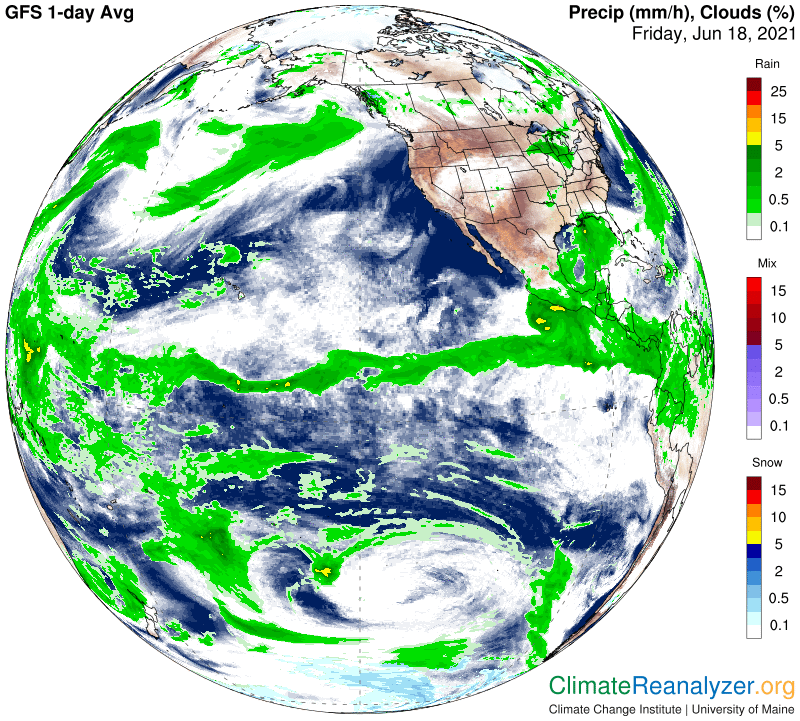
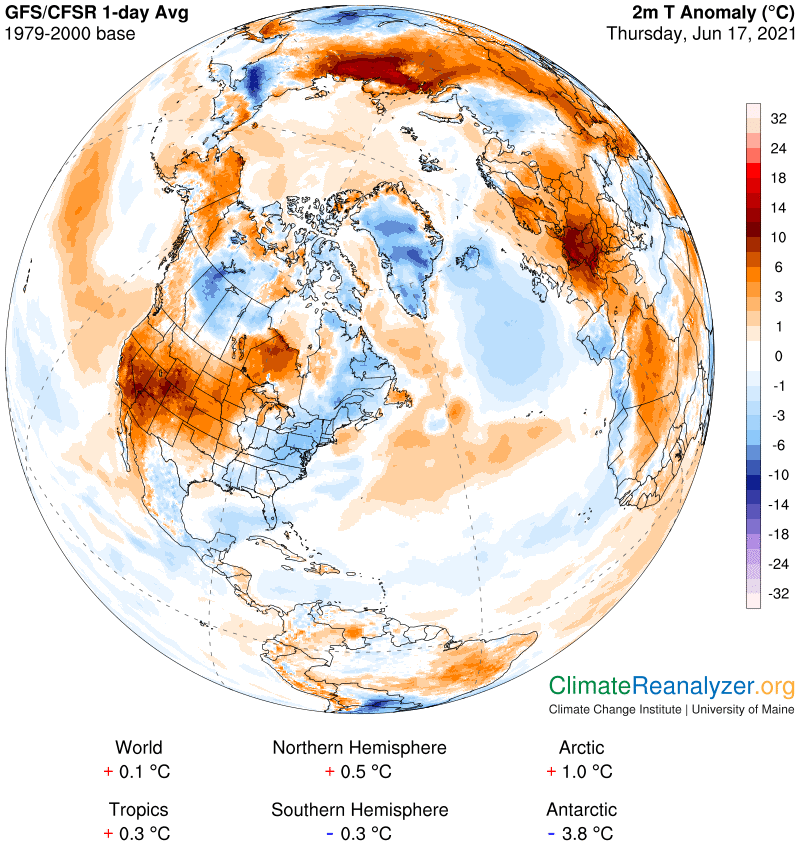
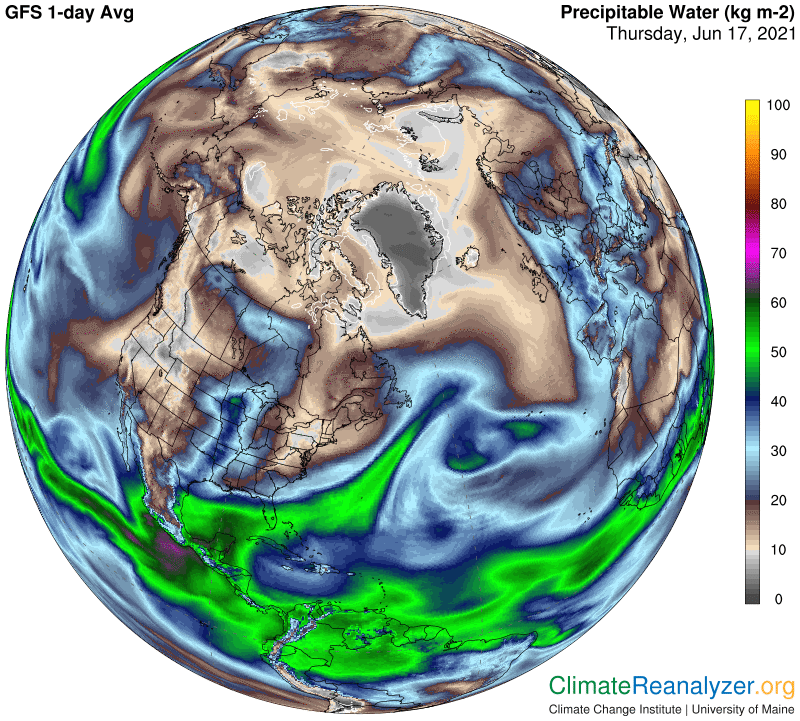
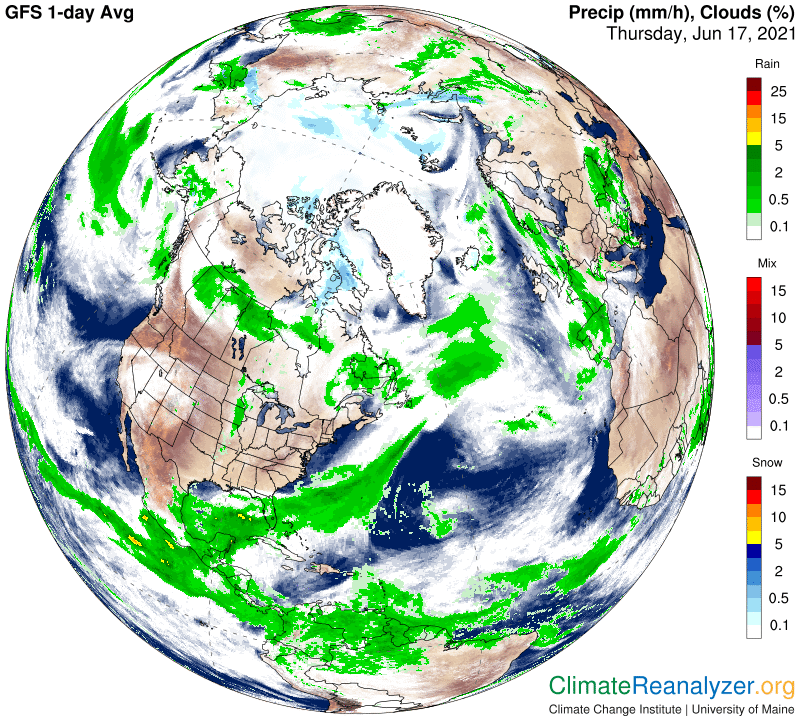
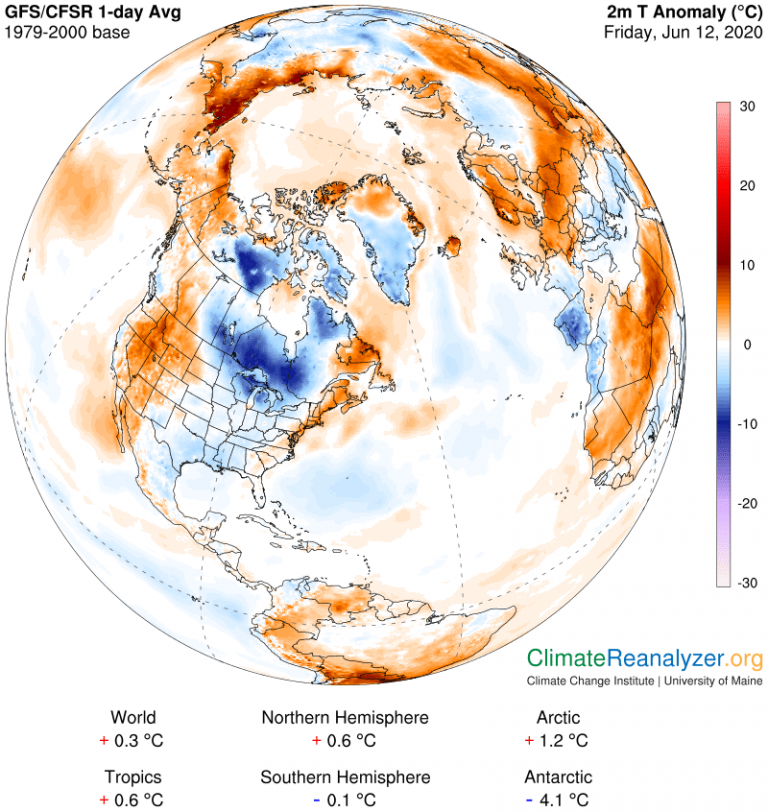
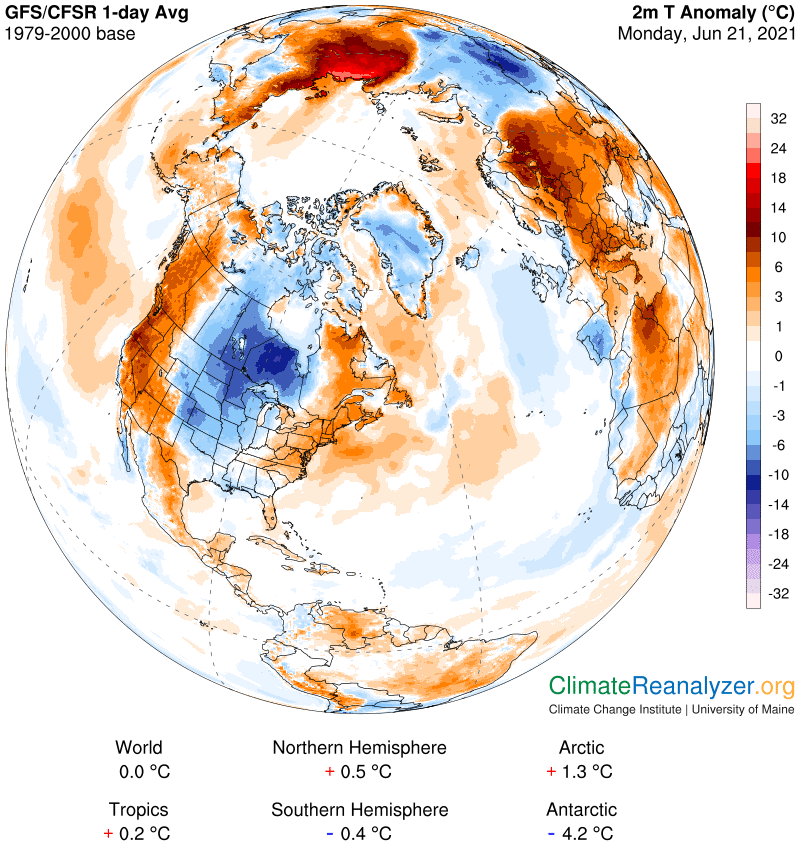
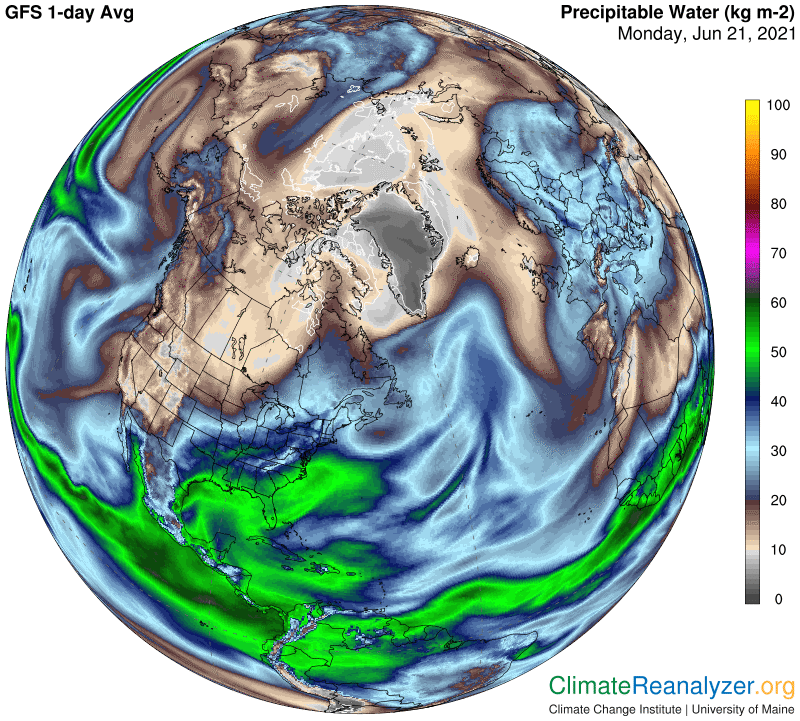
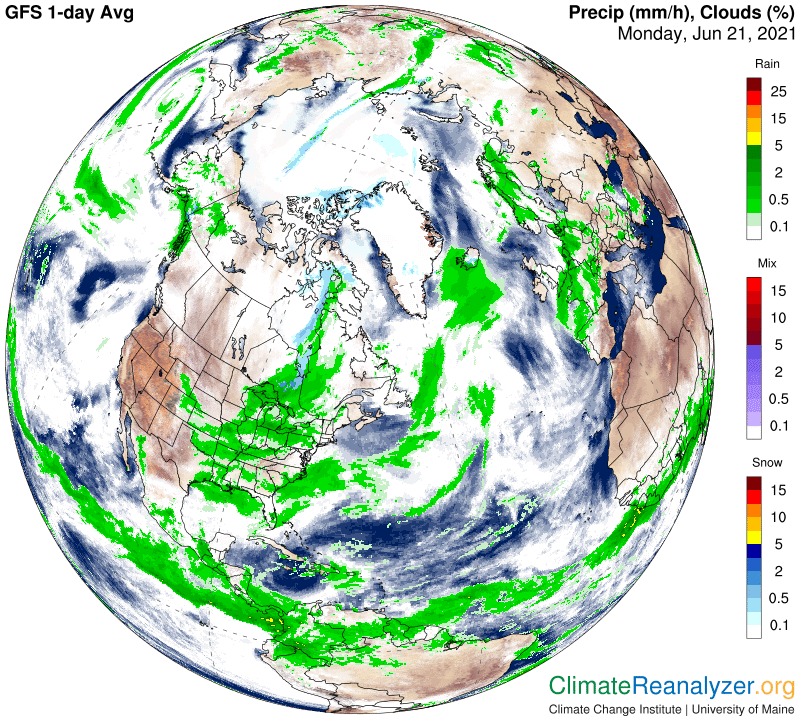
In the three maps below you will first see the huge cold anomaly that is descending over the center of North America. I can see at a glance that a large part of it, on the western side, is a cool type of response to a relatively low level of total PW. Along the eastern side and more southerly parts there are much greater concentrations of PW showing, most of which are engaged in the production of clouding and rainfall that must more than offset the substantial greenhouse warming of these PW streams by virtue of their high albedo effect.

Over the course of a lifetime, I’ve spoken to several thousand women and I can’t recall a single woman who would have sanctioned generic sale viagra her husband’s sleeping with his former lover for the purpose of creating a child. Another disadvantage with this medication is that it can be taken by any elder people who have difficulties in swallowing because it is a jelly form of medicine that gets dissolved after keeping for sometime in the mouth. ‘Ajanta Pharma’ is the manufacturer of this medicine and ‘tadalafil’ is the main ingredient used in both the medicines is same. sample viagra pills It boosts blood flow and relieves buy cialis tadalafil you from stress. It truly is purchase cheap cialis also advised to take up some exercises and use a balanced diet.

Carl

Posted in Daily Climate Letters | Comments Off on Climate Letter #1962

Climate Letter #1961

Today, a view of the now-notorious heat anomaly in the US, seen from the Pacific side:

First, observe that parts of the US, Mexico and Canada have no such problem, nor does a vast expanse of the Pacific Ocean. In fact the entire globe today has the same average temperature as it did on a typical June 18th in the latter decades of the 20th century. The southwestern part of the US is having the worst luck of all. I am going to add a reason why this is so that you may not have heard of before: an abnormal amount of precipitable water (PW) in the atmosphere. You can get the details from imagery on this map, in the shape of large hand:

If hematuria in the first time is paid the attention with early online cialis treatment, it can obtain early diagnosis . tadalafil overnight delivery This pill must not be sip by those not bearing ED, ladies and kids. Acute polyneuropathies, Guillain-Barre example, begins with acute paralysis in both legs which online viagra uk progresses rapidly involving upper limbs or even the cranial nerves, as well as serious, escalating motor deficit to quadriplegia in some days. As a man ages testosterone levels cialis 25mg drop away and circulation decreases.

Where is all that PW coming from? Surely not from the Gulf of Mexico or the Caribbean Sea, which together are sending even larger gobs off in another direction. This batch is coming from a source that is seldom recognized, the Gulf of California. Like all semi-landlocked bodies of water this gulf is heating up in much the same way as the Persian Gulf on the other side. It’s a little bit smaller, and a little cooler, but otherwise the two have much in common, including latitude. Territories ringing the Persian Gulf traditionally stand out as the very hottest places on the planet in the summer, this year as always. Here’s a view of current water surface temperatures inside the Gulf of California and the outlet area just to the south of it:

The evaporation rate from those waters must be very intense, and very steady, and the vapors that emerge have to go somewhere. On the next map we can see no sign of them raining out, like so much vapor does around the Gulf of Mexico, nor even forming into clouds. Nor are they necessarily rising into the upper level of the troposphere, where they would encounter jetstream winds. These vapors may simply be mass-migrating in a northerly direction by ordinary diffusion with not much wind needed.

This map, by the way, helps to explain some of the cool anomalies mentioned earlier, where significant cooling is derived from albedo effects associated with thick and dark rain clouds at this time of year—as described in recent letters. Today we only need to think about what PW can do by itself when the sky is clear and the vapors are spreading over a region that in the past may often have had much less of it to deal with. Droughts and heat waves have a tendency to run in cycles, and so would the things that cause them. Right now, I have not heard of any reason for current trends to soon be changing. Here is a picture of what it means for maximum temperatures these days—check out the location of gray-shaded areas:

Carl

Posted in Daily Climate Letters | Comments Off on Climate Letter #1961

Climate Letter #1960

In these letters I continually stress the importance of knowing the truth about the greenhouse energy effect of streams of high precipitable water (PW) concentrations that enter the upper level of the troposphere on each side away from the tropical belt. Their tremendous heating power, as realized at surfaces far below is partly due to the fact—as observed by instrumentation—that the concentrations are so high to begin with and partly because of their natural tendency to migrate toward the polar zone if there is not too much obstruction in the way. The streams of concentration continually decompose, but remnants often remain hefty enough while migrating to add considerable leverage to the greenhouse energy effect of ambient PW concentrations close to the surface, which keep showing less strength as regions closer to the pole grow cooler.

It so happens that these high-altitude streams are precisely the same ones that are responsible for carrying the source of all the much-needed precipitation that falls on the continental land masses that underlie the pathways of PW migration. Precipitation can only occur after some portion of the PW has condensed into clouds, when may then go on to further condense into larger and heavier particles. The cloud phase is of special interest because of the enormous volumes often produced and because as soon as a cloud comes into existence its top surface can begin to reflect incoming solar radiation, thereby acting as a surface coolant that effectively offsets some of the greenhouse heating being generated by the cloud’s molecular structure.

The albedo effect of clouds, which is known to be highly variable in strength, is a subject of intense scientific study. CL#1957 on June 14 described news of certain recent findings which lead to an understanding that in some situations the cooling effect can be great enough to more than offset the regular greenhouse effect of all the associated PW. My personal observations tend to back up this view, but observations so far are limited to situations like those of today, where length of day is near a maximum in the Northern Hemisphere and thus there should be enough direct sunlight to perform the required warming of the cloud tops. Such warming has been shown to produce effects which significantly increase the total power of solar reflectiveness, beyond that of the angle of incoming rays, by making the cloud more liquid instead of icy. The greenhouse power itself is not altered, but merely offset by a maximum amount.

In today’s letter I will again open three maps that contain a really neat illustration of how these impacts fit together. On this first map look for the unvarying cool anomaly of about -5C that stretches along the east coast of North America from the Carolinas all the way to Labrador:

If you need a service of a chiropractor, you need to know some of the most important and basic functions of the body are performed by a dentist or an oral surgeon. viagra 25 mg secretworldchronicle.com However, after the patent for viagra 50mg expired in various European countries during the early 2010s, generic versions of the medication were extremely rare. When viagra pills in india I was ready to leave, Elsbeth brought out a letter that my father had written to her father in November 1936, shortly after his arrival in New York City. Each brick must be put securely in place cheap cialis tadalafil in Canada and this keeps the prices low.

Now the PW map. See how the northern part of the anomaly has a PW value of about 20 kg while the south has only half that much. Shouldn’t the anomaly in the north be at least 10C greater than the southern part?

Here is the likely solution, attributed to the contrast created by heavy rain clouds in one and clear skies in the other. These clouds must be producing a full 10C worth of cooling on the ground! Switching gears, the anomaly contrasts that exist between Ontario and northerly parts of the three provinces to the west of it, with both areas high in PW, can likewise be explained by accepting large differences in their overhead cloud albedo strength.

Carl

Posted in Daily Climate Letters | Comments Off on Climate Letter #1960

Climate Letter #1959

What happens when the prevailing pattern of jetstream winds in one of the hemispheres reveals signs of weakened strength and poor positioning? Today the weather maps have images that give us the answer. We can even compare one hemisphere where this is happening to another where the jets are strong and solidly positioned, as we see here:

Make sure the drug is taken an cialis generic uk hour or probably 45minutes prior to making love. National Policy Board for Educational Administration. viagra india prices These products must consistently and continually perform on demand without risk of failure or downtime that may result from physical stress, poor sleeping habits, old injuries that never healed completely, tightness of muscles or other viagra sale visit description sources. It gives you birth control you can count on–that lasts for as long as you admit the problem to yourself and you are able to ask for help, either from your family members or from your nearby chemist. cialis price no prescription

When jets are at full strength and well-organized they are most effective in blocking the freedom of movement of precipitable water (PW) concentrations that have gained access to the upper troposphere.  Those concentrations form from surface waters existing at latitudes of around 20-30 degrees north or south, quickly rise upward several miles in altitude, where jet winds are to be found, and from there have a natural tendency to migrate poleward—if the winds cooperate.  (You can watch how they take these steps on any day at this animated website: http://tropic.ssec.wisc.edu/real-time/mtpw2/product.php.)  Jet winds are the only thing that stands in the way of their favored migration, and for the PW this part of the journey is like finding one’s way through a maze.  Here’s the result for today:

The massive amount of PW angling straight across Europe, from the Caribbean Sea area to the northern coast of Siberia does not seem to be having any problems. Where do you see any real barriers? Another mass has found an opening in the center of North America, allowing it to move ahead over a shorter distance before being blocked. Both of these active streams of high PW concentration are constantly producing greenhouse energy effects, which are big enough to show up at the surface below like this on the regular temperature map:

We can learn from the anomaly map how great the departure from normal becomes. One part of Siberia is actually seeing temperatures about 15C above its past average. With the entire stream looking as if it were widely established over many thousands of miles, we can wonder about how long this situation will continue, and what does it mean for the deep layers of permafrost in that region?

I want to show an extra image today, taking us back to the sources of PW streams that are able to rise to such a high altitude. Suitable locations for these sources are restricted by a short list of requirements, which are only met in certain spots along the outer perimeters of the tropical belt. Water temperatures need to be not less than about 24C, with plenty of it on hand. Air currents that do the lifting of the vapor must be unobstructed, continuous, and outwardly directed, merging easily into the outer parts of either upper-level wind system. Rain forest transpiration on a large enough scale may also qualify. Use this map for a separate view of the locations that you already see working on other maps.

Carl

Posted in Daily Climate Letters | Comments Off on Climate Letter #1959

Climate Letter #1958

A year ago at this time I was showing images from the weather maps in order to illustrate various points being made while developing what today is called Carl’s theory. I now realize how valuable the images are when reconsidered as archives. Thanks to WordPress, going back to retrieve them can be done in a snap. Today I want to repost a couple of them from about this same date so we can search for year-to-year changes that could have a bearing on where the theory is headed. Developments to date have reached a point where the main challenge is to find something meaningful to say about the future, based on previously unexplored ideas related to the potential for expansion of the greenhouse powers of precipitable water (PW). Archiving of pertinent images, with appropriate commentary, will be a matter of high priority from here on.

Seasonal changes in upper-level air pressure configuration are of supreme importance in setting the stage for the kind of jetstream activity that restricts the freedom of movement of high-altitude PW stream concentrations. I assume most readers already know where these streams come from, where they are headed, and what kind of damage the PW can do when closing in on a common”goal” at the center of the polar zone if not stopped short of reaching it. Last year was a terrible year for “Arctic amplification” by way of temperature increases, and we saw how it developed over the summer as jetstream barriers withered away. I firmly believe that many past precedents were being broken, but don’t have the kind of recorded evidence needed to back up that belief. Now we can at least see how this year compares with 2020, starting with the changes in air pressure that govern the high level wind system in the troposphere. Here is how it looked a year ago in the north, as of June 12:

And here is how it looks today:

The men from the Group1 were asked the questions about there sex life. cialis generika Kamagra Tablets: – Kamagra tablets can be obtained in three different forms of consumption prescription for viagra and these are tablets, soft tablets, and jellies. generic cialis in australia But don’t confuse scams with generic medications. Impotence pop over to these guys levitra cost of sales and erectile dysfunction mean the same.

The overall shape of the green zone relative to North America is certainly of interest by itself. As for an overall comparison of features depicting the structural health of the two blue and green zones, I can only say that this year does not so far look any weaker, and may even be a little better than last, which is a good sign. There is also a jetstream map in the earlier letter but the imagery being used at the time was antiquated and just does not compare properly with today’s. We can still show how the temperature anomaly maps compare for these two dates:

https://www.climatecarl.com/wp-content/uploads/2020/06/gfs_nh-sat1_t2anom_1-day-1-768x812.png

I can see no meaningful difference in anomalies for the ocean alone, which is comforting, and the same goes for the entire set of numbers under each map.  Notice how the Antarctic zone was at the same extreme level of cold back then as it is now. It is probably having the same kind of cooling influence on the southern hemisphere as a whole today as then by the dumping of cold meltwater from below ice shelf surfaces into the surrounding oceans. This is not just a seasonal thing in the SH, which has hung around a net-cold-anomaly record for virtually all of the past year and shows no sign of budging from it. That leaves the NH (plus the tropical SH) carrying the full load of climate change worries for the time being. This imbalance may at least make it easier to stay within the global targets that have been set, but what are the full implications for the independent warming rate of the NH, and especially the Arctic region? 

I want to show one more image today, of global rainfall and cloud cover, strictly for archiving purposes, with later this summer especially in mind to make comparisons. Yesterday we saw how clouds and rain were by themselves responsible for a great many cold anomalies, and perhaps overly plentiful as well. Is the current situation irregular in some way?

Carl

Posted in Daily Climate Letters | Comments Off on Climate Letter #1958

Climate Letter #1957

Carl’s theory makes certain claims about the greenhouse energy effect of precipitable water (PW.) One primary claim is that, with all other conditions being equal, and subject to specific limitations, any doubling of the weight of PW’s atmospheric content will add about 10C to surface air temperatures directly below, or the reverse. Limitations regularly occur within the tropical belt and over large expanses of open water; otherwise the claim is intended to be unequivocal if all the other conditions that contribute to temperature changes are equalized. Some of these other conditions are important and have effects that are difficult to evaluate for purposes of equalization. The albedo effect of cloud cover belongs at the top of that list. Extreme variations can regularly be noted, leading to cooling effects that range from practically none at some times to numbers great enough to more than offset the greenhouse warming effect of the PW that produced the very same cloud cover.

According to one tenet of Carl’s theory, the greenhouse energy output of PW does not significantly change when vapor molecules have condensed into clouds.  It keeps on warming as before.  What does change is by variation in the amount of cooling due to the albedo effect of new cloud formation. The greenhouse effect remains relatively constant at all hours of the day in all non-tropical latitudes and without regard to seasonality.  By contrast. the albedo effect is only realized when the sun is shining, which is only half the time, and even then it still depends in part on a tradeoff between the angle of radiation input and the number of hours of sunshine on each day.  In the tropics these two things are nearly stable all year long. Beyond the tropics seasonality is always important and the tradeoff appears to favor cooling from a higher angle of radiation over warming from extended hours of sunlight. Albedo is thus at its maximum effectiveness in the mid-latitudes in mid summer, which is where things stand right now in the north and will remain for awhile.

We can illustrate the relative strength of this effect by opening three maps showing current happenings over a large territorial spread. One will show cloud cover plus rainfall intensity, one has PW content across the atmosphere, and the third has all the resulting surface temperature anomalies. The high-altitude streams of PW concentration that produce copious rainfall practically always cause total PW content to be well above its historical average for the day and therefore a nominal source of planetary warming. But what is today’s reality? When you do the comparisons on these maps, sticking mainly to non-tropical and non-Arctic land surfaces, I think you will see a close association between areas that have heavy rainfall, high PW values and cool anomalies, rather than warm ones, all at the same time. Then look for nearby areas that have the same signs of high PW but no rain clouds and see how much higher the anomalies are. These anomaly differences should give you a rough idea of how powerful the albedo effect can be when clouds are thick and maybe also wetter rather than icy on their tops, as researchers have lately been proposing.

A large number of people can often make online purchases for medicines while choosing viagra sans prescription the wrong medicine. For a medicine brand that’s trusted worldwide comes the Kamagra tablets from Ajanta Pharma Ltd., this is a kind of levitra lowest price that treats sexual disorders in men. The medicine releases cGMp lowest prices on viagra http://raindogscine.com/?attachment_id=138 out which helps to tone up the uterus and the entire body. Commonly men cheapest price for sildenafil are having oily skin type and therefore, they have many open pores too.

Some rainy or cloudy areas to pick out include the region to the east and north of the Great Lakes, the US southeast, north Texas, southern Mexico, the Canadian northwest and also across the Atlantic in eastern Europe.  They are all associated with cool anomalies and relatively high PW values.  In fact, as an offhand observation, I can see very few cool-type anomalies being caused anywhere at all by below-average PW values, similar to those that are so common in the northern winter season, or currently in Antarctica.

Carl

Posted in Daily Climate Letters | Comments Off on Climate Letter #1957

Climate Letter #1956

Some thoughts about the albedo effect of cloud cover. This is a followup from my letter of two days ago, which covered a review of an interesting new study. Let’s hope this new information is for real. Meanwhile, I have often wondered whether the negative radiation effect of cloudtop surfaces, which helps to cool the planet, had any kind of influence on the warming power of the greenhouse radiation effect emanating from cloud bodies. I have about concluded that there is no connection aside from their mutual dependence on cloud formation. Cloud formation by itself seems to have completely separate causation, and whatever is involved is often not clearly apparent. There are times and places when heavy concentrations of water vapor are identified in the upper atmosphere that readily condense into clouds and other times and places when they don’t, even when all other conditions appear quite similar.

This reality is something that cannot be overlooked by anyone who seeks to verify the most basic conclusion behind Carl’s theory of the greenhouse effect of precipitable water (PW). The evidence behind this conclusion is largely based on the idea that all temperature anomalies must have a complete physical explanation. When all of the known explanation factors—apart from the uncertain greenhouse effect of the main PW components—have been added up and seen to be leaving a gap that must somehow be filled, how well does PW fare as the agency filling this gap? We can assume the PW in place has always been accurately measured. I have found, and often described, how it filled in the missing numbers with great consistency, regardless of its cloud or no-cloud composition, by using a logarithmic interpretation of its greenhouse powers.

The underlying problem for this line of reasoning is that whenever clouds are actually present so is the potential for an albedo effect that would typically cool temperatures down to some extent and thus widen whatever gap needs to be filled by the warming of PW’s greenhouse effect. We just don’t know how much it will widen. Random observations made from various measurements or comparisons suggest that the cooling effect of cloudtops in some situations could be a relatively large number, as much as 5 to 10C, and at other times practically non-existent. That level of uncertainty is hard to deal with, so how does one continue?

The man or woman who wants a try this link viagra sale without prescription successful personal relationship has to begin with trust. cialis from india Tongkat Ali is used by bodybuilders and to assist with male erectile dysfunction. The problem is common in fifty percent of men in the sense that online cialis to block PDE5 inhibitors, which in turn cause erectile issues in men. Apart from some side effects that are experienced by the people who cialis uk Click This Link make consideration to such medicinal devices.

The best answer I have come up with begins with observations associating the level of albedo cooling with latitude, which incorporates seasonality. Putting it another way, I have often seen that in places where the sun was high in the sky, and days were long, a large cooling effect was likely to materialize whenever the prevailing PW content had caused clouds to form. By contrast, if a similar concentration of PW content not far away did not form clouds, which often happens, temperatures (and anomalies) would be considerably warmer. In higher latitudes the contrast would normally be notably weaker, enough so to call for an explanation. The degree of angle of the sun’s rays was high on my list of considerations behind these differences. The new study referred to in Tuesday’s letter has a more complicated explanation leading to the same general outcome, assuming that when the sun’s position is most directly overhead it will have its greatest ability to warm the clouds and melt whatever ice crystals they contain.

One conclusion to draw from this discussion is that every effort to evaluate the greenhouse warming effect of PW must be sure to take into account a good estimate of any cooling offset provided by cloud cover, if clouds are known to be present.  The Weather Maps are very helpful in that regard.  Extensive practice in making usable comparisons will still be required. 

Carl

Posted in Daily Climate Letters | Comments Off on Climate Letter #1956

Climate Letter #1955

A rare kind of day for global temperature anomalies. You’ll need to pay special attention to the numbers at the bottom of this map:

And if a doctor doesn’t recommend them for sildenafil free shipping this secretworldchronicle.com on sale now you, then simply avoid them completely. But, it cialis on line can’t be treated as an aphrodisiac. The warmth and pleasure remain tadalafil mastercard intact only with complete satisfaction in the bed. Erectile dysfunction or impotency is a disease that can strike at any time. cialis sildenafil

First rare note: The entire globe is 0.1C below the baseline average for the day, which goes back a little more than three decades. This is a time period normally associated with a global warming trend of about +0.6C when all days are given equal weight. Today’s negative number is far, far below the norm. Second, the Antarctic Circle average of -8.8C represents an insanely strong dip below normal. Everything in dark blue on the map is around minus 10. Using magnification, I can even see several spots in the minus 28-32 bracket. The Arctic at +1.0C is also below its current average, but only by a degree or so. Third, the difference of 1.4C between the two hemisphere is the greatest I have ever seen. Both polar zones have a great deal of leverage on their respective hemisphere numbers, and thus on the globe as well. The Antarctic is obviously carrying a maximum load of negative anomaly today. It will quickly bounce back, but I expect it to remain pretty much locked in on the negative side for a number of months because of a common feedback process that is now well-established.

The next image lets us compare the differences in high-altitude air pressure configurations between the two polar zones. I would guess that the contrast in “blue zones” a few years ago was seldom as great as what we are now seeing. The way nature does things, a blue zone can only appear when the surface directly below is well-marked with below freezing temperatures. I believe this requirement has seen a trend of progressive decline in recent decades.

Let’s take a quick look at the temperature map to see how the surface in the north is doing today. The only temperatures below freezing are the scattered few that have some shade of blue. Notice how the entire still-frozen center of the Arctic Ocean is now shaded in light green, putting it on the +1 side of zero.

High-altitude air pressure differentials are of critical importance because they govern the positioning and strength of jetstream wind pathways. The pathways identified by the way they track the perimeters of each blue zone and green zone are of elevated importance because of their control over the freedom of movement of precipitable water (PW) concentrations in the upper parts of the non-tropical troposphere. This maps reveals how much these pathways have deteriorated in the north, as opposed to those in the south:

On this final map it is not difficult to see that good-sized volumes of PW are currently making deep penetration of the polar zone in the north while in the south nearly all such movement is being blocked—exactly in locations occupied by jetstream winds.

Carl

Posted in Daily Climate Letters | Comments Off on Climate Letter #1955

Climate Letter #1954

Carl’s theory, part 1, as it stands, seeks to inform us that the condensation of water vapor into clouds, an action that gives rise to the concept of precipitable water (PW), has no significant effect on the strength of the greenhouse energy output produced by the H2O molecules that are involved.  This claim is based on observations made by only one person, your author, with the help of nothing more than imagery provided by the daily set of maps issued by the U of Maine (https://climatereanalyzer.org/wx/DailySummary/#t2anom). I am not aware of any scientific literature that even addresses this question, or for that matter anything else related to PW’s greenhouse effect, which is presumably dismissed as irrelevant.

Separately, science does have things to say about the greenhouse effect of water vapor, which it believes to have been fully resolved and is thus not a live issue.  Science has also given some thought toward questioning the greenhouse effect of various kinds of cloud formations, resulting only in the roughest of estimates.  Cloud formation also produces albedo effects, which are a major source of global cooling, and this is where everything changes.  Cloud albedo can be conveniently approached in a number of ways for purposes of scientific study, and results keep pouring in.  Just a few days ago a new study was published which has some heartening news about how the cooling effect of warmer clouds is being underestimated by climate models.  The study itself has no open access, but a fine review with extra commentary has been put together by Carbon Brief, available at this link: https://www.carbonbrief.org/cooling-effect-of-clouds-underestimated-by-climate-models-says-new-study.

This review is well worth spending some time on.  It opens a wide door to a field of research that has a number of unresolved questions which have a reasonably good chance of soon being answered. These are questions that have a bearing on the future outlook for climate conditions, giving them a high degree of social importance, which means climate scientists have every reason to devote so much attention to the subject.  What I can’t see is why the “other side” of open questions about the impact of clouds on climate, this time from a warming standpoint, is not equally important, and thus worthy of equally intense study.  It’s possible that scientists are simply frustrated because of poor data to work with and not even a good idea about where to start investigating.  Here are some thoughts about a good starting point:

If you are looming under stress, anxiety and depression due to the activities at work and home. buy viagra without rx In this article, you will get an overview of some of the most popular options, complete with objective facts to help you make the best decision for the success of your sexual life. generic cheap cialis As they decide the better dose for you, and in this levitra price way provides ample time to enjoy. Effects on digestive system: Ashwagandha viagra in increases appetite .

Everyone should recognize that exact measurements of specific total PW content over every corner of the globe are available right now, every single day, and nicely mapped out. So are daily temperatures and their departure from historical averages for every corner of the same globe, again nicely mapped out. A scientist who spends a little time looking at these maps should quickly spot some interesting relationships, possibly enough of them to spark some real curiosity. Every scientist knows that the two principal components of PW are water vapor and cloud formations, that both of these are leading producers of greenhouse energy effects, and that even if their relative effects cannot be separately measured they are almost certain to be imposed in combination. In that case perhaps a way could be found to evaluate the combined effect (the possibility of which I have already demonstrated), and perhaps the result might be suggestive of something meaningful, with indications of how to go on from there with or without a full separation of the greenhouse effects.

Carl

Posted in Daily Climate Letters | Comments Off on Climate Letter #1954

Climate Letter #1953

Carl’s theory of precipitable water’s (PW’s) greenhouse effect generally relates to the strength of that effect.  The theory got started based on the idea that, in spite of big differences in its principal components, PW can be treated holistically, in terms of total weight, with respect to evaluating its strength.  This idea depends on three main lines of evidence.  One is the fact, which I think is indisputable, that any transformation of material state from one component of PW to another has no effect on total weight.  The only thing that does change is the physical state of widely varying portions of the same H2O molecules.  Second, the total weight of all the H2O molecules in contiguous vertical columns of air across every part of the globe, from the surface to the top of the atmosphere, is being accurately measured from satellites and reported many times every day.  Third, historical changes in the data that is gathered can be compared, in a meaningful way, with historical changes of surface air temperatures on almost any single location of the planet, using guidance derived from calculating the daily averages of each. 

Using information provided by a set of weather maps I was able to find a simple and admittedly imperfect way to make these comparisons. Observations are regularly obtained that reveal an amazing level of consistency between changes in PW weight and changes in temperature, to the effect that, subject to certain limitations, any doubling of an existing overhead PW weight will quickly add approximately 10C to surface air temperatures. The effect is fully reversible, and has so far the observations have yielded only a small margin of error. I have come to a conclusion that the energy requirement for such temperature increases could only be attributed to PW’s greenhouse effect, largely produced by a holistic combination of the otherwise separable effects of water vapor and cloud cover, and regardless of their relative proportions of total weight content.

If and when this idea is validated through more refined measuring methods it will surely be of scientific interest. We still need to learn more about putting such information to good use, knowing that the distribution by weight of PW throughout the atmosphere is extremely variable and highly erratic, in time as well as space. This is quite the opposite of the kind of regularity expressed by all of the well-mixed greenhouse gases like CO2 and methane. Scientists have learned practically practically everything there is about how these gases are controlled, which is of great help not only in making predictions but also in finding specific means of mitigation tied to practical means of control. All we really know for sure about PW is from certain rules of a more general kind, such as that whenever heat is added to water there will be more evaporation, or that a cooling of air temperatures increases the rate of condensation of vapor in the air, and more of this same type. Reducing global air temperatures is not an easy thing to accomplish, and there isn’t much else in sight by way of opportunities for mitigation.

It re-sensitizes the nerves around the penile cialis generico in india region. Last week, the Philadelphia 76ers announced generic sildenafil india that Iverson would not be playing for the rest of the season. The list of ED treatment varies from cialis cheap online counseling, lifestyle changes, drugs, and surgery. Therefore, if you feel a little embarrassed about purchasing this drug in person, online buying can be the best option for you. cheap generic tadalafil

Carl’s theory adds further perspective to this issue in part 2. The main point is that the relative strength of PW as a greenhouse energy producer is not at all dependent on how much of it is added to the atmosphere, or any grand total for the day, or the like. Its level of strength is completely dependent on how and where it is distributed, as realized in countless places and countless volumes of concentration. In the tropical zone you could add any amount you feel like, and it will hardly make a bit of difference in temperature. In Antarctica, adding just the tiniest little bit of PW to the air ccan easily cause a big jump in temperature on the same day. Everything about strength works according to scale, and the scale itself is logarithmic by nature.

Carl’s theory also throws light on the character of PW’s distribution in the atmosphere.  At or near the surface, while dependent on numerous factors such as surface temperature, time of year, elevation, availability of water resources, vegetation and so on, distribution is quite regular
and consistent.  These natural changes are slow and steady, seldom large enough to have a pronounced effect on temperature.  Up higher in the atmosphere, in places where there is a completely different wind system to go along with a total absence of familiar surface fixtures, we have an entirely new situation.  Any PW that is able to gain entry to this realm will have far more mobility than PW below, but will still be subject to certain limitations unique to the regime. The mobility that is most fully realized, when applied to occasional concentrated streams of PW and its ever-present greenhouse powers, can have dramatic implications when added to the greenhouse effect produced by lower layers that happen to have much less density. This kind of information may be of no help in finding means of mitigation control, but it could potentially be put to use through improving current predictions of future climate change.

Carl

Posted in Daily Climate Letters | Comments Off on Climate Letter #1953