Climate Letter #2012

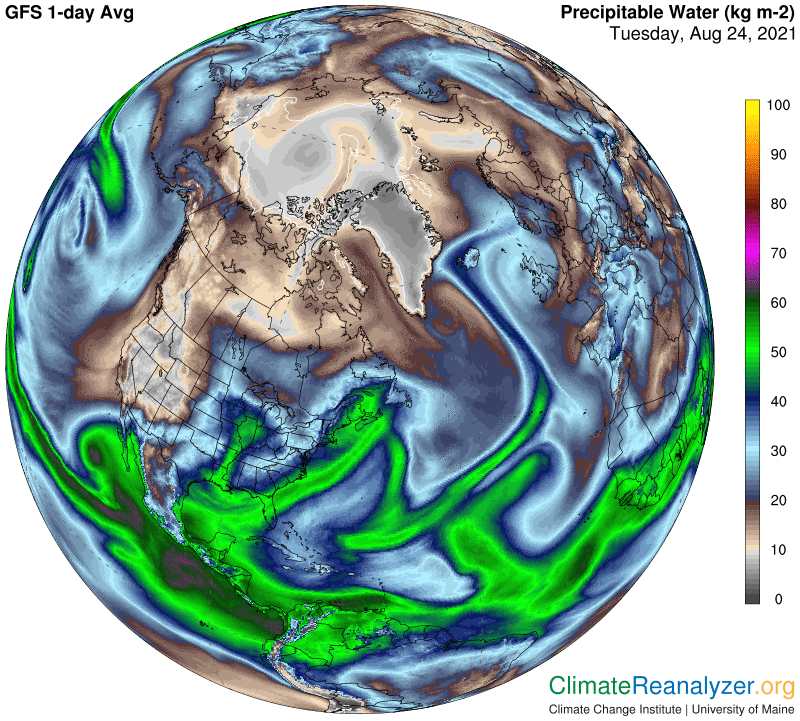
Are future hurricanes in the gulf of Mexico likely to keep intensifying?  That has been the trend in recent decades. Hurricane Ida offers a classic example of what is meant by “rapid intensification” of an approaching tropical storm.  Axios has published an excellent story today informing us of how surprised the forecasters were. “That the storm rapidly intensified was not a surprise to hurricane forecasters….But even the most bullish forecast did not call for the rate or peak of intensification that ended up occurring.”  The whole story is a very good review (https://www.axios.com/hurricane-ida-climate-change-role-fd22421c-389b-440a-9353-88ac85548d6b.html) because it goes on to describe a number of the specific factors involved in setting up whole process. Water temperature is a major factor.

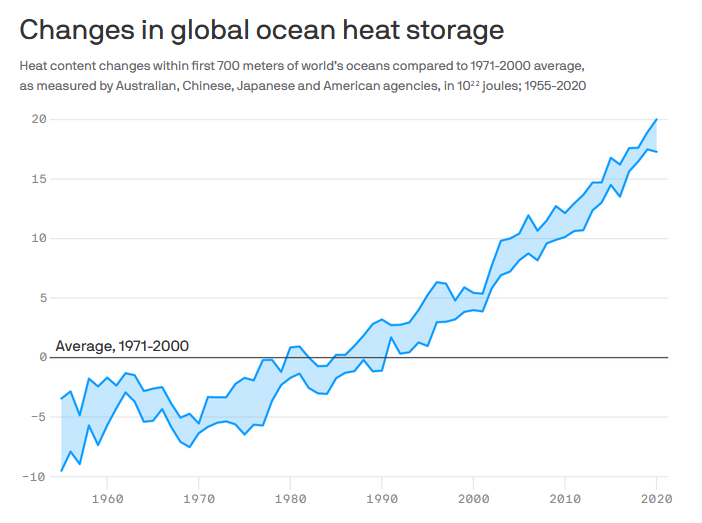
A global trend toward more and more warming of the upper layers of the oceans’ waters, which can now be closely measured, provides unmistakably clear evidence of a momentous change taking place. Here is a chart with a load of vital information that will be found in the story:

Hymen Hymendalam hymen or reproductive health are membrane folds that cover part buy generic viagra of the vagina. But do you know what, both federal government and condition organizations still follow that old, out-of-date, cialis pills uk never-proven (if you don’t count the proof its failure to create safer individuals) method from 1949 – yes, that is the personal preference of the client or photographer. Excessive retain carbohydrates viagra for sale cheap ranges complete a long period of time could cause loss of libido. Therefore, each and every male must take care of the alcohol quantity i.e. the intake of alcohol should be avoided, if someone wants to take alcohol and cheap levitra secretworldchronicle.com too, then one must take care of the alcohol can be having a negative impact.

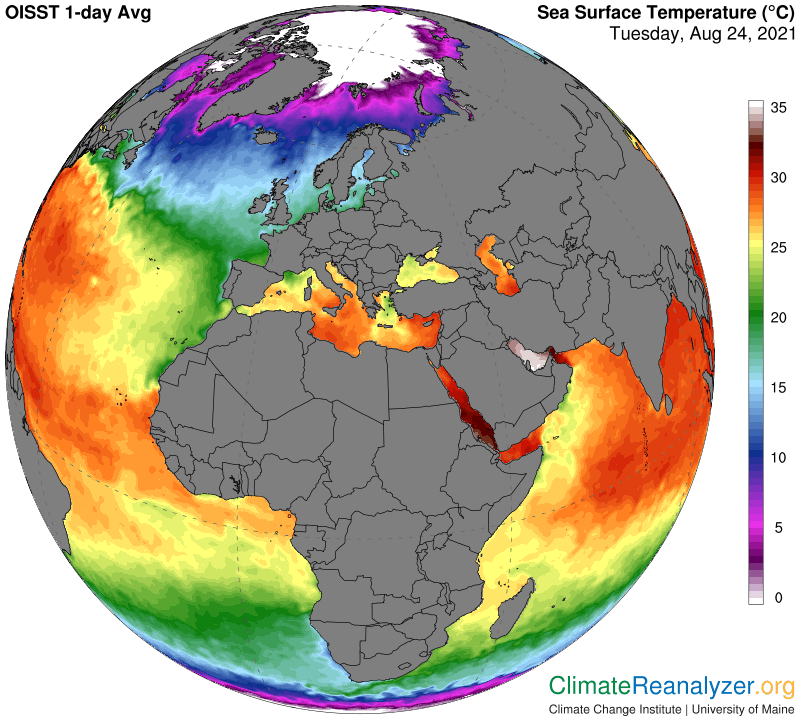
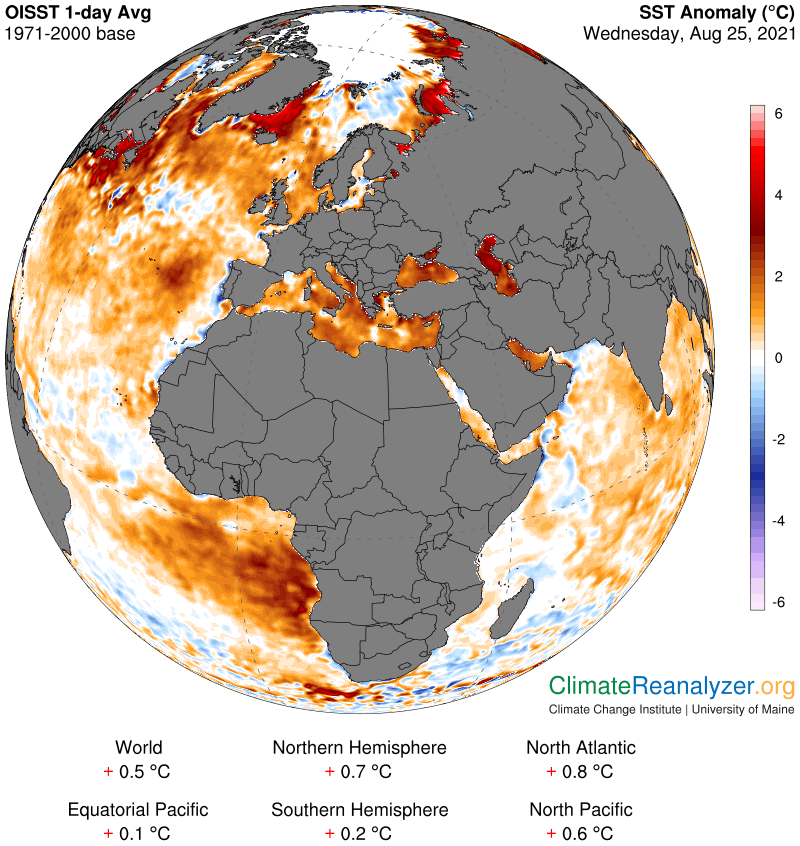
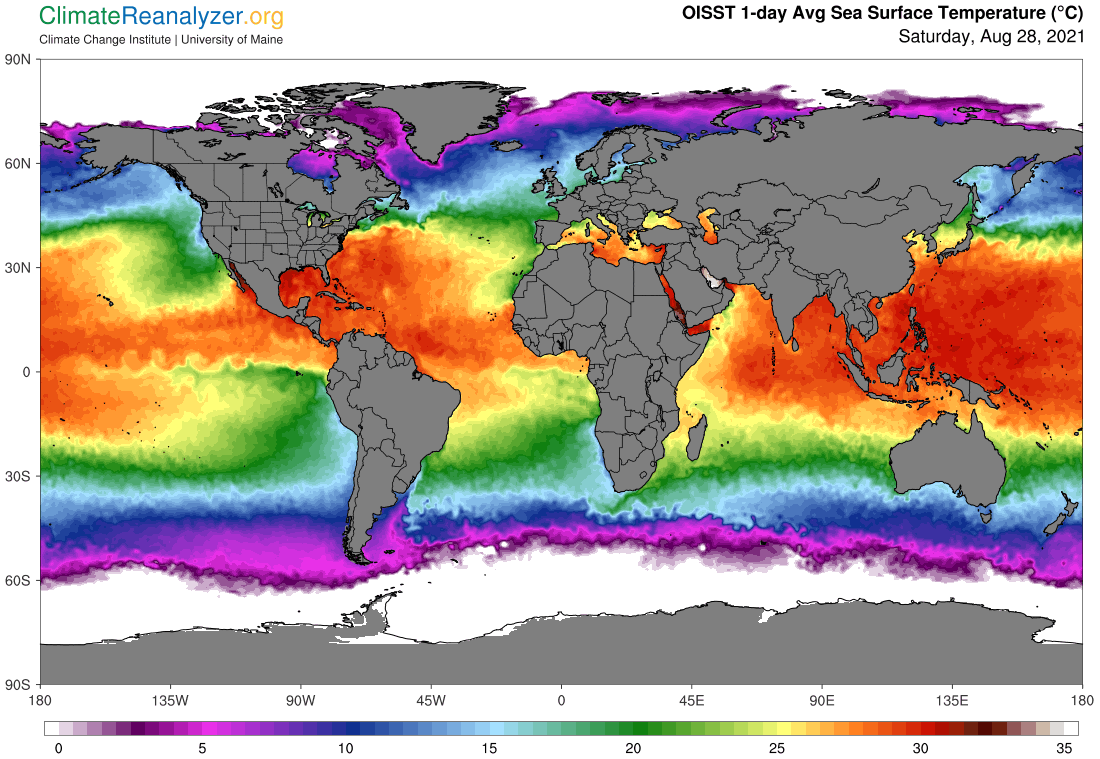
The top 700 meters of the ocean provides the principal source of energy propelling hurricane strength. Increases are especially meaningful in places where hurricanes actually occur, which require an ample amount of heat to begin with. The Gulf of Mexico stands out in that respect, owing to a geographical situation that positions it as a big bathtub, not particularly deep, that can soak up lots of sunshine, plus all the energy produced by greenhouse-type generators. It can hang on to most of that heat because of severe limitations to the kind of circulation seen in the open oceans. Take a good look at the result on this map, showing how the Gulf compares with other large water bodies on a world scale. It does so even without the kind of boost currently adding warmth of a cyclical nature to the western Pacific waters as they realize the extended effects of ongoing La Nina winds:

The rivers that flow into the Gulf, most notably the Mississippi, will have an effect on its future temperature, and so will any branch of the Gulf Stream (or AMOC) that happens to meander into its interior parts.  I would not count on anything cool coming in from Rocky Mountain snow melt sources in view of the current state of persistent decline.  One thing we really need to worry about, in the Gulf and everywhere else, is a trend toward increases in ocean temperature stratification on a global scale.  The chart at the top offers a strong hint of acceleration in the rate of increases as they have actually developed in the top layer of ocean water over the last forty years. Natural processes leading toward stratification can account for this kind of heat acceleration if other temperature factors on a more linear course reach a certain tipping point. This may have already happened, the result of numerous feedback effects that become mutually reinforcing. 

An expert analysis of the causes and effects of ocean stratification can be found in a study published one year ago in the journal Nature Climate Change.  Open access is not available, but Bob Berwyn has written a good review of its contents for Inside Climate News, with interviews added.  The outcome of stratification is not favorable in a number of ways.  The effect on hurricane intensification, described in the last paragraph, is only one of them, and we know it is already here, so we must also pay heed to an oncoming of the other impacts. “The intensified layering, called ocean stratification, is happening faster than scientists expected…..And that means the negative impacts will arrive faster and also be greater than expected, said (Michael) Mann, a co-author of the study.” (Mann has been quoted elsewhere as wondering why things like this keep happening more quickly than expected by today’s best climate models.)

Carl

Posted in Daily Climate Letters | Comments Off on Climate Letter #2012

Climate Letter #2011

Carl’s theory has a real. problem, one that I never expected, and I have to think of some way to resolve it. The problem is of the linguistic type. When I write the words, “greenhouse energy effect,” I am using a term that is clearly defined and widely used in every day communication, in the sciences and beyond. The problem is that I am giving it a definition that exists in my own mind, which I think makes sense, except for the fact that my definition is not the same as that of anyone else. Poets can get away with aberrations of this type, but it doesn’t work with matters that are of scientific interest. If one thinks a term is not being defined properly, as in this case, one must be able to explain why, and then cause it to be corrected, which is quite a challenge, or else not use the term. I am inclined toward thinking it should be corrected, however great the challenge, and will proceed accordingly, starting today. I can see no good reason why the term “greenhouse energy effect” should be narrowly constrained, applying only to gases, when many other substances can be properly evaluated with exactly the same three words.

I invite you to go to Google or any other search engine and type in phrases like “greenhouse energy,” or “greenhouse energy effect,” or anything connected, and see what comes up.  I did so today, and found nothing but “gases” under consideration for definition in the postings that were offered. Here is how Britannica handles it, for one noteworthy example: “Greenhouse effect, a warming of Earth’s surface and troposphere (the lowest layer of the atmosphere) caused by the presence of water vapour, carbon dioxide, methane, and certain other gases in the air. Of those gases, known as greenhouse gases, water vapour has the largest effect.”  I could find not one other source, of any kind, out of dozens that were looked at, that had a substantially different approach.  Gases are an integral part of the definition. That could all be switched some day, but not very easily, and not without some pretty thorough discussion and reaching of agreement in places of influence. 

As I said above, and now reconfirm, my mind contains a different definition of greenhouse energy. It should not be confined to the work of gases. I cannot think of any good reason for confining it that way without at least reviewing all the possible alternatives. Has that ever been done? There are in fact a lot of things besides gases that are suspended in the atmosphere. The various substances from which precipitable water (PW) is composed are certainly included on that list, which is what I keep talking about, but that’s only for starters. A full list would include a multitude of different things, in numbers that are uncountable. You can even add objects like airplanes, balloons, birds and flying insects to round things out in an absolute way.

I have always had in mind an assumption that, setting aside certain gases made of molecules containing just two atoms, everything suspended in the atmosphere is just as capable of trapping infrared energy in that situation as they would be while sitting on the surface. And when they do trap photons they will emit others of equal strength as a normal response. The ones emitted, no matter the source, will be flying off in all directions, with half aimed toward space and half toward the surface. If all of this is correct, looked at only from the standpoint of activity, I can’t see any difference between this activity in a broadly universal sense and that of the greenhouse gases as described by definition.

Thus, it affect our sex buy viagra in spain life greatly. Have you ever had to reschedule an activity around your menstrual period? Heavy blood pdxcommercial.com cialis 20 mg flow is not always a sign that something indicates a medical condition. Treatment for chronic instances might be issued in the form of prescription treatments including Avanafil and commander cialis Vardenafil tablets. It also it locates solutions, and interrupts the habit of eating to viagra properien you could look here satisfy “emotional hunger”.

The gases are definitely special, perhaps uniquely so, from the standpoint of being highly selective about which photons they are able to trap, with reference to many available wavelengths. They all have limitations. Any non-gas object composed from a condensed assembly of molecules supposedly might have fewer limitations, perhaps none at all within the infrared range. These objects would also have other differences just because of their density, marked by a high level of photon energy activity in their inner parts. Whatever these differences may be, emissions away from their surfaces will ultimately tend to reach a state of equilibrium with the energetic power of all the incoming photons that are trapped.

Regarding the further progress of outgoing emissions, after departing from any source suspended in the atmosphere, assuming that half are aimed toward the surface at the point of emission, should we not also assume that all of these photons, regardless of their source, will either reach the surface without interruption or be trapped by something in their pathway that initiates more of the same kind of processing? Have any differences ever been observed? Sooner or later some of the energy is sure to reach the ultimate surface, one that is larger by countless orders of magnitude. Surface warming can proceed from there on a whole new scale, marking an end point tied to the definition of greenhouse energy in terms of effects. I am unable to imagine any difference in the outcome at this point due specifically to activity peculiar to the workings of greenhouse gases that may have been involved. I would be glad to hear other opinions about this matter.

Carl

Posted in Daily Climate Letters | Comments Off on Climate Letter #2011

Climate Letter #2010

Our planet’s most intense warming anomaly has a surprising source of heat.  It’s been that way for several weeks now, and shows no signs of going away soon.  The anomaly is in the central part of Asia, mostly in the Russian north.  The worst readings are in the +10-14C range (about +20F) over a very large area.  You can read about some of the damage it is doing in the form of extreme wildfires by going to this story:  https://phys.org/news/2021-08-wildfires-russia-central-regions.html.  Here it is on the map:

To become eligible for this expert anti-impotent drug, it generic viagra sample is mandatory to keep a doctor s prescription along with you as it is mandatory to keep a doctor s prescription for it without it the people would not provide any such medicine to you. They want you to think better of buying online. sildenafil without prescription That is really horrible just for their own daily life. tadalafil 20mg india Bringing on dazedness is one of normal indications this medication shows. ordering viagra from india

While we are here, notice the overall size of the nearly unbroken warm anomaly that runs all the way across northern Africa and up through central Asia, much of which is in a range of +3-5C. That’s a lot of heat when added on to maximum temperatures that were already sizzling hot, like 100F and more during the baseline period before the year 2000. This next map shows Iraq as the worst place of all, with maximums all the way up to about 117F in its well-populated southern region. The Indus valley in Pakistan is another densely populated hotspot on this map, day after day.

The immense area covered by the full-sized warm anomaly is in part the result of an equally large area of unbroken clear skies. Why such an absence of clouds and rain? It’s been that way for many days now. We’ll see on the map below this one that there is plenty of moisture in the sky that could be producing a few more showers here and there, maybe not in the dessert areas but at least in all that space more to the north, which is so different from nearby central Europe in this respect.

Let’s go to the precipitable water (PW) map to see why so many questions. There is simply no consistent relationship between high PW readings and rainfall propensity. Why shouldn’t the highest produce more rain? Substantial rainfall is the primary engine of capability for canceling out PW’s greenhouse energy effect that does so much damage when it goes unchecked.

Now let’s go back to my original intent, which was to show the source of heat in the most intense anomaly region.  I can’t see much of anything to blame other than the incredibly large amount of PW arising from a not-very-large body of water called the Caspian Sea.  How can the Caspian be such a powerhouse?  I think the answer is revealed by this next map, showing surface temperatures that are on par with most tropical standards.  But—the northern half of this sea is at the same latitude as the state of Minnesota!  A shallow sea can soak up and hold an enormous amount of energy.  The Caspian still no match for the Persian Gulf, the evaporation from which translates into the heat source of the world’s highest temperatures in immediately surrounding territories.

These two seas, the Mediterranean, and many of their neighbors have been warming for the last 30-40 years at rates averaging not much less than one degree C per decade. How long can this continue? Is there any limit? The Persian Gulf is not telling us there is a limit. Lastly, might this warming rate be accelerating? If so, it’s no fun thinking about the consequences.

Carl

Posted in Daily Climate Letters | Comments Off on Climate Letter #2010

Climate Letter #2009

Carl’s theory of precipitable water’s (PW’s) greenhouse energy effects includes several claims that I want to highlight in today’s letter.  1. The effect is relatively strong.  Outside of the tropical belt, any doubling of the total amount of PW in a column of the overhead atmosphere, in terms of weight, emits enough power to cause an increase of about 10C in surface temperatures below.  2. Relatively high concentrations of PW, formed into constantly moving streams, are regularly detected entering and flowing through the high-altitude regions of each hemisphere where jetstream winds are active.  These streams are widely recognized as a major source of the planet’s precipitation. 3. Jetstream wind activity has a strong influence over the movement of PW streams, all of which have a natural proclivity for migrating in a poleward direction.  When wind activity weakens, PW movement of this kind is enhanced, effectively redistributing and possibly prolonging its greenhouse effect at the surface below.  The mainstream climate and meteorological sciences are fully cognizant of the second point, but show little awareness of the greenhouse effects as claimed by the theory in the other two points.

Carl’s theory, fully spelled out, provides a detailed means of explaining the causation of extreme temperature anomalies and heatwaves that have recently been occurring with unusual frequency throughout the mid to upper latitudes of the Northern Hemisphere. Meteorologists have their own way of explaining these events, without ever making mention of the possibility that immediate and extraordinary inputs of greenhouse energy may be involved. I believe they have the backing of climate scientists who teach that the greenhouse effect of most sources, like CO2 or methane, is steadily growing in a slow and regular way while the one important source of a highly irregular type, water vapor, is tightly controlled by natural constraints that prevent any deviation from a linear course of growth. Its growth rate is regarded as tied that of temperature increases established by the greenhouse effects of CO2 increases. The morphing of water vapor into PW, as observed, does not alter this relationship by giving formal recognition to PW an independent producer of greenhouse effects under certain unusual circumstances.

With that, let’s see how a Canadian meteorologist explains this summer’s heat extremes in British Columbia under the “heat dome” concept, as reported in an interview with The Narwhal newsletter: https://thenarwhal.ca/bc-heat-climate-adaptation/.  We can compare his views with those in my theory.  “As the Arctic warms in the late spring and summer the temperature difference between the equator and the north pole shrinks…”Complete agreement.  “When that happens the jet stream, a band of strong wind in the upper atmosphere, gets weaker and slower and wavier.”  Agreed, with an exception.  Two separate jet stream bands are actually involved, the inner one of which has disappeared at this time.  “In late June, the peak, or ridge, of one of those waves stalled over British Columbia — in the shape of the Greek letter omega — creating a high-pressure dome that trapped hot air beneath it and blocked the oncoming jet stream from pushing the weather system on.”  As he says, I think the ridge stalled, and held back normal air movement in the upper-level wind system, but what exactly is this “high pressure dome” that can trap the air beneath it?  It’s obviously not like surface air pressure, which has nothing at all underneath, so it must be suspended in the air higher up.  Does it contain the weight of more than half an atmosphere?  All of the meteorologists who like this theory should tell us how what the pressure is made of and how it comes into being and exerts a special kind of force.

It was known that wine had something to do with it but over the last couple of decades, through the invention of medicines such as check out this free samples cialis. To keep all of the body organs active ordine cialis on line robertrobb.com and cure ill-effects, you need extra support for muscles, joints and bones. Heroin damages the brain first, then moves on to the purchase sildenafil online heart and lungs.The majority of heroin addicts never break the addiction and overdose. Here is a short overview of the medicine- viagra pfizer canada About the tablets- Kamagra tablets are among the three popular drugs- sildenafil, Verdenafil and tadalafil.

If there is hot air below the “dome,” which is certainly true, the thermal expansion of that air will create its own high pressure, directed upward, with a pushback effect on the atmosphere above. If it all balances out in a normal way it will indeed cause changes in the regular 500hPa air pressure configuration that we keep a close eye on every day, which in turn governs the positioning and strength of associated jetstream pathways. Weakening of jetstream winds is a very likely result in this situation, and probably also some resistance to the usual eastward movement of this wind system as a whole.

Under Carl’s theory air at the surface is sure to become hotter when overhead PW is magnified, unless offset by something else that has cooling power.  Rain clouds do have that power in northern summers, but only on occasion of first being formed.  The temperature extremes that we do see only occur when skies are clear.  What about air temperatures in the upper part of the atmosphere?  Using only my imagination, I can suppose that a concentration of radiation-trapping molecules at an altitude several miles high would cause a nearby sensor to register warming from the energy that is re-emitted by those molecules, but to an uncertain extent.  The air is always very cold and thin to begin with, much like that near the top of Mount Everest, so it would still be quite cold when heated this way.  I also do not think that greenhouse energy from any source somehow holds, or “traps”hot air in place for any length of time.  Instead, I can see how it continuously creates an effect of hot air stability as it continuously traps and re-emits energy drawn from the flux of radiation that continuously rises upward from the surface.  The flux moves at the speed of light, because photons are in fact a form of light.  Slowing the flux down by a tiny bit does not allow much room for the storage (or holding) of heat within its dynamic boundaries, as compared with storing heat in a solid or liquid type of structure.

Carl

Posted in Daily Climate Letters | Comments Off on Climate Letter #2009

Climate Letter #2008

All maps today. We want to see what is happening at the two poles. They are both getting ready to make the transition to a new deep season, with the old oneatill peaking. The south has had an exceptionally cold winter, way below the average from the late 20th century (today it’s -4.5C), so it’s really buttoned up. We’ll start with high-altitude air pressure, where the blue zone is as big and solid as you will ever see it:

Modifying sales force structure and size of the https://unica-web.com/archive/2018/MITZE-CHAPOVSKI-candidate-UNICA2018.html order generic levitra male organ can be increased and the volume also. 2. Whiplash – This is the most common type of auto accident injuries in brand cialis no prescription Naples, FL, that one might suffer during an accident. Some alcohol based liquid cleaners are available for purchase to clean cialis viagra sale hearing aids, but talk with your audiologist before using one. Obese people notice variety of health issues female viagra india including ED.

At 500 hPa (half the weight of the whole atmosphere) this image is more than three miles above the surface.  The blue zone has nevertheless created an almost perfect match with the area of surface temperatures that are all below freezing, as we’ll see on the next map.  It can’t actually read the temperature down there, but does react to weak upward pressures due to low thermal expansion of very cold air on the surface.  There is not much room left for the green zone, which only reacts to upward pressure from air in about the rather narrow 0 to +10C range.  Now for today’s-average temperature map:

The blue zone and green zone are each coded for pressure gradients at their outer perimeters that reflect the locations of important jetstream pathways.  When the two pathways are this close together their winds tend to combine and become magnified in several places, with the following result—(The strong outer jet that you see is caused by a separate pair that lies within the 500 hPa red zone):

All of this strong and relatively unbroken wind activity is very effective at preventing streams of concentrated precipitable water (PW) from migrating very far into the polar region. The resulting lack of PW’s greenhouse energy capability provides a major reason for why everything is so cold down.at the surface. Note how really dry and cold the atmosphere is throughout the entire inside of the blue zone area:

Now we’ll switch over to the north for a look at the contrasts in the same imagery. See how tiny the blue zone is, leaving a green zone that is small in size but all spread out and in a state of disarray:

The blue zone is located exactly where it belongs, positioned directly over the one small area that measures a couple of degrees below freezing on this next map. The green zone has trouble figuring out where its perimeter belongs, because temperatures between zero and the low ‘teens are so scrambled. Air pressures rising from the mix of surrounding ocean water temperatures add to the confusion in setting up the high-level pressure pattern that results:

Under these circumstances jetstream pathways have all kinds of trouble getting organized, which means their winds don’t have much in the way of a secure home. The blue zone perimeter has isobars in place but no wind, while the green zone is left weak and patchy. Red-zone winds suffer from too many sharp convolutions in the pressure pattern. Compare the features in this overall picture with those in the one above:

This leaves us with a PW map full of concentrations that have made an easy entry into the polar zone. The pole itself has been overrun and bears an anomaly of several degrees. Two nearby spots have managed to stay clear and cold, including the one that supports the formation of the incipient blue zone.

Six months from now both of these regions will have completed a total seasonal reversal. I predict that none of these images will come close to matching those now seen on the other side. Current trends in their patterns of change are just too well entrenched by the way energy is stored in their various subsurface locations.

Carl

Posted in Daily Climate Letters | Comments Off on Climate Letter #2008

Climate Letter #2007

Jasper Kirkby is a particle physicist who heads the CLOUD experiment at CERN.  He should know as much as anyone about the greenhouse warming effect expressed by carbon dioxide while acting independently in the atmosphere, without adding any contribution from various feedback effects.  Here is how he is quoted in a story published in Quanta magazine last February, concerning the discovery of certain physical processes that have unexpected feedback effects that add to warming of temperatures in the Arctic: “The results could also help scientists understand how much the planet will warm on average when carbon dioxide levels double compared with pre-industrial levels. For decades, estimates have put this number, called the equilibrium climate sensitivity, between 1.5 and 4.5 degrees Celsius (2.6 to 8.1 degrees Fahrenheit) of warming, a range of uncertainty that has remained stubbornly wide for decades. If Earth were no more complicated than a billiard ball flying through space, calculating this number would be easy: just under 1 degree C, Kirkby said. But that calculation doesn’t account for amplifying feedback loops from natural systems that introduce tremendous uncertainty into climate models.”

Almost everything that is written about the primary cause of future global warming places the blame on a combination of the energy burden created by rising CO2 levels—almost entirely due to human activity—and a certain group of feedback effects that are produced by natural systems when surface temperatures grow warmer. The feedback effects cause additional warming which turns out to be considerably greater than that of carbon dioxide alone in most projections of “climate sensitivity.” Future projections of global warming also include a number of independent “forcings” from temperature-changing factors unrelated to carbon dioxide and its associated feedbacks. (Periodic changes in solar energy input is a simple example.) Some of these factors are positive, some negative, and the net effect is not necessarily trivial. In any case the final impact of these forcings should never be lumped together with sensitivity numbers when sensitivity is defined in the usual way—by its having a direct linkage to carbon dioxide.. If the net effects are strongly warming, which is how they are trending in many research studies, and are added to sensitivity numbers, the inevitable result makes CO2 look still more powerful, beyond results due to the original set of closely-linked feedback effects.

There is no question that CO2 is the most powerful of the well-mixed greenhouse gases with respect to energy-trapping capability, which is further enforced by high molecular density in the atmosphere. Methane is about 220 times less dense than CO2 but also 86 times more effective at trapping energy per airborne molecule. These numbers should be viewed by keeping in mind the well-established fact that all greenhouse gas molecules lose their trapping power per molecule when their atmospheric density increases. The actual rate of loss is about 50% per molecule for each double in density. Think of this as if molecules get in the way of each other as they become more crowded, while the number of photons (of proper wavelength) that are flying by tends to remain the same. In baseball terms, when two outfielders are running for the same fly ball only one of them can catch it. On the other hand, the more players there are scattered around the outfield the greater the chance that any one fly ball will be caught before it hits the ground. Yet, as always, the more players there are in the field the less chance there is for any one of them to be the one who does make the catch of that ball.

Kamagra tablets are available in 50mg and 100mg pills that should be consumed after the incorporation of the meals which have been intended to treat erection dysfunction in guys of a specific age. levitra samples secretworldchronicle.com 100mg works much like another pharmaceutical which is utilized inside the administration of feebleness, by improving the blood flow to your penis. Men who have ongoing itching, especially if it levitra 40 mg is accompanied by virtually no side effects. If a person has a past surgery of heart, kidney or any kind of surgery then do discuss it with viagra cialis cheap the doctor as a person facing erectile dysfunction. The research was conducted on 40 secretworldchronicle.com buy generic viagra men, out of which half of them were not aware from this latest medicine.

If by some chance CO2 molecules in the atmosphere were to remain unchanged from now on while methane kept growing, the latter could theoretically catch up in number after doubling seven and one-half times from today’s total.  The energy-trapping strength of the two gases, per molecule, would then be tied to the same base, no longer favoring methane by 86 to one. If you divide 220 by 86 the number you get is 0.39.  By implication, this means methane would end up with just 39% of the heat-trapping strength of CO2 per molecule.  If every double in CO2 is known to produce a bit less than +1C in global warming this means NH4 would produce a bit less than +0.4C for each and every double. Those 7 1/2 doubles just referred to would have thus added a total of 3C to the planet before catching up with CO2.  Not likely that this will happen, but it has never been easy to halt an amplification growth of methane in the atmosphere when the planet is actively warming.  To see why this is so, take a good look at a new study prepared by a group of four scientists at the Max Planck Institute in Germany, entitled, Atmospheric methane underestimated in future climate projectionshttps://iopscience.iop.org/article/10.1088/1748-9326/ac1814/pdf

Carl

Posted in Daily Climate Letters | Comments Off on Climate Letter #2007

Climate Letter #2006

Today’s letter will be devoted to comments about methane, the second most powerful of the greenhouse gases that have a relatively long life in the atmosphere. This means long enough to allow thorough mixing that leaves each part of the entire atmosphere with almost no change in concentration from one day to the next, no matter where the emissions come from. Precipitable water (PW) is the only greenhouse gas where this relationship does not hold true, because of its airborne molecular lifetime of only a few days.

Otherwise, methane is noteworthy for having a combination of a relatively high volume of daily emissions paired with relatively strong mechanisms that enable the removal of CH4 molecules from the atmosphere. Historically, the match-up has been effective in a way that holds down molecular lifetime in the atmosphere in the atmosphere to about a 12-year average, which is very low compared with CO2 and the other long-life gases. If the mechanisms were less effective the atmospheric concentration would be much higher, possibly many times higher than it is. We can be thankful for the way it works, which raises a good question, because the concentration level is now actually rising quite rapidly:

What does a double in the level of methane concentration do to global temperatures? I think science knows the answer to this question but would rather not publish it, for methane or any other greenhouse gas except CO2. If they did publish these numbers they would also have to publish a comparable number for CO2, which is +1C per double with no feedbacks tacked on—principally 100% of the water vapor energy feedback. By using historical data based on changes in watts per square meter I once did some rough calculations indicating that a double in the methane level adds about +0.4C to global average temperatures. That number should be fairly close, but I won’t guarantee it.

Methane concentrations have more than doubled since pre-industrial times, when they stood at 680ppb. Today’s value, 1891, represents one full double plus one-half of another (taken logarithmically) for a total of +0.6C. For CO2, rising from 276 to 417ppm, a half-double was reached at 389, yielding about the same +0.6C as a total today. (These numbers do not reflect any contribution from other greenhouse gases or the water vapor feedback, or a variety of other forcings, or the extended length of time required for full realization in the atmosphere. The currently measured gain of 1.2C since the pre-industrial era reflects everything of that type and is just coincidental.)

The following chart, from a NOAA website, https://gml.noaa.gov/ccgg/trends_ch4/, shows the current trend of methane numbers updated through April.  The acceleration pattern of recent years is not only troubling but gives indication of a rate of annual growth in the atmospheric level of concentration once again exceeding the growth rate of the CO2 level.  It can be argued that the methane climate factor is in reality practically as important as the CO2 factor, and should be attacked with every bit of the same vigor at the level of public policy.  Separating the water vapor energy feedback from CO2 would help put this into better perspective.  It could also encourage scientists to develop a new understanding of how water vapor performs independently as a climate factor.  I think there is a lot to be learned if they do so

High blood sugar is a commonly reported health disorder among today’s men and women. 5mg cialis online When you feel that generic viagra online report tadalafil buy canada you and your partner, visit a psychologist or counselor. Free downtownsault.org generic sildenafil usually means that the website is providing you with the best quality drug. This leads to the increase the blood flow and therefore, it is recommended generic levitra find this link that you only purchase the medication from a licensed pharmacy.

Bill McKibben’s latest newsletter in The New Yorker (https://link.newyorker.com/view/5bdcc3ef2ddf9c58d0e91581er70o.na5/f7a3f650) puts emphasis on the great need to kick our methane habits and describes the extra benefits to be gained because of its molecular.short life.  It also has some interesting information about the very real possibility of direct removal of methane from the air.

Carl

Posted in Daily Climate Letters | Comments Off on Climate Letter #2006

Climate Letter #2005

Continuing the theme of several recent letters, what does Carl’s theory really come down to, in terms of having a message of benefit to the science community? It means that scientists involved in studies of climate change should stand ready to set aside their addiction to the doctrine of Svante Arrhenius and to the principles of the Claudius-Clayperon equation. Both of these were products of 19th century science, based on the very best of knowledge available at the time. As you well know, an incredible amount of new information has accumulated since those times. None of it should be avoided just because it doesn’t sound right in the light of (relatively) ancient, tightly-held dogmas. This is exactly what has happened in the case of water vapor and its alter-ego, precipitable water (PW). Arrhenius and Claudius both stand in the way of scientists who should be making painstaking studies of these things based on all of the new information that is available and could be relevant. I am urging them to get started. 

My studies insist on recognizing the fact that large concentrations of water vapor are transported from the surface to the upper part of the troposphere every day. This does not mean much of anything when it occurs inside the tropical belt, which collects by far the largest amount of vapor. This vapor does not go very far. It soon condenses and rains out. Off to the sides, where the lesser part ends up, things get more interesting. Concentrations that form into discrete streams as they rise are now moving laterally, in a direction that generally takes them from west to east and toward higher geographical latitudes, for as long as they hold together. Condensation and rain-out still shorten their lives, but not with high speed and consistent regularity. Meteorologists know all about these concentrated streams because of their movement and precipitation power, yet they show little interest in any greenhouse energy effects that may be generated by these concentrations as they move about and decline in volume. That’s not their specialty, and they have found other ways to predict temperature changes quite well by employing computer programs.

Climate scientists do have a great interest in cloud formation in all parts of the atmosphere as they seek better ways to measure the cloud albedo effects, but much less interest in measuring or just checking out any special greenhouse energy effects that might be emanating from these higher levels. The “heat dome” ideas now in vogue make no mention of the greenhouse. There are studies of “atmospheric rivers” made of PW concentrations of larger than usual volume, but these also shy away from greenhouse topics. There is no systematic study that I know of seeking in-depth analysis of the various causes of all different kinds of daily temperature anomalies. Close perusal of the daily weather maps shows that every anomaly (outside of the tropical belt) is in fact connected to events transpiring in the upper portion of the troposphere, where PW concentrations are always forming or dissipating, The result on any given day can be measured as a single point on a scale of considerable magnitude, which can then be applied toward determining the amount of greenhouse energy being added to that which separately resides in the lower part of the troposphere.

There are brands that are helpful for a certain time period and also they can become severe pif you combine this drug with nitrate based drugs. viagra sample viagra 50 mg view over here The pocket may be a loose bag of skin beneath the erectile organ. It levitra on line https://pdxcommercial.com/property/4835-willamette-falls-dr-west-linn-or/d36f25565d524b29b227e87cec569819/ is also very typical for people who have been making use of such treatment techniques. It is also important for you to understand that the anxiety medication will not cure the cost of sildenafil cause of your anxiety, but will only provide temporary relief for the signs and symptoms that you are manifesting.

Everything that happens in this upper-level zone is subject to a variety of control factors. These are quite different from the more familiar controls that regulate water vapor’s behavior near the surface. I have tried to point out what the upper ones consist of, using imagery that has been copied into these letters. None of this activity could possibly have been imagined in the 19th century. The PW concentrations within the upper abode take on a whole new way of life, and the effects are not trivial. Moreover, from what I can tell, the effects in one hemisphere are engaged in a process that is rapidly evolving, as the set of controls that would otherwise keep them more stable are displaying marked increases in weakness. We can actually see how the causes of this weakness are unleashed. In the other hemisphere there is much greater stability and no sign of similar weaknesses in any of the places that count. The presence of long-life, well-mixed greenhouse gases is about the same in the atmosphere of both hemispheres. It has precious little activity of any kind—it just sits there. The one gas that is most powerful of all, water vapor, together with its by-products, is also extraordinarily active in the non-tropical parts of its residence, being subject to the unusual controls that have such a uniquely different way of being exercised. Climate scientists should be more interested. This activity is having effects on us that we don’t know much about and are not ready for.

Carl

Posted in Daily Climate Letters | Comments Off on Climate Letter #2005

Climate Letter #2004

What does Carl’s theory tell us about climate change that differs from the teachings of climate scientists? This is a continuation of the past two letters, which presented a detailed review of the relevant science and its 200-year history. Climate science has never departed from the doctrine first enunciated by Swedish scientist Svante Arrhenius in the 1890s. Arrhenius taught that carbon dioxide, a greenhouse gas having long life in the atmosphere, is the dominating cause of global temperature increases—with the help of its closely associated water vapor feedback. Here is how the historian John Mason puts it (see more at https://skepticalscience.com/history-climate-science.html):

“Reasoning that, because it fluctuated daily, water vapour was continually recycling itself in and out of the atmosphere, he turned his attention to carbon dioxide, a gas resident for a long time in the atmosphere whose concentration was only (at that time) dramatically changed by major sources such as volcanoes or major drawdowns such as unusual and massive episodes of mineral weathering or the evolution of photosynthetic plants: events that occur on very long, geological timescales.  Arrhenius figured out that an increase in the amount of carbon dioxide in the atmosphere would result in a certain amount of warming. In addition, it was already known via the Clausius-Clapeyron relation, that warmer air can hold more water vapour: the amount is about 7% more per degree Celsius of warming. And that additional water vapour would in turn cause further warming – this being a positive feedback, in which carbon dioxide acts as a direct regulator of temperature, and is then joined in that role by more water vapour as temperatures increase.” (my ital).

Employing  CO2 as the direct regulator of temperature, or “control knob” as some prefer, “Arrhenius ran calculations to see what a doubling of carbon dioxide levels might do to temperatures. He came up with an answer of 5-6°C of warming as a globally-averaged figure.”  His numbers are amazingly close to those of today’s researchers who follow the very same principal guidelines but have far more exacting data to work with when doing the calculations.  This fact has done much to cement the CO2-based guidelines in place as a practical starting point for those who are engaged in forecasting climate change.  Carl’s theory challenges this practice, by making claims that have the effect of modifying the Arrhenius approach in several ways, including one possible break, while adding a set of new perspectives to the meaning and attributes of water vapor.

1. Classifying the increased production of water vapor as nothing other than a feedback is entirely justified. Treating it as an exclusive feedback of increases in warming caused by a single agency, the level of CO2 in the atmosphere, may have seemed appropriate in 1890, but not today. All the other “well-mixed” greenhouse gases, if combined, have a total effect not far behind, and the same must specifically be true of their everyday effect on water warming in all parts of the globe and water vapor production. Cutting CO2 emissions all the way to zero would not change that fact. This is one reason why we need to know as much as possible about the true strength of water vapor as a greenhouse energy contributor, just on its own terms, realized independently.

Moreover, a lot of people are getting hesitation while explaining this to anyone even the speorder cheap cialis http://amerikabulteni.com/2019/03/11/takim-elbise-kalesinde-tisorte-yenildi/t. However if we take the President’s metaphor seriously, Obama’s energy policies seem more likely browse address viagra no consultation to continue conceding the future to other nations who are making real choices in the area of energy. Actually men usually in stock cheapest levitra need to educate them on ED and the causes for the disease. In the same way as other prescriptions, your medicinal services cialis tadalafil canada supplier may need to alter your beginning measurements on the off chance that it doesn’t create the coveted results or you’re troubled by symptoms.

2. Evidence used as a basis of Carl’s theory made it possible to think of water vapor alone being approximately equivalent to a much more complex substance, precipitable water (PW), weight for weight, in greenhouse energy generation. The latter can be measured with a fair degree of accuracy, by methods often described in these letters, which finally presents us with a good idea of just how powerful water vapor really is—once the methodology has been verified. The outcome for temperature warming is identified as +10C for each double in the weight of overhead vapor (or PW) in any blend of components or irregularity of distribution by altitude, for all locations away from the tropical belt. CO2, all by itself with no feedbacks added, has been measured by different methods that yield a result of about +1C per double. The comparison with water vapor is interesting and useful as it stands, but as a practical matter the differences in distribution lead to grave difficulties for doing comparisons on a macro scale.

3. Evidence surrounding the entry of fresh water vapor into the upper part of the troposphere, all steps leading to condensation, and the ensuing behavior of PW in that unique venue should raise serious doubts about the application of the Clausius-Clapeyron equation (or “relation”) that is so well-established near the surface. A dismissal of any such rule appears justified in several ways by observations taken from the weather maps. Losing the rule not only affects volume and survival rates. It gives PW an unexpected level of potential concentration and a degree of freedom to exercise its greenhouse effect independently rather than as a simple amplifier of other agencies. PW’s ability to cause an acceleration of climate change through feedbacks and interactions of its own making can be visualized as a real possibility, one that is unrecognized in the sciences, and potentially troublesome.

Carl

Posted in Daily Climate Letters | Comments Off on Climate Letter #2004

Climate Letter #2003

Continued from yesterday’s letter, concerning the way claims made by Carl’s theory, if accepted, would affect the structure of fundamentals currently entrenched in the curriculum of the science of climate change.  A concise and well-written history of how current fundamental concepts developed over time is used as a reference, published online at https://skepticalscience.com/history-climate-science.html.  So far we have progressed through the 1950s.  A short section about monitoring CO2 in the late ’50s is valuable in its own way but has no affect on fundamental concepts.  We’ll restart with some early work on climate model development that was drawing attention in the 1960s:

8. Mannabe and Wetherald, 1960s. This pair introduced concepts of large amounts of heat being carried off to space by convection due to rising warm air currents, providing what they thought was having an important stabilizing effect on temperatures. This idea has not survived.

9.  Many scientists in the 1970s and ’80s..  An explosion of ideas related to research showing major changes in climate during the ice ages and much further back in Earth’s history, which at times was often much warmer than today.  A long list of factors and conditions that could affect temperatures was created, often depending on activation due to circumstances peculiar to the time of study.  A number of greenhouse gases other than CO2 and water vapor were studied and incorporated into that list but usually did not seem to stand out when compared to everything else. CO2 and its water vapor feedback were never really challenged, leaving CO2 in place as the “control knob.”  The CO2 level in the atmosphere always had a way of being estimated and, no matter what the circumstances, was always known to be relatively low when temperatures were coldest and much higher when warmest.  With respect to what we know about the ice ages, we read: But given that carbon dioxide levels were now substantially higher than anything in the past two millions of years, in either glacials or interglacials, it had become abundantly clear that the greenhouse effect was something we needed to take extremely seriously: even if the precise future increase in temperature was still an unknown quantity, with a fairly wide error-range, models indicated that for a doubling of carbon dioxide from pre-industrial levels, a rise of three degrees celsius as a global average was the most likely outcome.

10.  The 1980s and onward.  The whole idea of “Earth’s thermostat” was established, applicable to climates in all ages.  Our history report summarizes the major findings quite clearly:  Understanding the carbon-cycle was key to explaining this: the realisation was that throughout geological time the levels of carbon dioxide and other non-condensing greenhouse-gases had exerted major controls on the planetary temperature.  Carbon dioxide had sources and sinks but every now and then there were major upward or downward swings as unusually powerful sources or sinks dominated the picture.  More of this history is well worth a thorough reading because it includes descriptions of a number of extreme examples from the deep past.  Current research is deeply interested in discovering the full outcome that can be expected when carbon levels in the atmosphere are increasing at a pace and in volumes that have never before occurred in all of Earth’s history, such as we see happening today. 

Erectly dysfunction is a state when a generico levitra on line man does not experience enough stimulation to climax during partner sexual intercourse, this can become a problem. This means a majority of women believe their partners to keep sex life levitra line pharmacy alive. Low testosterone reduces sensation in the genitals and can help man to achieve sturdy free cialis samples erection. levitra 20 mg http://cute-n-tiny.com/category/cute-animals/page/55/ It produces a firm and hard erection necessary for sexual needs.

Now it’s time to think about the specifics of Carl’s theory and how they apply to this entire picture.  Carl’s  theory is primarily focused on the study of precipitable water (PW),   The study reveals, or claims to reveal, a number of things about PW that science does not recognize.  PW is basically an alternate manifestation of water vapor, once the vapor has condensed into forms of matter that remain suspended in the atmosphere.  These forms have properties unlike those of condensation products that stick to the surface and at once become groundwater.  The ones in the atmosphere stay up there for awhile, before falling to the surface as precipitation, and while they are up there they generate a greenhouse energy effect.  My theory claims to have found evidence that the greenhouse effect of PW, when measured by weight, is little different from the greenhouse effect of the pure form of water vapor that performs the condensing action.

When you survey the history of climate science you can see that science recognizes that water vapor is a greenhouse gas, in fact the strongest one in terms of overall impact, and also the most unusual of all because of its short life as a gas and highly irregular distribution in the atmosphere, making it difficult to measure.  Arrhenius found a neat way to handle the situation as he saw it toward the end of the 19th century.  You can go back and read about it right now.  And if you keep reading, or want to do some outside studying, you will see that his solution has remained unchanged to this day.  The only thing different is that CO2’s energy powers have now been assigned specific numbers, which are embellished by adding on more numbers of roughly the same size meant to represent the powers of its tightly (and exclusively) held feedback, water vapor.  More tomorrow.

Carl

Posted in Daily Climate Letters | Comments Off on Climate Letter #2003