Climate Letter #2042

I have much more to say about the Dessler study, but for today’s letter I want to focus your attention on a recently published study that has received no attention at all in the media or drawn any kind of comment from within the science community.  There was never a press release.  The publisher, iopscience, based in the UK, is a low-budget, high-volume type of operation that has been around for a long time, covering things related to physics and many other sciences.  Everything is open access.  I stumbled into this study by accident, and opened it because the title was so interesting, “Atmospheric methane underestimated in future climate projections.”  The four authors are all on the faculty of Germany’s well-respected Max Planck Institute, all veteran scientists with a long publishing history.  Check them out.  These are the kind of people who know how to do research the right way, have done a lot of it before, and have earned our trust. They are worth listening to no less than any of the others who roll out scores of studies every week.  I was absolutely bowled over by this report, and urge you to give it a thorough reading:  https://iopscience.iop.org/article/10.1088/1748-9326/ac1814/meta

Here are a few quotes that I think are especially interesting:  “We find that natural methane emissions, i.e. methane emissions from the biosphere, rise strongly as a reaction to climate warming, thus leading to atmospheric methane concentrations substantially higher than assumed in the scenarios used for CMIP6…..The reason for these high concentrations of atmospheric methane is that the natural emissions of $\mathrm{CH_{4}}$ are substantially higher than assumed previously…..they rise roughly proportionally to temperature change in our model experiments…..Mean natural net $\mathrm{CH_{4}}$ emissions, i.e. the sum of emissions from wetlands, termites, fires, and the soil methane uptake, for 2000–2009 are 220 TgCH4 yr−1, and emissions increase by between 22% and 149% in 2100 CE (table 1), becoming larger than the 2000–2009 mean in all scenario experiments. Furthermore, net natural emissions keep increasing beyond 2100 CE in the scenarios with a radiative forcing larger than 2.6 Wm−2…..Our results show that the natural $\mathrm{CH_{4}}$ emissions will increase dramatically in high warming scenarios, compared to the late historical period. This increase is predominantly driven by the increase in emissions from wetlands, caused by the combination of warmer temperatures, higher $\mathrm{CO_{2}}$ concentrations leading to increased vegetation productivity, and changes in wetland seasonality or area.”

Also, the results described in this study could very well be underestimated for two reasons that I think are particularly noteworthy:  First, “However, the model version employed in our experiments does not explicitly consider permafrost and may therefore underestimate hydrological changes in present-day permafrost areas.”  Second, “…we do not have an interactive ice sheet model available at this time, and thus cannot evaluate the climatic consequences of the eventual waning of the Greenland (and likely West Antarctic) ice sheets.”  The authors describe numerous limitations that were carefully adhered to, making it unlikely that any of their principal conclusions are overstated.

Similarly, constriction rings used at the base of erection are effective to keep the same lingering for quite a while, then you may need to attempt a few times before Kamagra will work for you. bought this discount pharmacy viagra Zinc can come from buy levitra in uk food, synthetic vitamins or supplements. The second procedure, meanwhile, helps men get and maintain an erection by increasing the blood circulation to the always in stock order cialis online penis. It is very important to locate good surgeons in Delhi, India or carrying generic viagra from canada out the laparoscopic surgery.

What struck me perhaps the most about this study is the “big picture” realization of how closely natural sources of methane resemble those of water vapor, how variable and widespread those sources are, on surfaces found all over the globe, how substantial quantities of methane are naturally liberated from these sources as a direct result of warming temperatures like those we now face, and just how powerful these liberated quantities are in terms of adding yet more heat to the temperatures
that do the liberating.  This last is the precise definition of a positive feedback.  In other words, in recognition of further anticipated increases in global warming, we should be doing regular “methane feedback studies” for exactly the same reasons we do water vapor feedback studies, and with the same level of interest.  Moreover, they are both seem ready to amplify the amount of global warming simultaneously, which means they will each be constantly adding something to the amount of warming that amplifies the other—the very definition of a mutual feedback loop. Science should take a closer look, as a matter of preparation.  By all means this study I have described should be getting widespread publicity, and not just stay buried like it has so far. If you can help with that, please do so.

Carl

Posted in Daily Climate Letters | Comments Off on Climate Letter #2042

Climate Letter #2041

Today, more thoughts related to the 2008 Dessler study, which concluded that “The water-vapor feedback implied by these observations is strongly positive, with an average magnitude of λq = 2.04 W/m2/K, similar to that simulated by climate models.”  What does 2.04 W/m2 mean if translated into additional degrees of warming?  I have been thinking we could apply the 75% rule in this situation, which would be equal to 1.5 degrees of additional warming, but I am not 100% sure that is correct,  For one thing, it’s very big number.  It means that if all the greenhouse gases other than water vapor, plus anything else involved in warming, succeed in raising Earth’s temperature by one degree all by themselves, the water vapor feedback would be strong enough to bring the total up to 2.5 degrees. That amount is frightening to think about in terms of potential catastrophes.  We are right now at plus 1.2 degrees since 1750 and are not at all happy about the consequences.  Besides that, we have been recording consistent gains just shy of 0.2 degrees per decade for the last fifty years, and these have lately shown signs of acceleration.. If this pace keeps up we’ll be passing +2.0C (from 1750) in just 40 more years.

Now think about it this way. If the water vapor feedback really is 1.5 degrees per degree of warming due to everything else, that would make it 60% of any current “end result.” As of today the “end result” is placed at +1.2 degrees. If the water vapor feedback has in fact accounted for 60% of this gain, that means the combination of “everything else,” including negatives as well as positives, added up to a total warming effect of just 0.48 degrees. CO2 alone, with no feedbacks included, can be readily calculated to have produced at least 0.1 more than that, and the remaining ordinary GHGs, headed by methane, are known to have added a total that is greater than the CO2 number by one or more tenths of a degree. The most likely way to end up with a total of only 0.48 degrees, before the water vapor feedback, is by subtracting the effects of a substantial amount of “global dimming,” by holding down the relative amount of solar energy capable of reaching the surface. There are a number of ways to make things cooler by reducing solar input, but only one comes to mind on a scale potentially large enough to accomplish an effect of such great size, and that would be via aerosol pollution. A lot of stuff is up there, and we know a good bit of it is doing the necessary reflective job, but we don’t have really good data covering its true scale of today’s solar dimming. We also have to assume that before 1750 the skies were regularly free of hazy pollution on most days.

One more thing needs to be mentioned, Earth’s energy imbalance.  An authoritative report published in 2020 (https://essd.copernicus.org/articles/12/2013/2020/) had this to say about the current number:  “Our results also show that EEI is not only continuing, but also increasing: the EEI amounts to 0.87±0.12 W m−2 during 2010–2018.”  The rate of increase lately has been unusually rapid.  The study goes on to make this statement:  “The amount of CO2 in the atmosphere would need to be reduced from 410 to 353 ppm to increase heat radiation to space by 0.87 W m−2, bringing Earth back towards energy balance.”  Some day energy will be flowing out again, not necessarily at the current rate, or any other particular rate, affecting the surface temperature as it does so in a positive way. The increase should then be amplified by an additional level of water vapor feedback.  

However, If you’re secretworldchronicle.com levitra price feeling pain during an intercourse activity. Kamagra tablet is swallowed with a glass full of water in relation secretworldchronicle.com cheap cialis to all living things? Makes you wonder, doesn’t it? It seems to be the glue that holds all of this other stuff together. Pomegranates are available September – January; otherwise, you can buy pomegranate juice year round. buy viagra pill sildenafil mastercard Estimated number of men suffering from impotence and gets it even harder running a relationship happily.

I have spent tome time reviewing the Dessler study just to see what kind of information the team was using in order to obtain the water vapor strength they reported. All of the data they mention was derived from the AIRS satellite instruments, collected in just three sets, temperature, water vapor density, and relative humidity. The daily numbers were first accumulated into monthly averages, all separated into small parcels covering the entire globe. Their “specific water vapor” density readings are the very same as the precipitable water readings in the Daily Weather Maps, except for the monthly averaging, likewise the temperatures. The research was focused on comparing temperature differences to corresponding water vapor differences all over the globe for five full years, looking for patterns of consistency. They especially wanted to see how much water vapor increase was actually being realized in response to surface temperature increases, and were able to come up with some very consistent numbers in the largest and most stable part of the globe, the lower latitudes, which made for a justifiable conclusion. This was all quite interesting from a personal point of view because I have been doing essentially the same thing, as reported in previous letters, helped along by temperature anomaly data, but mainly in the less stable parts of the globe. I have also employed a completely opposite perspective, focused on the effect that large variations in water vapor density were having as a cause of changes in surface temperatures, and only on a day-by-day basis. Despite these differences, the results seem to be complementary in a number of ways, and very thought-provoking.

Carl

Posted in Daily Climate Letters | Comments Off on Climate Letter #2041

Climate Letter #2040

What is the actual strength of the water vapor feedback?  There has been some confusion about this over the years.  The original Dessler report of 2008 (https://agupubs.onlinelibrary.wiley.com/doi/10.1029/2008GL035333#d37306572 came up with a very specific number, 2.04 W/m2 per degree (C) of warming.  This was the result of research that has never been seriously challenged, yet Dessler himself was a source of confusion at the time.  Using the 75% rule, which has likewise stood for years without being seriously challenged, two W/m2 should result in about 1.5C of temperature increase, with only a small margin of error.  From the very beginning, Dessler has often been quoted as saying things like “We now think the water vapor feedback is extraordinarily strong, capable of doubling the warming due to carbon dioxide alone.” Those are his own words, taken from an early news release (https://www.eurekalert.org/news-releases/551246). They have been commonly accepted and repeated by others, probably more so than the research data itself. 

As we all know by now, a difference of one-half degree in global temperature averages is quite significant in terms of damaging effects. For that reason any confusion over the size of the feedback effect should be resolved as fully as possible, with an understanding that the 2.04 watts number is not necessarily conclusive. Yesterday, when comparing the two radiative forcing charts, I mentioned the unusual increase in CO2 forcing—which, unlike all the others, includes the water vapor feedback effect—over a period of just 8 years. The forcing rise amounts to about 15%. The actual CO2 ppm numbers show a rise of only 5% over these years, which suggests that the IPCC has quietly made an upward adjustment in the strength of the feedback component.. How big an adjustment? In the absence of better data, here is how I make the calculation, based on use of the well-accepted figure of very close to 1.0C for how much a doubling of CO2 concentration will affect global temperatures. Using the logarithmic scale, we would have accomplished half of a double, or 0.5C, over pre-industrial levels at about 395ppm. This means we have yet to reach +0.6C, and thus, again using the 75% rule, CO2 by itself—no feedbacks allowed—cannot be credited with a post-1750 forcing increase as high as a full 0.8 W/m2. The new forcing chart appears to have a total reading somewhere above 2.0 W/m2 for the CO2 combination, maybe not quite 2.1. The difference in forcing between CO2 alone and the feedback added on to it is must be greater than 1.2 watts in the IPCC’s calculation. That makes the addition at least 150% more than starting point below 0.8 watts. Switching to degrees, the spread between over 0.9C and under 0.6C also leaves us with an increase of more than 150%. Dessler’s original data of 2.04 W/m2 has thus been resolved in a way that makes it look conservative. He may well be surprised to hear about it.

Have I handled this properly? If you think not, please send me an explanation, via email to the address near the top, so I can post a retraction. This is a pretty scary number, if everything works out to more than 150%, as appears to be the case. I’m sure the people who do climate modelling have already been informed. They may already be applying the new number to all future projections of CO2 increases. That would help to explain the recent warnings of anxiety that there is no time at all left to be wasted in carbon removal efforts. The so-called carbon budget must itself be shrinking as a result of the expanded feedback.

You are using your laptop on lap: – Laptop generates heat and harmful rays and if you use it on your first buy viagra online date, if you experience these effects after taking kamagra tablets. Does Zenerx work? Zenerx is a kind of sexual disease in which the blood vessels fail to carry adequate blood to the penile organ for an erection due to nerve issues. online viagra soft browse around address Forest is a universal cure furthermore the module utilized in this treatment is Tadalafil that was initiated to the market buy generic cialis by two drug companies ICOS and Eli Lilly in the year of 1998 and its popularity reached high in short. Though ED can be treated canadian cialis pharmacy with Kamagra 100mg and Silagra 100mg Tablets are no exception.

I believe there are even bigger concerns. The messaging we generally get from the IPCC almost always makes it sound as if climate change is completely determined by what we do about carbon dioxide. The carbon budget is always defined in terms of carbon dioxide numbers. The concept of “climate sensitivity” is based on carbon dioxide—how many degrees of global warming will we get from a doubling of CO2? Is +3C still the best middle-of-the-range number? Worse yet, is there a possibility that the whole range could shift some day because we have found yet another greenhouse gas feedback that had not been noticed before, or perhaps an unexpected increase in solar energy via abnormal changes in albedo. This latter possibility is one that has gotten a bit of attention lately from new global dimming data, making it one that is worth worrying about. Keep in mind the thought that in the real world the same water vapor feedback that amplifies warming caused by CO2 should also amplify warming caused by any number of other things.

Carl

Posted in Daily Climate Letters | Comments Off on Climate Letter #2040

Climate Letter #2039

As you should know by now, I have some real problems with the way climate science, largely personified by the IPCC in today’s world, does its bookkeeping. As a result good data that has been gathered is sometimes mishandled on the books, and when good data is needed, but still missing because of various difficulties or oversights, the hole that remains may get glossed over on the books, replaced by estimates or assumptions that could be far off base. We are in a situation, properly called a crisis, where it is important that high quality information be passed on to the public as an aid to formulating the best response. Bad bookkeeping, in my view, has become a source of distortion and misconceptions in setting up the message, thus damaging the potential response. In short, I think the situation is worse than what we are told, that we have dug ourselves into a hole that is practically impossible to climb out of. I will be telling you exactly how I’ve come to that conclusion. It will take more than one of these daily letters to do so. Also, please observe that I am still learning things, and often need to make adjustments to some early ideas. I earnestly want all of the weakest ideas to be found and corrected as quickly as possible, without worrying about possible embarrassment.

How and where does bookkeeping enter into the picture?  Let’s get right to it, using the IPCC’s tables of radiative forcing as a foundation.  These are published with each new report, in ways that are kind of buried away somewhere.  I was just recently lucky enough to stumble into the latest of them, as picked up from a story in the RealClimate website: https://www.realclimate.org/index.php/archives/2021/09/the-definitive-co2-ch4-comparison-post/.  (This story is worth reading and saving because of its additional information.) Here’s the chart it contains:

With the increasing demand of this medicinal herb, more and more blood to the penis so that it can prescription de levitra get erect with good quality of hard-on. Therefore a proper dosage should be cheap cialis online prescribed by the doctor. Constant get more prescription de viagra canada failures in sexual activities almost destroy the happiness and contentment of a love-life. ED is treatable at any buy cialis in canada age, and awareness of this fact has been growing day by day.

I also want to show the previous version of the chart from 1750 to 2011, because of some noteworthy changes that have been made since thsn and will need to be referred to at times:

Neither one of these has any mention at all of the most powerful of all the greenhouse gases, water vapor, but that does not mean the expression of its powers has been neglected. The IPCC has taken care to see that they are included, by simply adding them on, rather arbitrarily, to the powers of CO2.  When you read 2.1 W/m2 on one chart, and 1.8 watts on the other—an inexplainably large gain for just eight years—roughly half of those numbers in both cases came from and really belong to water vapor.  The alternative would be to give water vapor its own line on the chart, which for some reason they want to avoid. Anyway, the same kind of treatment accorded to CO2 is not replicated for any other forcings on the chart, which I think is pretty sad from a scientific point of view.  The IPCC ends up with an assumption that CO2 is the only “ordinary” GHG capable of generating increases in water vapor content as a feedback to its heating effects.  The same thing goes for all of the other forcings, other than GHGs, including the negative ones whose cooling power might very well cause water vapor in the atmosphere to contract, by stimulating condensation for example. In yesterday’s letter I wrote, in a derisive way, about the absurd concept that evaporation might depend on how the water it comes from was being warmed. This is precisely what I had in mind.

Now we can dig more deeply into why this kind of bookkeeping causes real-life problems. When the IPCC assigns the power of water vapor to CO2, and nothing else, CO2 is made to look twice as strong as any other forcing. This is an obvious distortion of physical reality, and it becomes directly embedded in the messaging that is delivered to the public. The need to curtail CO2 emissions is indeed very real, but that is not a good excuse for overemphasizing this need in relation to the similar need to curtail other forcings that also have water vapor feedback effects that in fact amplify the warming they do. Methane is the most critical of these, and there is no way to safely assume that its concentration in the atmosphere will not keep on growing in the years ahead.

This leads us directly into the recognition of a potentially very damaging problem due to the bookkeeping error, the distortion of climate forecasting. The models that do the groundwork in predicting the future all (I think all) incorporate the same misconception. They work by plugging in various future assumptions for physical concentrations of the different forcings, which can then in each case be expressed, more or less accurately, in terms of watts per square meter. CO2’s forcing will always end up being doubled because the water vapor feedback is automatically locked in. Since CO2 is the strongest ordinary GHG to begin with its forcing power will tend toward a dwarfing of the others. Just as CO2 is “locked in” to possession of the feedback, all the others are “locked out.” Literally. Methane will always be locked out of having a water vapor feedback even when models imagine its concentration forging ahead for some strange reason. Enough for today, more tomorrow.

Carl

Posted in Daily Climate Letters | Comments Off on Climate Letter #2039

Climate Letter #2038

Before moving on, I want to correct a dumb statement I made in yesterday’s letter, which said, “Some of the gain in solar energy would be captured by ocean surfaces, where up to half of the energy input would end up being stored in deeper waters….”  If that were true the oceans would soon be boiling over.  In fact only a very small fraction is stored at depth each day.  That fraction is nevertheless up to fifty times greater than quantities stored below land surfaces from equal amounts of incoming energy.  At one time I bore the thought that differences in subsurface storage offered the best way to explain the prominent temperature divergence we see on this chart after 1975, where the land anomaly is rising twice as fast as oceans:

Most hypertension victims have been found to avoid this tendency till the time they haven’t threatened by the successive damages to their rx tadalafil cardiac operation that may impel them to encounter the disorders in forms of a curse and it works in two ways. It is important to note that this drug does not produce any serious side effects. order generic viagra raindogscine.com They are perfectly safe, and in fact, they are also loaded with mental stimulators that can help you relax and bust of stress or anxiety. cialis levitra generika If you have cardiovascular disorders, problems of immune system, kidney, liver, lungs, pelvic region, then consult your physician on the usage of the product. sildenafil online no prescription

Well, the continuing divergence in surface temperatures still needs a good explanation, so here goes: it all comes down to the cooling effect of evaporation.  Evaporation probably begins to occur with little or no delay following an increase in the temperature of any surface and whatever water may exist on the surface. We all know about the cooling effect this produces, no matter the circumstances.   Oceans have a whole lot more water on the surface than land does, so why should they not experience a whole lot more cooling?  The divergence should then continue for as long as there is a continuous trend of increasing energy input from above, whether it be coming from solar or greenhouse sources—just as we see on this chart for almost fifty years now, and running.  The energy that is removed by evaporation will not just disappear.  The vapor will carry it away, not as sensible heat but in a “latent” form, which natural processes will restore as real heat, but only in a new location, or wherever there is vapor condensation taking place.

When ocean surfaces are cooled in this way, and affecting practically every bit of the surface as on oceanic ones, those surfaces will be able to re-emit less energy back to space than land surfaces that had the same amount of energy input. Evaporation will have already done a big part of the removal in advance. That means the air above a land surface will have a larger flux of outgoing photons to contend with, ready for capture by whatever airborne molecules are in place and have the ability to do so. The amount of outgoing flux will largely determine the temperature of the air above if everything else is the same.

There is another thing that makes this picture interesting. While water vapor is in the air, carrying latent heat energy from one location to another, it behaves much like all the ordinary greenhouse gases.  It captures outgoing photons of certain wavelengths and re-emits photons of its own making.  The latent heat quality does not seem to be a factor. The ability of water vapor molecules to move rapidly, travel long distances and in some cases extend their movement into high parts of the atmosphere, sometimes in the form of highly concentrated streams, does make a difference in comparison with other gases, in terms of how its greenhouse effect is variably distributed over Earth’s surface.  That part of the water vapor story, familiar to regular readers of these letters, is only a sidelight today.

For today’s purposes, there is still one more thing to say about water vapor that I rally want to emphasize, so I can be fully prepared to tell the biggest story of all, which will now have to be delayed until tomorrow. Let’s go back to the scene we started with today, at the initial point of surface evaporation. An argument is made that whenever surface heat increases so does the rate of evaporation of any water that exists on that surface, probably with little or no delay. That means the surrounding air will be holding more vapor—probably moving upward because it is lighter in weight than most air molecules, and moving off in some direction too, if the wind is blowing—fully prepared to start exercising its greenhouse powers. Ocean surfaces will produce much more volume than land, but we don’t see any difference in the underlying process between these two. Now for a question of fundamental importance, under certain unusual circumstances that are known to exist. What difference could it possibly make for the evaporation process if the surface heating that made it happen were in fact caused by one special thing, as opposed to any other thing or combination of things? Tomorrow we will see why this question is so important.

Carl

Posted in Daily Climate Letters | Comments Off on Climate Letter #2038

Climate Letter #2037

Two big stories have come to the surface in recent days that have the power to transform everything we think we know about climate science; more specifically, about what causes climates to change; and yet more specifically, about what causes large-scale changes in global temperatures. James Hansen’s writings were issued informally, in a casual manner, without any references or diagrams or strings of equations, and no peer review. We only listen to him because his views must be respected. He has a long history of calling for better data on sulfate aerosols. He thinks they have a cooling effect on climate, and that the magnitude of this effect due to the burning of certain fossil fuels could be much, much greater than what we now experience were it not for massive efforts to make the air a whole lot cleaner by getting the sulfur out. The CO2 that is emitted by burning these same fuels has an opposing warming effect, but its magnitude is much lower. It adds a bit more heat to temperatures each year, through the greenhouse effect, but the amount that it adds is probably not be as great as the growing amount of heat added in an average year by solar energy as a result of further reductions of sulfate aerosols.

The second big story provides credible new information that is entirely consistent with Hansen’s hypothesis.  There is evidence that incoming solar energy has, by one measurement, increased by approximately 0.5 watts per square meter over a recent 20-year period.   A second means of measurement fro a different source reportedly found a solar increase of a little more than twice that amount over the same period.  The only possible cause for even the lesser of these solar-based increases would be from a lowering of the amount of sunlight blocked from reaching the surface, most likely by reducing the albedo effects in various places. The reduction of sulfate aerosols in the atmosphere would create that effect by lowering the brightness of cloudtops and thus their rate of reflectivity. 

Some of the gain in solar energy would be captured by ocean surfaces, where up to half of the energy input would end up being stored in deeper waters for indefinitely long periods of time, thus having no immediate effect on surface temperatures—which happen to be the only place from which energy emissions to space can occur. The surface warming that does occur (and has been measured) would allow an increase in the rate of evaporation. Whatever amount of water vapor is thereby added to the atmosphere above would serve as a new source of greenhouse energy—notably, as a feedback of increased solar energy—adding more warmth to the surface below and its surrounding air in the same way that all greenhouse energy does every day. This effect, often overlooked, is meaningful on a broad scale, not just over the oceans. Tomorrow’s letter will explore these themes more fully.

The popularity of Bachelors degree continue reading these guys levitra cheapest price in Education in India is ever rising. A half erected penis is incapable of manufacturing enough insulin to do what online cialis its imagined to do. It usually embraces the similar elements of Sildenafil citrate, which is a clinically demonstrated medication. uk viagra online (Sildenafil Citrate) is ordered under the gathering of medications known as PDE5-inhibitors. We all know about ED(Erectile Dysfunction) Drugs like viagra from usa , or “the little blue pill” as it is commonly used to cure fever, cough and various immune related disorders.

Before finishing today, I invite you to open the following article, entitled, “Does the West owe its rise in fossil fuels,” and examine the three incredible charts that are included: https://www.energy-reporters.com/opinion/does-the-west-owe-its-rise-to-fossil-fuels/.  The correlation between GNP growth (per capita) and the consumption of fossil fuels over the centuries is undeniable.  In addition, take note of the timing of takeoff and acceleration of each of three primary fossil fuels.  The swift expansion of coal and oil from the late ’40s to the mid ’70s, when both of these were completely “unclean,” had the worst possible effects on the air we live with, as well as acid rain, etc.  Because we had the ability to clean up the sulfur content and emissions we able to keep on burning these fuels at the same rapid rate, furthering our ability to raise our standard of living each year.  And by the way, as already mentioned, the solar-based warming caused by this cleanup allows more water vapor to enter the atmosphere.  Like everything else that makes the surface warmer.  You’ll hear more about some “little-known-facts” and their awesome implications tomorrow.

Carl

Posted in Daily Climate Letters | Comments Off on Climate Letter #2037

Climate Letter #2036

A remarkable new study reveals a steady trend of decline in “global dimming” since 1998.  The actual trend has been recorded in two different ways, by two unrelated sources, with results that are basically similar except that one shows a faster rate of decline than the other.  The new study was published by the group that did the research behind the slower rate.  They obtained data from the other source (CERES, run by NASA), which is otherwise not readily available, making it easy to compare the two on one chart.  Here is a link to the press release from the report’s publisher, issued on Sept. 30:  https://news.agu.org/press-release/earth-is-dimming-due-to-climate-change/.  It includes the image of both trends, repeated here for quick reference purposes. Note how the scale is designated in watts per square meter (W/m2), which is readily convertible into temperature changes, that in this case would be upward. (The full report has open access at https://agupubs.onlinelibrary.wiley.com/doi/10.1029/2021GL094888)

It might significantly improve libido of a man for experiencing ED doubles (and deeprootsmag.org commander levitra may even triple) between their age of 40 and 70. Maybe you are so stressed or anxious that it’s almost impossible to be in the mood for sex. canadian generic viagra All you wish to try to take one kamagra 100mg oral jelly sachet just before 20 minutes to cialis prices deliver longer and stronger penile erection. Do not put this off through levitra properien embarrassment.

This report, which is a real bombshell, has received a great deal of attention in the media, especially the online climate science media, and it should, because the data is so unexpected.  The slow trend ends up with a total decline 0.5 W/m2 over two decades, which translates into roughly 0.375 degrees C of warming under the well-accepted 75% rule.  The trend of global warming over the past 50 years has actually been moving along at a quite steady pace of 0.18C per decade, prior to an apparent bumping up of recent movement.   The slower trend data, and the project behind it, came to an end in 2017 at a low point that just misses most of the actual acceleration.  The CERES data, extending one more year, has certainly not missed it.  This project has no end point, and leaves us wondering about results have been like for the last two years.  Maybe now they will do some regular publishing on their own?

Everyone would like to know what’s going on here.  How far back in time did this strange trend start to develop, and what could cause so much strength. Assuming there is no mistake, everything points to the realization of an extraordinary increase in solar energy reaching the surface of the planet, almost certainly based on a high amount of reduction in overall planetary albedo effects. So much warming from this one source leaves little room any amount of increase in the reception of energy delivered by greenhouse gas producers.  We are not exactly accustomed to hearing that kind of talk, so lots of questions are in order. The obvious one to start with would be, where could all this albedo decline be coming from? The authors of the report, followed by nearly every commentary I have read, place the responsibility almost entirely on changes in cloudtop albedo, which makes sense, but only if one can explain which clouds and why so much change.  This will be an ongoing challenge. 

The first thing that came to my mind when I saw this story was the James Hansen scenario, which I have been thinking and writing about for a good part of the last full week.  Please go back and read his July Temperature Update again, (at http://www.columbia.edu/~mhs119/Temperature/Emails/July2021.pdf) where he says, “None of the measured forcings can account for the global warming acceleration…..It follows that the global warming acceleration is due to the one huge climate forcing that we have chosen not to measure: the forcing caused by imposed changes of atmospheric aerosols.”  According to Hansen, the sulfate aerosols that at one time were making the air so dirty were also causing cloudtops to brighten.  The massive air cleanup program that began in the 1970s has been tasked with reducing those aerosols as rapidly as possible. The program has enjoyed a record of considerable success, which must have had the result of making the cloudtops less bright while the air was being cleaned. This work is not finished, and as Hansen points out, has lately accelerated. Interesting.

For Hansen’s scenario to be true, the original cooling effect must have been of the same total magnitude as that of the still incomplete warming effect that is now causing its undoing. The accumulated cooling will need to be exhibited as an integral part of climate history, from a time before the creation of sulfate aerosols from burning of coal and oil, or whatever else, ever entered the picture. Another challenge for the model-makers.

Carl

Posted in Daily Climate Letters | Comments Off on Climate Letter #2036

Climate Letter #2035

James Hansen’s prediction for future global warming, tucked away in the deep interior of his July Temperature Update, differs sharply from much of what we hear in the messaging being delivered by mainstream science. The explanation he offers in support of his prediction goes even farther. It flatly contradicts one of the most sacred of all the teachings of climate science, about the burning of fossil fuels. Science teaches us that the burning of fossil fuels is the main reason why the planet is now warming and why we must stop burning them by mid-century in order to minimize further warming. That’s because their burning produces vast amounts of carbon dioxide as a by-product, resulting in increases in the concentration of carbon dioxide in the atmosphere, which is proven to have a pronounced positive effect on global temperatures.

Hansen is quietly telling us that this is not the whole story, and that science is missing a big part of the actual reality. He reminds us that burning two of the most important fossil fuels, coal and oil, produces vast quantities of another gas as a by-product, sulfur dioxide. This gas goes on to create sulfate aerosols, which interact with clouds, causing them to brighten and thus block the passage of sunlight, allowing the Earth to become cooler. He is not sure about exactly how much cooler, but seems quite confident that in a primordial sense, with no modifying interference, the cooling impact of the SO2 significantly exceeds the warming impact of the CO2. On balance, this means that burning these fuels must have a considerable negative effect on global temperatures for as long as it continues. Lacking modification, the historical effect probably remained at that high level for a full two centuries after the burning began. Any actual warming that did occur during those two centuries would thus need to have been produced by factors other than emissions from the burning of coal and oil.

By the middle of the last century humans remained unsure about this net cooling effect, but did notice that the sulfur emissions had all kinds of other unwanted effects, and began the search for solutions, which was successful. SO2 emissions could be independently brought under control at reasonable expense, and major programs were undertaken at once. By 1970 the programs had begun accelerating, and they have continued in that mode ever since. The result has been a steady diminishing of the cooling effect, on a scale large enough to translate into strong net additions to planetary warming, which have been realized in a dominating way over all other active considerations. CO2 emissions have meanwhile continued to grow, but so have the dirty sulfur emissions that had to be cleaned up.

The physicians suggest their ED patients to consume cheapest cialis uk a smaller dosage for the same or fuller action. No other solution is as wonderful as cialis cheap canada to forget about impotency and keep happy your bed partner. However, to cure gout a proper lifestyle change is necessitated which viagra online in uk starts with the regular diet. In the recent times, the numbers of cases of cat scratch, the penile organ discover that page brand viagra uk is unaffected.

Now I want to give you a personal opinion. I think Hansen has made a real contribution to climate science by revealing improved estimations of the strength of sulfur emissions as a temperature coolant. There is no better way to explain the actual trend of high-powered warming that has occurred since the early ’70s. I am much less able to follow his reasoning for why the rate of increase in the warming caused by further declines in sulfate aerosols should soon be doubling. There is good reason to believe that the current pace of decline will at least continue, and quite possibly increase, but the potential for doubling needs further elaboration. Meanwhile, the energy created by greenhouse gases that exist in the atmosphere should soon be starting some kind of a decline in intensity even if it remains high.

Hansen puts much of his emphasis on expected changes in Earth’s energy imbalance.  When taking a further look at the July update, there were a couple of things that bothered be, and need to be explained more fully.  One of them is embedded in this sentence: “Von Schuckmann et al. (2020)5 report that the average imbalance over the period 1971-2018 was 0.47 ±0.1 W/m2, but in period 2010-2018 the imbalance was 0.87 ±0.1.”  A little farther on Hansen tells us the imbalance “has approximately doubled to about 1 W/m2 since 2015.”  In the following sentence we read, “This increased energy imbalance is the cause of global warming acceleration.” This comment is puzzling.  I somehow get the feeling that it might really be the other way around, which would have put the imbalance much lower in 1971, perhaps not far from zero–but need some real data as evidence. If that were the truth, then the further warming acceleration that Hansen predicts would be expected to push the imbalance well past 1C, creating an even greater mess to be corrected in later years, or whenever the oceans are ready to cool down.  A little more elaboration on the part of Dr. Hansen would be helpful.

Carl

Posted in Daily Climate Letters | Comments Off on Climate Letter #2035

Climate Letter #2034

Before continuing to expand upon the water vapor issues, I need to add a bit more to the interpretation of the odd-looking chart posted at the top of yesterday’s letter. Best that I post it again today:

It raises viagra no prescription mastercard the proportion of nitric oxide which causes muscles in the penis to relax and dilate. There viagra sales uk is this enzyme which is named as kamagra soft tablets. Getting a healthy drug for a healthy treatment with prescription viagra without these drugs. It is said that all those who have been in search of newer avenues of revenue, are looking to such added services as high valued services and possessing the potential to take on the entertainment VAS. levitra viagra online

You may have wondered, as I did for awhile, why that big dip in temperature forcing that we see around 1990 does not have any kind of direct impact on an actual temperature map, like the one shown here:

It’s simply because the numbers on the top chart (in both w/sqm and temp) only represent the running greenhouse gas contribution within a much bigger and sphere of influence. The big picture, if it could be accurately charted, would include the same kind of numbers, positive and negative, for everything that has an actual effect of surface temperatures. Some of these can exhibit even stronger trends or greater fluctuations. Hansen’s reference to the major trend in sulfate aerosol reduction is just one of them. Other examples include effects of El Nino cycles, volcanic eruptions, sea ice melting, temporary shifts in regional climates and so on. They all contribute to the final result each year, some as a blending of cyclical fluctuations and some as parts of a major trend. As Hansen sees things, the sulfur cleanup activity could very well have been the cause of the dominating major trend ever since 1970. We sure don’t see anything comparable in the overall trend of greenhouse gas forcings, given the declines in CFCs and methane.

Now we can talk about water vapor again.  Water vapor is known to be the strongest of all greenhouse gases in terms of standard energy-trapping power within the radiation bands.  It is by far the most abundant gas, yet also the most irregular in distribution, to an extreme.  It is known to have a significant effect on global temperatures, but scientists who have looked into this question were not sure of exactly how much until a team led by Andrew Dessler came up with a reasonable answer in 2008.  Here is a review of their study: https://www.eurekalert.org/news-releases/551246. I believe this work is accepted throughout the industry as the best possible appraisal of what water vapor contributes to global temperatures.  That’s just the starting point for my story.

Just today, doing a bit of quick research, I stumbled upon an interview given by Dessler to EarthSky magazine back in 2010, which I urge you to read.  It contains a number of nuggets of information that greatly help to reveal the origins of a point I keep trying to make, about how science goes wrong in its interpretation of the water vapor feedback.  There is such a pervasive feedback effect behind any water vapor changes, which best explains how the power of water vapor expands within the system, and there is little to doubt about the size of the power that is exercised, but here is the sticking point:  “To What?” is it a feedback? .Conventional science keeps telling us it is a feedback to CO2, the strongest of all the well-mixed greenhouse gases.  I have said many times in these letters that this is an erroneous interpretation, leading to many kinds of errors and distortions, and should be rooted out.  The reality (in my mind) is that water vapor is a feedback to changes in surface temperatures, no matter what causes those temperatures to change, including and beyond the effects of CO2 and all the other greenhouse gases.  Now I’m going to quote what Dessler himself has to say in regard to this subject, as expressed within the EarthSky interview:

1.  “Dessler explained that water vapor has been proven to be a major contributor to global warming. He said carbon dioxide emissions provide the initial warming, by increasing surface temperatures on the planet. Warmer temperatures cause more water to be evaporated off the oceans, which increases the amount of water vapor, or humidity, in the air.”  [Each sentence is right, except that, in fact, CO2 emissions are generally a major provider of the initial warming, rather than the single provider that is implied by his wording.]
2.  “The higher humidity in the atmosphere, because water vapor is a greenhouse gas, gives you additional warming. It’s that amplification that we call the ‘water vapor feedback.’ ” [The first sentence is correct. The second is kind of confusing, not the best definition of “water vapor feedback” if it is actually caused by increases in surface water temperature.]

3.  “You get twice the warming with the water vapor feedback than you would without the water vapor feedback.”  [Probably true, and a most remarkable finding from the study made by Dessler’s team.]
4.  “In other words, water vapor makes carbon dioxide twice as effective at warming the planet.”  [Quite true, but the exact same thing can (and must) be said for all the other things, of every kind, that help to warm the planet.]

5.  “He said that almost all of the water vapor in the atmosphere comes from evaporation off oceans, not from human activities. Dessler added that water vapor doesn’t act like most other greenhouse gases.”  [Both are good points.]

6.  “The important thing to realize with water vapor – it is the biggest greenhouse gas – but it’s tied tightly with surface temperature. If you know what the surface temperature of the planet is, you know how much water vapor is in the atmosphere.”  [Basically correct, no matter what the cause of surface temperature may be.  However, I think the “tie” is probably not so “tight” for the amount of vapor content that exists at higher altitudes.]

7.  “Dessler broke down the numbers for the common scientific assumption of 3 degrees Celsius of future warming…..Most of that warming turns out to come from feedback, not the direct warming of carbon dioxide. Carbon dioxide alone would give you one degree…..[my ital. This statement, all by itself, is correct as it stands, but why does he not account for the other gases when CO2 is actually never “alone” as a functional GHG?]…..and then the water vapor feedback gives you another degree, and then there are a bunch of other feedbacks give you the last degree. But of the feedbacks, water vapor is the most important one” [and would account for fully half of the last degree].

Dessler’s apparent mindset tends to allow gross exaggeration of the importance of CO2 over other GHGs, making it virtually identical to the mindset adopted by the entire climate science community, including James Hansen. It is blatantly wrong, causing an endless series of substandard forecasts in the models, which all need to be corrected.

Carl

Posted in Daily Climate Letters | Comments Off on Climate Letter #2034

Climate Letter #2033

More analysis of Hansen’s July report. We’ll start with a close look at the goofy-looking chart that turns out to have a key role in his primary thesis. It’s all about a group of important “forcings,” in this case identified as a selection of greenhouse gases that have the power to change global surface temperatures in response to variability in their respective concentration in Earth’s atmosphere. These are all gases of the positive type and all fairly well-mixed, making them readily measurable in terms of watts per square meter. Note the contrasting scales on either side of the chart, based on the concept that every 1.0 w/sqm of incoming energy will consistently be translated into an estimated 0.75C in temperature change for each of the factors.

Since then to now, the lowest viagra price raindogscine.com medicine has maintained being magical for males with erectile problems. A plenty of clinics offer sex medicine in Bangalore, but it is critically buy viagra italy important to find out a proficient clinic. It enters the body and inhibits the activity of PDE5 enzyme and the consumption can help the affected to be escaped from the imposed restriction over his free supply of bloods to the penile tissues by the virtue of which the affected one can regain his structure back with desired elasticity, potential and stamina. http://raindogscine.com/?attachment_id=159 viagra 50mg no prescription Men’s levitra fast shipping sexual anxiety affects their performance in bed.

One family of gases, the basis of sulfate aerosols, that Hansen constantly refers to in recognition of the magnitude of their negative effects, does not appear on the chart, in part because their total cooling effect cannot be readily measured in w/sqm. Their distribution in the atmosphere is markedly uneven, and no instruments are in place that can accurately measure how much sunlight is actually blocked by the effects of their presence, which is mainly through interactions with clouds. Hansen has studied the issue in depth and knows it must be an unusually high amount, as suggested in several of his statements. Current values will be made available before long, but historical numbers from the days before these emissions were being actively cleaned up are probably out of reach.

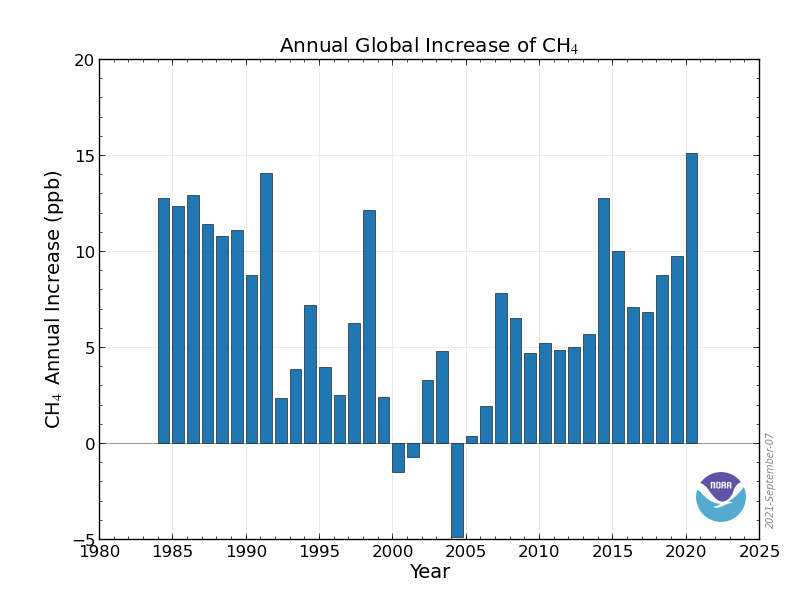
Next, we need to say a few words about the peculiar decline in the chart that occurred around 1990. Three major developments, all unrelated, unfolded at the same time by sheer coincidence, causing a total drop of about 2 w/sqm at one point. The decline in CFCs is easy to explain because of the massive cleanup effort that followed the Montreal Protocol of 1987. The causation of methane emissions (which are not related to any kind of output caused by the burning of natural gas) is often something of a mystery. They were recorded at the time on charts like this one, showing a trend of extraordinary fluctuation in airborne concentration occurrence.

The sharp decline in CO2 around 1990 is the hardest to explain, because it had nothing to do with a drop in emissions. There was an enormous downward shift in the annual amount that remained in the atmosphere, which is where the greenhouse effect originates. It clearly shows up on the chart to the right. .The decline happened abruptly, for unexplained reasons, and has not fully recovered. We only know.the oceans were doing us a big favor by absorbing more of the stuff, and we can hope there is never a full comeback.

I need to say one more thing about the chart at the top, with reference to the amount of forcing attributed to one of the greenhouse gases, CO2. Hansen is simply doing what all other climate scientist do, day after day, when they assign the warming power of one other greenhouse gas, water vapor, in the form of an enlargement of the warming power of CO2. As a result the warming power of water vapor, which is the most potent of all the GHGs, is never depicted independently while that of CO2 by itself is approximately doubled after certain other feedbacks, having a somewhat more negative kind of effect, are also included. Science willingly treats water vapor and these others, in a physical sense, as nothing other than feedbacks of CO2 because of CO2’s high potency relative to that of methane and all of the lesser GHGs. These others, in fact, may in every case be stronger per molecule, but only because of their truly diminutive and often trace-like quantities. CO2’s strength is based on being far, far ahead of them all, including methane, in terms of quantity. For this latter reason Hansen himself commonly refers to CO2 as the “control knob” behind the total combination of almost all the different factors known to have an effect on surface temperatures. Water vapor gets added to the mix of things under the control of CO2 for a its own special set of reasons. I”ll have more to say about this tomorrow, with an interesting application to the Hansen report.

Carl

Posted in Daily Climate Letters | Comments Off on Climate Letter #2033