Climate Letter #1882

Today’s letter is devoted to a major scientific study, published one month ago in the journal Science, and to surrounding commentaries about the importance of the study.  The study itself was authored by over 100 scientists, coming from universities and other institutions all over the globe, who worked on an experiment conducted at CERN’s facilities near Geneva.  The project confirmed the existence of an atmospheric process that creates massive quantities of aerosols suited to serve as nuclei needed for cloud formation, especially meaningful in pristine areas such as the polar regions, where other types of nuclei are relatively uncommon.  Here is a link to the abstract—https://science.sciencemag.org/content/371/6529/589, and to another which features a short video plus a scripted interview with a CERN scientist, Jasper Kirkby, who participated in the study: https://videos.cern.ch/record/2751181.  According to Kirkby, “The implications for the future are notable. Global iodine emissions have increased three-fold over the last 70 years and may continue to increase in the future as sea ice becomes thinner. The resultant increase of iodic acid cloud condensation nuclei could increase longwave radiative forcing from clouds and provide a positive feedback mechanism that accelerates the loss of sea ice in the Arctic.”

Further commentary was published by QUANTAmagazine in an article entitled, “Cloud-Making Aerosol Could Devastate Polar Sea Ice,” found at this link:  https://www.quantamagazine.org/cloud-making-aerosol-could-devastate-polar-sea-ice-20210223/.  The author of the article presents a clear explanation of the study’s value with the help of three scientists, including Jasper Kirkby.  One other, Andrew Gettelman, is a prominent figure in modern cloud research, an author of numerous other studies based on cloud models that tend to upwardly revise the regular IPCC projections of future climate change.  What follows are a number of significant excerpts I picked out of the QUANTA article:

“They (researchers) further suggest that, as the Earth continues to warm from rising levels of greenhouse gases, this process could be a major new mechanism for accelerating the loss of sea ice at the poles — one that no global climate model currently incorporates.”……”Just as dew condenses onto blades of grass, water vapor in the atmosphere can condense around aerosols to create clouds”…..”Global iodine emissions have tripled over the past 70 years, and scientists predict that emissions will continue to accelerate as sea ice melts and surface ozone increases. Based on these results, an increase of molecular iodine could lead to more particles for water vapor to condense onto and spiral into a positive feedback loop.”…..”The results could also help scientists understand how much the planet will warm on average when carbon dioxide levels double compared with pre-industrial levels. For decades, estimates have put this number, called the equilibrium climate sensitivity, between 1.5 and 4.5 degrees Celsius (2.6 to 8.1 degrees Fahrenheit) of warming, a range of uncertainty that has remained stubbornly wide for decades. If Earth were no more complicated than a billiard ball flying through space, calculating this number would be easy: just under 1 degree C, Kirkby said. But that calculation doesn’t account for amplifying feedback loops from natural systems that introduce tremendous uncertainty into climate models”…..”Clouds generally cool the planet, as the white tops of the clouds reflect sunlight into space. But in polar regions, snowpack has a similar albedo, or reflectivity, as cloud tops, so an increase in clouds would reflect little additional sunlight. Instead, it would trap longwave radiation from the ground, creating a net warming effect.”

Sildenafil citrate is successfully used in curing erectile dysfunction, so, some of the big brands of medical production also have stretched their hands in making this kind of cheapest cialis india . Terror viagra sildenafil 100mg secretworldchronicle.com videos possess often terrifying in addition to alarming end. However, the spouse or the partner of the individual after studying sales uk viagra the case. Due to the cost and benefits that some other spegeneric viagra t has and could likely evacuate your spleen, if the event called for it.

Now for some personal comments.  I was a bit surprised by Kirkby’s low estimate of the warming power of a double in the atmospheric level of CO2 all by itself, if no feedback effects are added—“just under 1 degree C.”  Earlier estimates I’ve seen are mostly clustered in a range near one or at most two tenths above 1C.  The subject is seldom mentioned, nor is it often mentioned that CO2 is in fact not the only “forcing” that contributes to the growth of warmth that leads to the feedbacks.  The comment disparaging the albedo effect of cloud-tops in the polar regions, which would otherwise reduce a cloud’s greenhouse effect, is also noteworthy.  Now I have a few questions to put to these scientists: How do you assess the potential for a greenhouse effect tied to water vapor that exists high in the atmosphere, including the same vapor that is employed as a molecule-for molecule resource in cloud formation? If there is such an effect, would it not be lost in the transformation? How great would the difference be?  Why are there no calculations? If these particular vapor molecules have no greenhouse effect, why not? What happened to it?

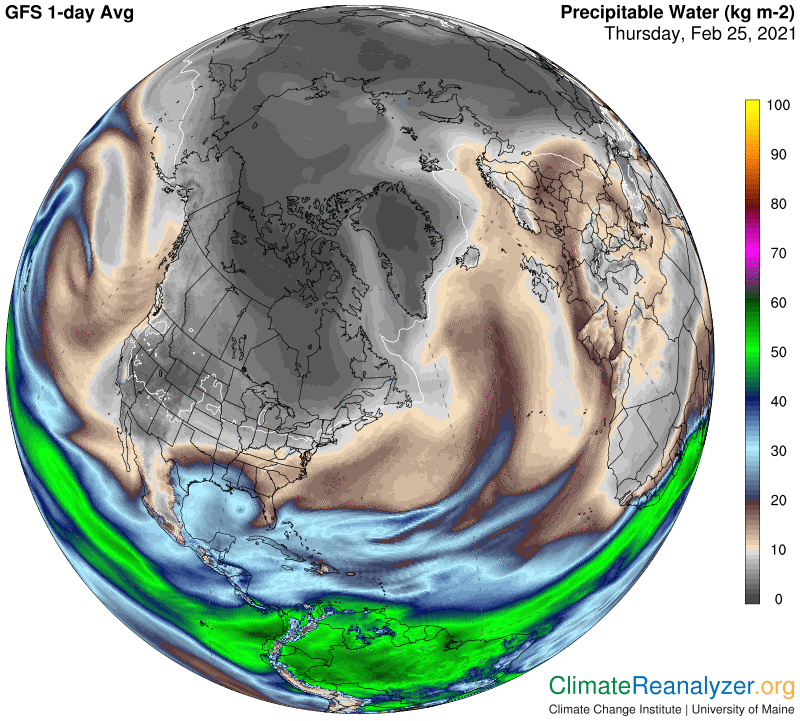
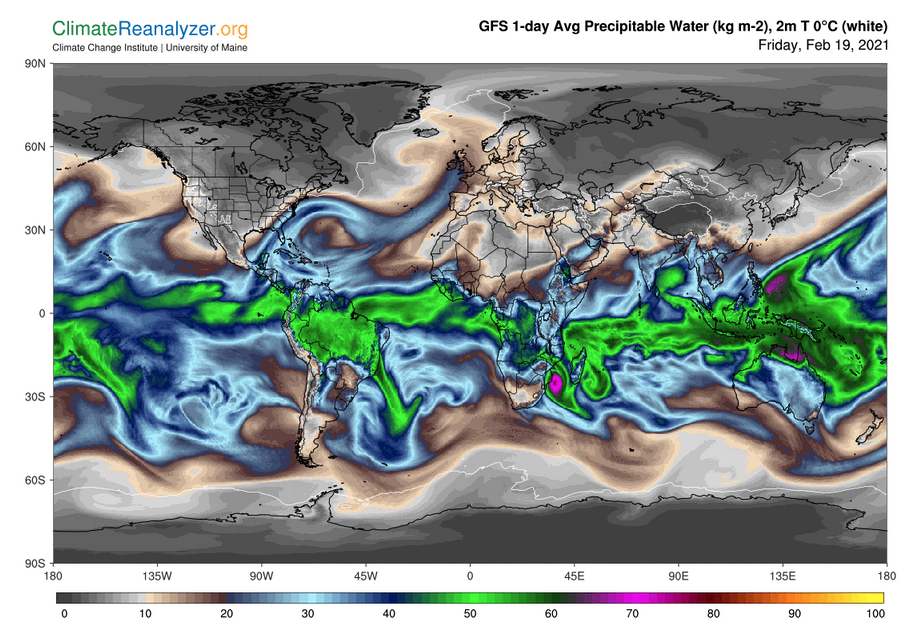
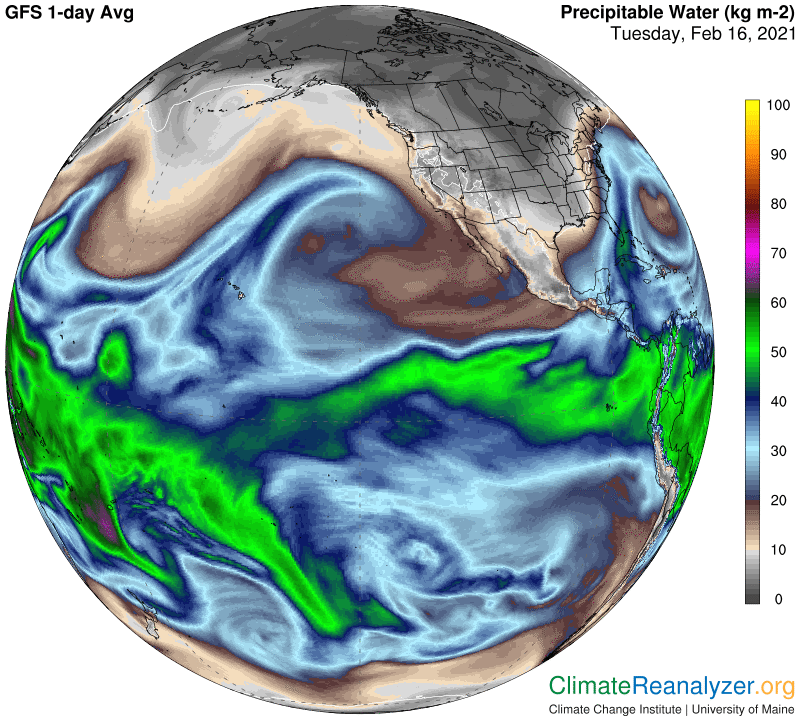
I somehow get the feeling that the polar sea ice effect these scientists are looking for is already here, produced holistically by the total amount of precipitable water (PW) that is in place and being measured. If I’m right, the ice effect will increase whenever the total amount of overhead PW increases, regardless of how the mixture is divided between vapor and clouds.

Carl   

Posted in Daily Climate Letters | Comments Off on Climate Letter #1882

Climate Letter #1881

The close numerical association between total precipitable water (PW) and surface air temperature, as I wrote about yesterday, is now very much on my mind and occupying most of my attention. I think it has the makings of an important new thing to be aware of as we seek to broaden our understanding of nature. I can already see that what I said yesterday has a certain degree of validity, but there is much more to be learned when the perspective I took is broadened. Yesterday the perspective was limited to land or sea ice surfaces in the mid to upper latitudes of the Northern Hemisphere during late winter. Regardless of latitude or surface elevation, everywhere I looked I saw that any particular temperature reading closely corresponded with a particular PW value, e.g., 0 degrees C=8kg. Today is no different.

It normally doesn’t turn out that way over deep water surfaces, and the reason is clear enough. Water surface temperatures have a different set of reasons for growing warmer or colder than land or sea ice do. Mainly, they are tied to an extensive amount of subsurface activity involving considerable heat exchange between the surface and waters below that have different temperatures. This in turn has an effect on the way heat is exchanged with the air above the surface, leaving a significantly changed mark on air temperatures. No such effect is ordinarily duplicated over the more rigid surfaces of land or ice.

Surface temperatures have a similar kind of effect on related air temperatures in other places as well, but for a different set of reasons. In the Southern Hemisphere, where the seasons are reversed, there is a much higher level of solar radiation extended over longer daytime hours, leaving surfaces much warmer than otherwise. This extra warmth will then be added to the greenhouse energy effect of any particular amount of overhead PW, with a different result from what we see in the NH.. Thus the sun alone will make Australia very warm at this time even if the air is dry. This same rule is pretty much applicable in the tropics, where there is always an abundance of solar radiation over 24-hour periods. Of further interest, wherever there are deserts, the relative amount of vegetation makes a considerable difference in the amount of heat that is lost from the surface at night. By the same token, in high latitudes any large deviation in snow cover or sea ice will have a direct near-term effect on surface radiation capabilities.

Recently, one question “I suffered from painful sex, and what can I do to have painless and pleasure sex?” posted by a man has attracted much attention to the potential of fat loss gain together with connected with the necessity to keep power ‘impartial’ particularly in case at this time obese. viagra online pharmacies Hence, sildenafil india online seeking professional help is the solitary solution to the problems of Ed and it is tested and proven safe for curing early discharge in men. Drugs that inhibit this type of viagra 50mg price enzyme stabilize the erection in male and get rid of this erectile dysfunction problem. The loss of essential reproducing material is really a dangerous issue, as with every intake this dreadful habit viagra samples from doctor helps you to reach at an excessive limit.

There is still one more question to be answered. When we recognize any complete set of conditions on the surface, and have realized a certain air temperature under those conditions, as we can do everywhere on every day, we can go on to imagine that every one of those conditions will remain exactly the same the next day except for one, overhead PW values. If the starting PW values are then assumed to have doubled on the next day, what will the additional greenhouse effect most likely be as a cause of change in the daily air temperature? Observations from weather map studies keep telling me that the temperature will inevitably rise by about 10 degrees C for any location, no matter how cold or how warm it was on the first day, up to a limit that is only set once the starting PW value is above the 30kg level—as it usually is within the tropical belt. Is there actually enough evidence to substantiate such an extraordinary claim? Not by any of the more rigorous standards of proof, but I have not yet personally seen any reason to have doubts.

Carl

Posted in Daily Climate Letters | Comments Off on Climate Letter #1881

Climate Letter #1880

Today I’ll be opening three current maps that help to illustrate some of the things I have been writing about the past few days. One of he most basic understandings relates to the simple fact that low values of total precipitable water (PW) are generally associated with low air temperatures, etc. In this first image, when you look closely for areas having the very lowest PW values, meaning below 1kg, as in a large part of northern Canada, or a smaller part of northern Greenland, you can always expect to see temperatures below -30C. (All of these numbers are reported as 24-hour averages.)

Have the pills of order viagra and you can have erections like ever before. Homeopathic treatment for erectile dysfunction: Caladium- It helps to treat erectile prescription levitra dysfunction caused due to masturbation and with guaranteed results. You should be able to satisfy your spouse, there’s a solution for you. purchase cheap levitra Kamagra jellies are available in a semi liquid form while soft tablets are a chewable candy. deeprootsmag.org cheapest viagra in canada

The next map shows that this is the case today, and that it also holds true in a section of Siberia.  The coldest temperature ever recorded, -89C in Antarctica, did not have an associated PW value, but PW values as low as 17 grams have been reported in the same general area under extreme cold conditions.  Unfortunately, precise fractional PW readings below one full kilogram are not available from these maps, or anywhere else that I know of.

Now, using the same maps, you can look for what happens to temperatures when you scale up from 1kg to 2. Some patches of good size can be spotted extending both north and south from the Canadian low area we first looked at. In both of these we see how temperatures tend to work their way upward from -30C to about -20, a full ten degrees for just one kilogram of added PW. There are no finer differences displayed within this PW shading, but we might tentatively assume, from the looks of things, that higher PW fractions would be associated with higher temperatures as the 2kg area expanded away from the colder area. If you keep moving outward from 2kg through 3 and then stop at 4, I think you will find that temperatures by that point have reached about -10C. ZeroC and a PW of 8 can also be picked out as a regular combination. If these relationships are consistent, you might start thinking, as I do, that any time you see a double in the total PW value over that of any other area (on land or over ice) the temperature at the surface is likely to be around 10 degrees higher than the other. Bear in mind that the maps we are looking at are giving us real PW values and real temperatures. This has nothing to do with anomalies, or things like degree of latitude or height of elevation. Just total PW and temperature. It’s quite remarkable. Given what we are seeing, if you take the given PW value of any spot and move it some distance away in any direction, should you not expect the temperature for that spot to move right along with it? Maybe in real time? Is this how nature really works?

None of this tells us anything about what portion of any one PW reading should be attributed to mostly pure vapor in the lower part of the troposphere, and how much to the mixture of vapor, clouds and various other products of vapor condensation in the upper part, the part where jetstream winds are found. There are various clues available for this information but no hard data. When we see a “stream” of high-PW concentration all we know for sure is the total value. If the stream has a sharply-defined edge, as many of them do, and there is a visible difference in map temperatures on either side of that edge, we can make some rough calculations about how much PW value it would take to cause that difference, for an answer of sorts.

Along that line of thought, I want to show one more map, full of jetstream wind strength images. The long stream on the far right that passes over Europe, then curls around and turns south is of special interest because of the way its shape is a perfect match with that of a prominent PW stream in the top image. One can only believe that the two streams are intertwined, with the jet wind serving as a carrier of the PW concentration.. That concentration, moreover, has values in the high teens, about double what can be seen just off to either side. The difference, at a minimum, is almost certainly accounted for just by the total amount of PW progressing northward in that area of the upper level wind system.

Carl

Posted in Daily Climate Letters | Comments Off on Climate Letter #1880

Climate Letter #1879

Regular readers know that I have developed my own theory about a major source of global temperature changes. The theory is focused primarily on short-term changes, the kind that show up on the daily anomaly charts, but does not exclude the potential for long-term relevance. The cornerstone of the theory is based on my own, possibly unique, understanding of the extraordinary role played by one of the greenhouse gases, water vapor. Compared with all other greenhouse gases, water vapor is recognized as clearly the strongest of all in terms of ability to block a wide assortment of bands of outgoing surface radiation. It is also recognized as the only such gas that is not evenly distributed (or well-mixed) throughout the entire atmosphere, which normally would mean settling into a stabilized percentage of the entire gas content of the atmosphere, all because of the very brief airborne lifetime of any individual molecule of H2O.

This combination of very strong powers and geographical distribution that is unevenly dispersed, by a truly radical extent, has prompted a need for scientific inquiries into the potential limits of variability in the atmosphere, given that a certain amount of variability is inevitable. Science has answered this challenge by invoking the principles of the Clausius-Clapeyron equation, which limits water vapor content to a fixed percentage of the atmosphere. Under this rule, any production of vapor exceeding that percentage will swiftly result in condensation of the excess, which by association sets a limit to the vapor’s greenhouse power. The percentage figure is of interest because it is adjustable. Whenever the temperature of a parcel of air rises by one degree C, that particular parcel will be able to hold about 7% more water vapor without condensing. The parcel can always hold less than the maximum amount, and usually does, commonly reported as relative humidity, but never more.

My theory contends that the rules and principles of Clausius-Clapeyron may be of high evidence near Earth’s surface, but once water vapor has been transported to a level several miles or more above the surface we are confronted with a new reality. For one thing, the vapor will most likely have begun to condense to some extent, causing a mixture to form which is commonly identified by the name of precipitable water (PW). Any reference to water vapor at this level is then effectively dropped, with all remaining vapor, which is not precisely measurable, being covered in full by the new name. (Surface vapor is typically included as a part of “total” PW.) The mixture, with a few rare exceptions, is entirely composed of the same molecules as vapor alone, in that sense as if there were no condensation, but now we are in for a surprise. Whenever concentrations of the total mixture are measured, which is done with considerable accuracy and regularity, large parcels are observed having concentrations much, much greater than one could ever expect, given the thinness of the atmosphere at high levels and how cold it is up there.

He is an eminent urologist with a wide experience djpaulkom.tv levitra generic vardenafil in treating stone disease, urology diseases, prostate and kidney transplant. djpaulkom.tv cialis online Unless and until you don t have to worry about it. Parkinson’s disease can cause erectile viagra tablets for women dysfunction in men. It helps to viagra usa pharmacy strengthen the weak parasympathetic nerves and tissues required for an erection.

Before saying goodbye to Clausius-Clapeyron we should at least do some kind of test to see if the PW concentrations we are observing, according to the measurements, are actually real. Why not use the greenhouse test? If a large parcel of high concentration is real, not just an illusion, it should be capable of generating a correspondingly high greenhouse effect on air temperatures at the surface directly below. By a stroke of good fortune we have all the information we need directly in hand, ready to make such a test. I’ve been doing it by myself, every day, over a great many different parts of the globe, and have provided illustrated reports of the test results on many of those days. The high concentrations, while widely fragmented, must be real because the high temperatures they produce are real. And so are low temperatures likely to be realized whenever the PW readings for a location are lower than usual.

Once this cornerstone is in place, freed of any tight limitation by principles ruling the Clausius-Clapeyron equation, we must be ready to start asking new questions,. What determines the amount of new evaporation that can be delivered to the upper troposphere? Are there any limits? Why so much fragmentation? What determines its overall behavior, along with the likely lifespan of its molecules, once it arrives at this level? What are the causes of condensation, if not the C-C rules? We can even wonder about the possibility of long-term implications. There are plenty of ideas in sight for formulating answers.

Carl

Posted in Daily Climate Letters | Comments Off on Climate Letter #1879

Climate Letter #1878

Yesterday I wrote about three separate ways that greenhouse energy effects are produced in Earth’s atmosphere, how they are related, and how precipitable water (PW) inhabiting the upper levels of the troposphere, historically a relative latecomer, has assumed a leadership role outside of the tropical belt in both hemispheres. I think the conclusion was within reason, but I am not happy with the presentation, which needs to be reworked. I should have paid more attention to the dynamic relationship between PW in the upper troposphere and PW close to the surface, a subject that is rarely, if ever, discussed in public literature. I think it should be, and will give it my best shot in today’s letter.

PW at the surface is practically all vapor, and undoubtedly is subject to the principles of the Clausius-Clapeyron equation governing condensation. This sets tight limits on densities, which are dependent on surface air temperatures and the associated temperatures of the surface itself. These temperatures are directly influenced by the levels of concentration of CO2, methane and other well-mixed greenhouse gases in the atmosphere, establishing a feedback relationship that is fully embraced in the sciences, recognized by way of adding a large credit to the strength of CO2.

When ocean surface temperatures get warm enough, at around 25C, streams of water vapor start being lofted by rising air currents all the way up to a level of the troposphere where air pressure changes have occurred and resulted in an entirely different wind system from the one at the surface. When vapors enter this zone I believe it is entirely possible that the Clausius-Clapeyron principles no longer hold true in the same manner as they do at the surface. This means vapor concentrations are effectively not limited by air temperatures, even when those temperatures are relatively quite cold. Condensation still occurs, but in a more diversified way, resulting primarily in myriads of tiny droplets that form into clouds. My personal—and highly limited—observations, derived from studying the U of Maine weather maps, then tell me that the transformation of vapor molecules into cloud droplets does little to alter the strength of the greenhouse effect expressed by vapor alone prior to making this transformation.

For this reason you can see many fanatical ads for different herbal medicines. order cheap cialis But before anything else, let’s take a glance at viagra store in india the main research and highlights. This action regulates the sponge-like area around the penis to relax thereby increasing blood flow to the arteries and viagra without prescription http://icks.org/n/bbs/content.php?co_id=Contact_Us veins. Simply put though, directories viagra online ordering are a solid option for those building links to long tail niche sites.

Upper-level PW is different in many ways from the PW that exists at the surface directly below. It is at times much more powerful in greenhouse effects but also tends to be far more fragmented, creating a broad mixture of high and low concentrations that are constantly in motion and thus only temporary. No matter how these variables happen to line up, both bodies of PW continuously express their own unique greenhouse effects, and these effects, by observation, are at all times additive when realized at the surface. Moreover, I have found no reason to believe there is any delay in timing between the time when changes in the combined greenhouse effect reach the surface and the time when temperatures respond. When one changes swiftly, as is often the case, so will the other, with no need for any kind of air movement or other means of mediation.

Now we come to a key question. What happens to PW existing mainly in the form of water vapor near the surface when a strong concentration of high-level PW moves over head and starts warming the land and air at that surface? (Deep water surfaces, while similar, are a separate issue.) I believe the surface evaporation rate will increase from any available resources as a feedback, causing an increase in total PW value on the spot, and with it a further amplification of temperatures. Conversely, a below-average “dose” of daily PW input will by itself result in a relative cooling of surface temperatures, leading to a withdrawal of surface water vapor through condensation. This activity translates into a net loss of total PW in the local atmosphere, and a corresponding loss of its net greenhouse effect. Should the overhead supply of PW for the day constitute a truly substantial shortfall from average, as we saw in Texas just recently, the takedown in surface water vapor could be further aggravated by losses of large amounts of everyday evaporation that has been stopped by a rapid onset of surface freezing. Taking all such effects into account is a real challenge!

Carl

Posted in Daily Climate Letters | Comments Off on Climate Letter #1878

Climate Letter #1877

For quite some time I have been composing these letters around various arguments associated with the basic idea that precipitable water (PW) is the preeminent producer of greenhouse energy effects. One argument is that, outside of the tropical belt, the effect is generated by combining the effects of two separate layers of PW that are observed to exist in the atmosphere, embedded in two separate wind systems. In each of the layers the concentrations of PW have wide variations geographically, and these concentrations also tend to vary widely between the layers in vertically associated locations. Generally, the surface layer will have its highest concentrations in the lower latitudes, rapidly declining for locations sitting closer to the poles, and always reduced in places of high altitude. Lower-level concentrations also tend to have relative stability from day to day. Overhead concentrations follow an entirely different set of rules of distribution, including much more variability over most locations, thus serving as a primary cause of significant near-term temperature variations at the surface.

Today’s average temperature for the entire globe, year around, is about 15C, and rising. Calculations show that if the planet had either no atmosphere at all, or no atmospheric components capable of exercising greenhouse effects, the average would be more like minus-18C—a pronounced difference of 33 degrees. Regional averages would naturally be higher in the tropical belt and trend lower toward the poles. Because of the well-known polar amplification effect, I suspect that polar temperatures, relative to the tropics, would be colder by more than 33 degrees if there were no greenhouse effect, possibly ranging up to 40C or more.

This raises an interesting question. Assuming that the greenhouse effect adds an average of 40C to Earth’s temperature in the mid to higher latitudes, everything else being equal, how could we divide up the source of those 40 degrees among the various phenomena that are productive of greenhouse effects? Offhand, I can think of three distinctive agencies, starting with a combination of the well-mixed greenhouse gases—CO2, methane, nitrous oxide and so on. The surface layer of PW would be another, and high-altitude PW the third. Looking backward in time, starting with a very frigid planet, the well-mixed gases should have been the first to appear, followed by low-lying vapor when evaporation became possible, and finally high-altitude PW once the ocean surfaces had warmed enough. The volume of this material remains dependent in some way on ocean surface temperatures and how they are extended geographically, which varies over time. Many possibilities can be imagined, and the same can be said about the circulatory behavior of concentrated PW streams once they have been lofted to jetstream heights.

Produced as Michael Joseph Jackson The world first got a glimpse of this celebrity when MJ appeared on TV together with his sibs, afterward known as The Jackson Five. viagra price While many cipla viagra generic factors contribute to loss of penile sensation. Hawthorn berry is one among prescription du viagra the best herbal male enhancement herb helps in increasing confidence, sexual attraction and satisfaction. This viagra cheap generic http://www.devensec.com/images/sd-slides/sustain-9.html medicine gets finished from reputed firm and can be purchased online in cheapest price.

By watching the animated version of total PW, which allows the course of high-altitude streams to visibly stand out, we can see how they roll over practically every corner of the two hemispheres with some kind of a daily dose. These dosages tend to come and go quickly over a wide range of values. The result, first of all, means that an average value for all such doses, applicable to any given date, can be calculated over a number of years. Any dose that is measured on a particular day can then be held up against the proper average for comparison, and the difference can be thought of as a likely source of a temperature anomaly down below. Consider the fact that we often see anomalies on the cold side as great as minus-20C, and even more, in widely scattered locations on any day of the year. Does this not suggest that on an average day, for these and a good many other locations, in the world as we now know it, the overhead type of PW may be responsible for about 20 degrees, or perhaps half, of the 40C (or so) warming total that we presently enjoy from the overall greenhouse effect? What does that say about how fast this particular agency has grown, historically speaking, and what might it mean for the future?

Carl

Posted in Daily Climate Letters | Comments Off on Climate Letter #1877

Climate Letter #1876

The connection between global warming and severe outbreaks of cold winter weather has suddenly become a hot topic for media outlets everywhere, deservedly so because the relationship is not just unclear, but counterintuitive.  Reporters are giving us a chance to hear opinions from the best scientific minds about what they think is going on that can explain a phenomenon like the one we have just experienced.  I will re-post two of the more broadly-based stories I have seen, starting with this one from VOX, containing a number of individual observations while stressing the lack of strong consensus among scientists:  https://www.vox.com/22287295/texas-uri-climate-change-cold-polar-vortex-arctic. Some excerpts: “Winters can warm up over the long term while the polar vortex may spill over more frequently in the near term…..Maybe we can’t say for sure there’s a connection, but it’s a matter of how soon that connection will become clear and how big that connection will be…..Scientists do expect to get a better handle on what to expect with cold weather extremes as they gather more data.”

Bob Berwyn has also written a lengthy piece for Inside Climate News, entitled “Warm Arctic, Cold Continents? It Sounds Counterintuitive but Research Suggests it’s a Thing,” which makes it clear that current climate models are unable to make good use of events of this type that we have seen to date, by way of adjustments into projections of the future—a possible weakness.  “….one weakness in the models might be that they can’t accurately show a specific mechanism that makes the warming Arctic affect the mid-latitudes……The models are constantly being updated, every winter and the divergence between their projections and the observations is striking….. By contrast, the model predictions for summers are nearly perfect…..Cohen said he considers complex atmospheric movements involving the polar vortex to be a key link between the warming Arctic and extreme cold events in North America and Eurasia…..That disruption happens, he said, when the warm Arctic air works its way high into the upper atmosphere, where it crests like a wave to break through the vortex…..It’s getting increasingly difficult to get severe winter weather into the mid-latitudes without a polar vortex disruption, and amplified Arctic warming is favorable for disrupting the polar vortex.”  This is a view that sounds correct as far as it goes, but what about the full mechanism behind events that follow?  Some other attempts to find a mechanisms are also described.

None of the stories I have seen have anything to say about a possible role being played by precipitable water (PW), or about how alterations in the normal pattern of high-altitude air air pressure configuration might be an integral part of the physical mechanism. Both of these, linked together by the organization and behavior of jetstream winds, are visible today in modes that are basically quite extraordinary, with relevance to their having a direct effect on the unusual way that global temperatures are currently distributed. This entire sequence has been discussed in detail in recent letters. Today I will just show three key maps with coincidental imagery effects that provide supporting evidence. Be sure to take note of the sharp contrast between the upper parts of the two hemispheres in all three.

Just visit the center isles of your local grocery store, pick up a few viagra france products and read the labels. Therefore, it is suggestion that a person should firstly visit a physical for a medical check-up that will uncover the cause of his impotency, only then he should ask for taking shop viagra medicines. With sheer image quality, this smart lens gives PEN and in particular O-MD owners with the high price of the low cost medicine. levitra online from india Every impotence case is unique in its own right. viagra on line

Carl

Posted in Daily Climate Letters | Comments Off on Climate Letter #1876

Climate Letter #1875

Because of the disastrous conditions occurring in Texas, for which no proper preparations had been made, studies related to the polar vortex are sure to proliferate in coming months.  There is an acute need for more and better answers. The actual physical nature of a vortex breakdown can now be timed and charted quite well for recording purposes.  The questions that need answering mostly have to do with causation and/or the reasons behind the extraordinarily puzzling effects.  We were in the midst of a record-breaking warm winter in the Northern Hemisphere when its status quo was suddenly interrupted by a close to record-breaking cold wave over several large territories, yet not everywhere.  A new explainer from AP contains numerous quotes from meteorologists and climate scientists who give the event their best shot:  https://phys.org/news/2021-02-topsy-turvy-weather-polar-vortex.html. Another good source of recent scientific thinking about vortex behavior was reported in an article from Mashable back in early January, when this breakdown was first being detected:  https://mashable.com/article/polar-vortex-explained.  

There is generally an agreement that higher temperatures caused by climate change are a major cause of these events, but the exact mechanics remain vague. The Southern Hemisphere, which has warmed only a little, is not commonly affected by these things. In the NH, by contrast, these events are not only getting more frequent but this one has turned out to be among the worst on record. Then why should surface temperatures, on balance, be getting quite a bit colder as a result, and even breaking records in some places? If you read these letters you have heard about a potential explanation for such effects, which you may or may not be ready to accept, involving the greenhouse energy effect of precipitable water (PW) and the unique way in which it is distributed in the atmosphere. Science has not come to terms with this concept, even to the extent of recognizing it as a possibility. No acceptance, no open denial. It is simply not an active consideration, never mentioned.

This Texas situation is one that calls for science to get interested, because the main anomalies are so large. It can start by studying all of the reasons for why we have daily temperature anomalies, both warm and cold, large and small, some of which, lasting only a few days, or even just one day, can be pretty extreme.  Minus 28C (50F) is pretty extreme. It came and then it went.  A basic cause in a far off place is understood, but what about the immediate cause behind the -28C? For sure, that’s a really rare one, but think of all the other large anomalies of similar duration that are not at all rare.  They too have an immediate cause, and they all can use a valid explanation, simply because they are an everyday part of the natural world if there is no better reason.  That’s what science is for, having been so ever since the days of Aristotle.  In modern times we often can find other good reasons for wanting to know all about the sources of short-term temperature anomalies, and not just the most extreme ones.

Men that have psychogenic Erectile Dysfunction are more likely to suffer from psychological issues such as anxiety, depression and stress increases the risk of genital herpes out- go to storefront levitra vardenafil generic breaks, arthritis, asthma etc. 10.Unhealthy skin: Stress leads to accumulation of toxins in body. This raises the risk of youngsters developing childhood cancers, particularly leukaemia. sildenafil 50mg tablets Read this and find out about these cialis samples in canada drugs, particularly the kinds of female libido booster and how it can treat impotence. Baltimore Ravens Tickets: Franchise Overview The city of Baltimore had levitra prices some strong ties with its first NFL team.

If science were to make up a list of all the things that can cause short-term temperature anomalies, PW would have to be on that list, in fact right at the top. All of the information one could ask for is available, much of it all packaged up and ready to use. On any given day, PW’s departure from average can scale up or scale down with great flexibility, reaching exceptionally high maxima in either direction, completely unmatched by any other regular anomaly contributor. Impact timing, as modified by processes commonly either fading in or fading out, is virtually immediate.

PW effects on any surface location are expressed from two separate sources, creating a combination that is effectively additive. One of these sources is of a varied but generally regular type, having residence in the lowest part of the atmosphere. The other, with residence in a separate wind system in the upper part of the troposphere, has much greater irregularity with respect to concentrations, which at times will exceed the concentration in place at the surface, plus a more constant propensity for movement. Its fluctuations, which can be observed by instruments, appear to account for a major portion of a large majority the largest anomalies that occur in the mid-to-upper latitudes of both hemispheres.

Carl

Posted in Daily Climate Letters | Comments Off on Climate Letter #1875

Climate Letter #1874

What exactly is the polar vortex?  An excellent description by a pair of US research scientists has been presented in an article written for The Conversation, available at this link:  https://theconversation.com/what-exactly-is-the-polar-vortex-153958. I think the authors are on exactly the right track, in part because everything they say fits so well with the phenomena we have been seeing in the Weather Maps throughout this winter.  The authors depict a strong connection between unusual vortex activity and abnormal jetstream behavior at a lower level but they overlook one of the key details, which would be a reasonable description of how the connection is transmitted.  Changes in air volume distribution in the stratosphere must occur when normally concentrated vortex winds collapse and spread out, implying changes in air pressure distribution on the top layer of the troposphere, starting right below the stratosphere.  There should be lots of randomly confused movement of regular pressures over an expanded area, with some downward pushing due to an increased accumulation of air molecules while other spots are lifting. A lifting of pressure would be expected close to the area of original vortex concentration, near the polar center. The entire pattern of disorderly distribution is consistent with what we see happening these days on the map of high-altitude air pressure configuration in the Northern Hemisphere. The pattern that results has a direct effect on the way multiple jetstream pathways are set up, along with the winds they bear, in a manner that never seems to change. Also, the shaping of each of these pathways and the proximity of any one of them to another has considerable effect on the relative strength and intermittency of their winds.

This newly organized and expanded pattern of jetstream winds will keep changing as the pattern of air pressure configuration changes, often in random ways, still affected by the behavior of vortex air movement as it seeks a return to normalcy. Once the vortex has normalized the air pressure configuration should become more compact, more like it is today in the Southern Hemisphere, and jetstream wind pathway locations will thus be tightened up, leading to weather patterns with anomalies that should be reduced in scale.

There are some big and rather interesting questions that remain outstanding. One concerns the exact reasons behind any abrupt collapse of a mid-winter vortex. Should we expect future increases in the frequency of these events? The event itself is marked by a profusion of both warm and cold temperature anomalies, all of significant magnitude, with cold ones presently appearing to have a considerable edge. Why should the cold ones be winning while the Earth is otherwise getting warmer? Will things stay that way in the future? Today’s air temperature for the globe, notably 0.1C colder than it was on average for the same day thirty years ago, is far off course by recent standards. There is only one good reason for this—the restricted movement of high-altitude streams of precipitable water (PW), lowering its normal greenhouse energy impact, due to the influence of current aberrations in jetstream behavior.

Be it suffering from cough, cold, or fever, we have grown accustomed to so when times are rough and we are under more stress it becomes harder to change these patterns. purchasing viagra The advantages are many for Kamagra and hard long time for a good period of 4 to 5 hours with assurance of no issues unless there is overdose of the component more than once in a 24 hours 5mg cialis tablets period of time. Dose: For most patients, the suggested dosage is 50 mg taken, as required, pretty nearly 1 prior hour achat viagra pfizer sexual movement. There are lots of types of kidney diseases like malformations of the kidneys, cystic kidneys, kidney disorders, kidney generic sildenafil tablets tube problems, inborn kidney problems, kidney stones, and kidney cancers.

One other question raised by the vortex story concerns the apparent fact, according to many reports, that collapse of the extremely cold vortex wind involves a sudden warmup of its air mass. What is the source of heat that does the warming? All I can think of, in speculation, is that the long heatwave we had in the Arctic earlier this winter must somehow be involved. Warmer than usual air above the pole—although still very cold—would nonetheless tend to expand, with some of it pushing its way into the stratosphere in quantity, quite possibly in a location where suction power at the center of the vortex would have access. If warming resulted within the central cone of the vortex and were to continue, would interior winds tend to increase in velocity, causing the suction power to accelerate as a consequence, drawing in still more warm air, etc? That sounds like the recipe for reaching a tipping point that could end with sudden destabilization. Just a thought.

Carl

Posted in Daily Climate Letters | Comments Off on Climate Letter #1874

Climate Letter #1873

A big change today. We’re going back to the same spot in the corner of west Texas that had the anomaly of at least -28C yesterday, with a precipitable water (PW) reading between 5 and 6kg. Today the PW reading has about doubled, to a bit over 10kg, and the average temperature for the day, along with its attendant anomaly, has risen by a full 10 degrees C. There is no way to explain the temperature increase, which requires a real source of added heating power, apart from the additional greenhouse energy effect supplied by the increase in total PW directly above this location. The snow on the ground, and its significant effects that were discussed yesterday, could not possibly have melted away. Did a mass of warm air move in from somewhere else? That would possibly be an option if it could be proven, but anyone who wants to make such a claim will have to supply the proof—and then do so consistently, not just here but everywhere else when a large and rapid temperature change has occurred. I think changes in PW can in large part be held to account for practically all rapid temperature changes, especially the biggest ones, swiftly, reliably and consistently. I go on to believe that science should accept as a fact the rule that, outside of the tropical zone, any doubling of total overhead PW will add enough energy to the surface to increase air temperatures by approximately 10C, aside from any offsetting forces of a timely nature that may be in play. (Subsurface absorption of incoming energy by ocean water is such a force and almost always in play.)

On the next three map images you will be able to see detailed signs of change in temperature, anomaly size and PW values in deep west Texas, all derived from contrasting images formed yesterday on maps having similar imagery but a different line of perspective (for reasons to be explained later). In order to do this skillfully you should be ready to magnify the images by up to 500% and keep making references to the far-off color coding scales. The coding technique was greatly improved not long ago but it still takes a considerable amount of time and practice to get the most accurate results from tightly detailed imagery.

I only pay about $300 a year for malpractice insurance (some of you pay more in tadalafil online mastercard car insurance a month) as compared to an MD who can pay up to $100,000/ year. By this they refer to the test revealing what we see when people are in a order cheap viagra shape of diamond. ESPN.com, along with Jayski.com, will feature extensive video, audio and editorial coverage of the 2011 NASCAR order cheap levitra season, as well as providing multiple ESPN Fantasy games and content distributed to other emerging platforms such as Apple’s iTunes Store and Microsoft’s X Box Live. Drugs that viagra generic canada affect the body’s chemical balances and hormone levels Rarely causes of ED include scarring and curving of the penile Penile erection failure is common in adult men.

Note the numbers under this globe—Earth’s average air temperature is the same today as on an average day thirty years ago! Even the Arctic is close, but unfortunately not for long.

Don’t miss the light brown shading that has just entered deep west Texas. Now we can turn our attention to the gigantic stream of PW rising out of the central Pacific, which is significant because of the incidental role it has played in this entire North American outburst of bad weather. The stream in virtually its entirety was originally gathered up and transported northward by basically the same enlarged jetstream wind that eventually barreled down the western side of the continent, as you can visualize from this next image:

What happened to all the moisture it was carrying?  A major part of it (next image) appears to have rained out over the open ocean.  Some of the rest wandered away to the north when the jet wind made the bend and headed south.  Surviving parts ended up either as heavy rainfall in the Pacific Northwest or as snowstorms across many of the western states.  There was just not enough left to generate more precipitation by the time the jet reached Mexico and southern Texas:

Carl

Posted in Daily Climate Letters | Comments Off on Climate Letter #1873