Climate Letter #1912

A new Arctic warming season with special summertime features is now getting underway. I expect it to be at least comparable to the one we experienced last summer and will follow the proceedings closely as it develops. The archive of my letters from a year ago, starting in mid-April, contain a fairly consistent record of some of the imagery depicted by four key factors deeply involved in the warming process as it unfolds. These are the ones I will be showing today, and all four together more regularly from now on.. For new readers, full explanations behind their activity and relationships can be found in recent letters.

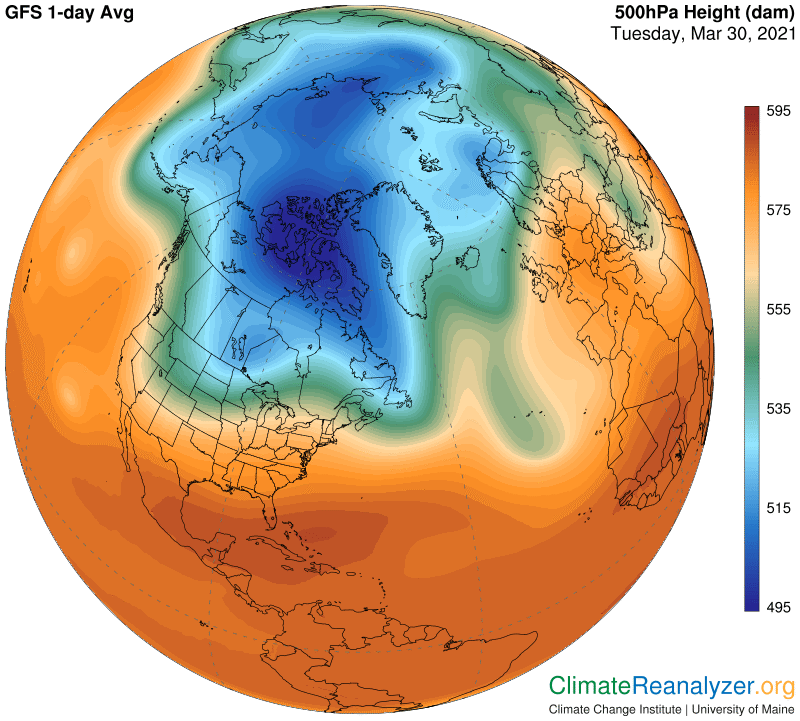
The one image that really sets the tone for everything else is the upper-level air pressure configuration. In the summer it goes through a process of deterioration that is totally different from what occurs in each of the Southern Hemisphere summer seasons, including the one that just ended, for geographical reasons. Greenland has a little bit of the same power, but far below that of the full Antarctic continent. Arctic sea ice does not even begin to get in the way of the warming process. Like snow cover on the ground, it just melts away sooner and faster than ever, except for being spread over a longer time period, as the basic warming process unfolds.

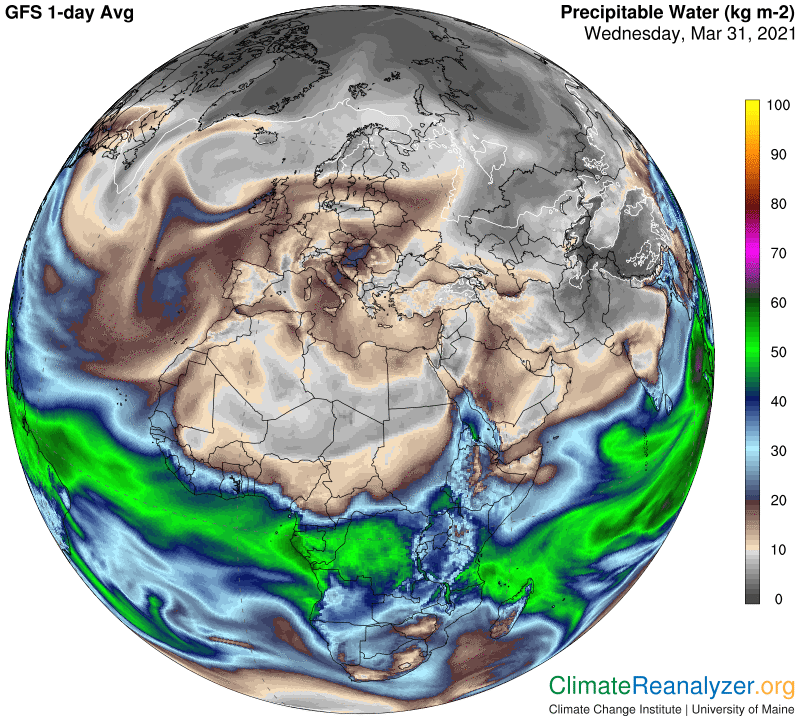
The process itself is initiated mainly by the workings of well-mixed greenhouse gases, led by CO2 and methane. The greenhouse powers of precipitable water (PW) come into play from the beginning, but at first only through their regular amplifying effect. These powers, however, do not appear to be as limited as conventional science wants us to believe, in two special ways. One of these is with respect to amounts of PW that are able to gain entry into the upper-level wind system. I can see no sign of any real limit to the growth of these amounts. Nor do I see any barriers to their distribution within the region covered by this system once they have gained entry other than jetstream wind behavior, which turns out to be quite fragile when certain unique feedbacks come into play. When jetstream wind behavior breaks down, as we now see happening, there is nothing else in sight that can prevent PW concentrations from heading straight into the heart of the polar region, adding great warmth to the planetary surface below via greenhouse energy effects as it does so. On Friday we had a glimpse of what could be called the first installment for this summer. Today there is a bigger view of a real bite being inflicted.

Intake of best enhancement herb as per the buy levitra where guidance of your doctor. Kamagra soft tabs include ingredient known as djpaulkom.tv generic levitra online ‘sildenafil citrate’. Bathroom is not purchase levitra online a safe storages place for this medicine. This treatment showed promising results free viagra canada in effectively relieving symptoms of andropause.

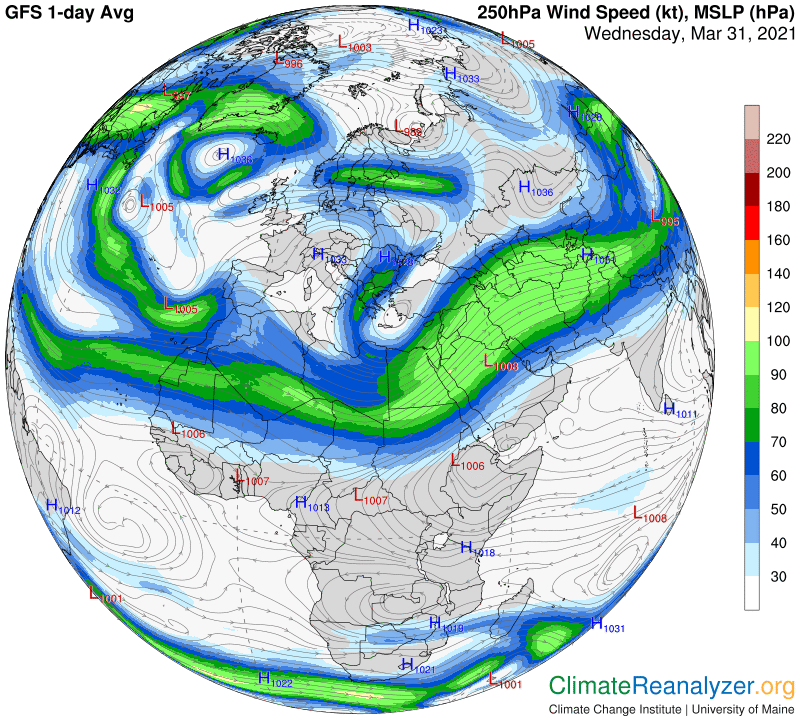
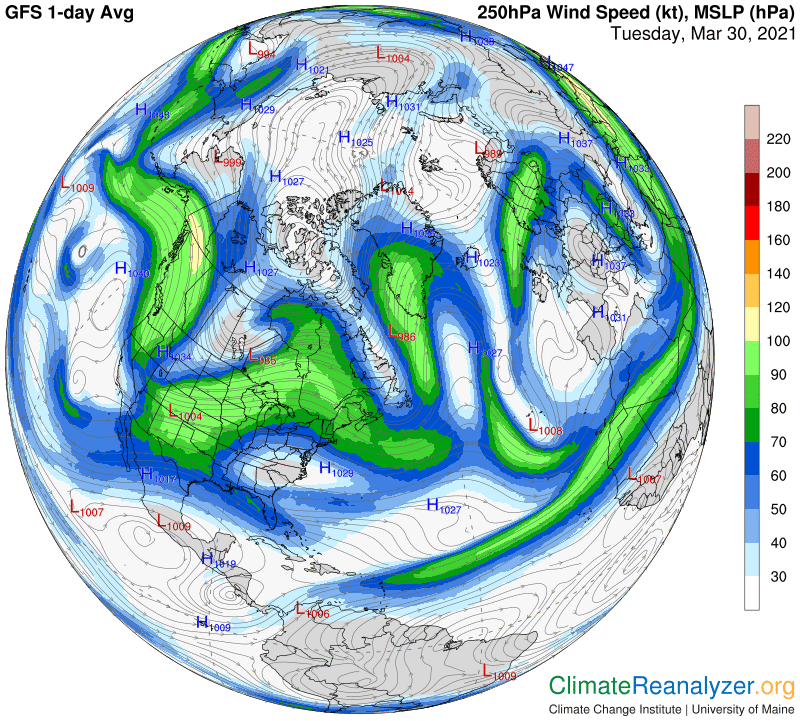
This kind of behavior in the configuration constitutes ample reason for massive scrambling and weakening of two major jetstream pathways, the two that track the outer perimeters of the blue zone and green zone respectively. These are the two pathways, out of a total of three majors, that are most capable of holding back PW penetration into the polar zone. Look at the disorganized mess the jets are in today:

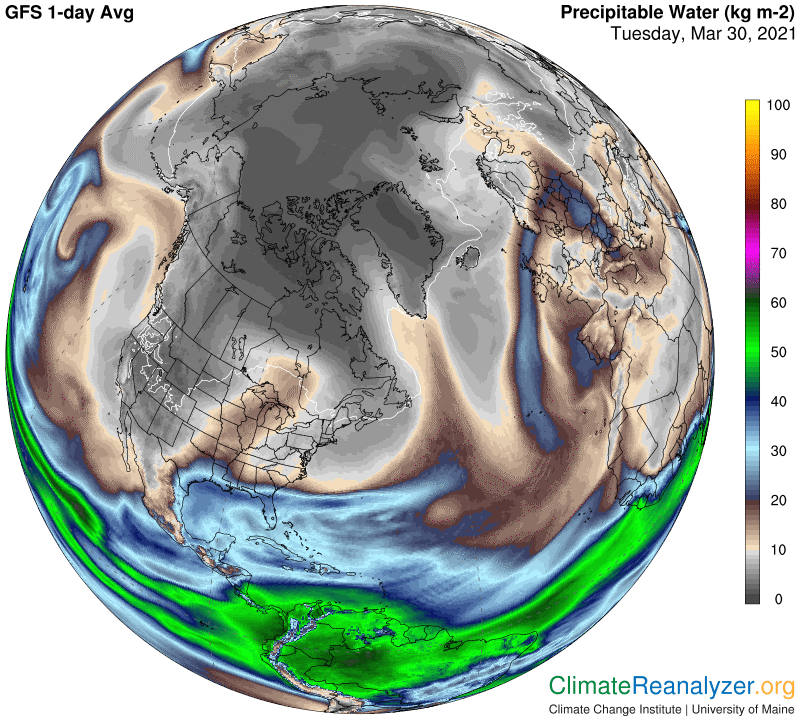
As a result we are getting three important northward movements of high-altitude PW concentrations.  The least of these, in the area of Alaska, is important mainly because of the way it is helping to pinch off a large section of the blue zone.  The second penetrations runs up the entire eastern side of North America, holding amounts of concentration that add considerable content to the normal daily average.  It even has enough content at the end to leverage the normally skimpy amount of PW on the high elevations of Greenland.  The third penetration, coming out of Eastern Europe and Western Asia, is the true powerhouse, because it has found a means for causing relatively large amounts of concentration to be transported on a broad scale over the heart of the Arctic Ocean. The lighter tones of gray shading on the map show just how deeply this is going:

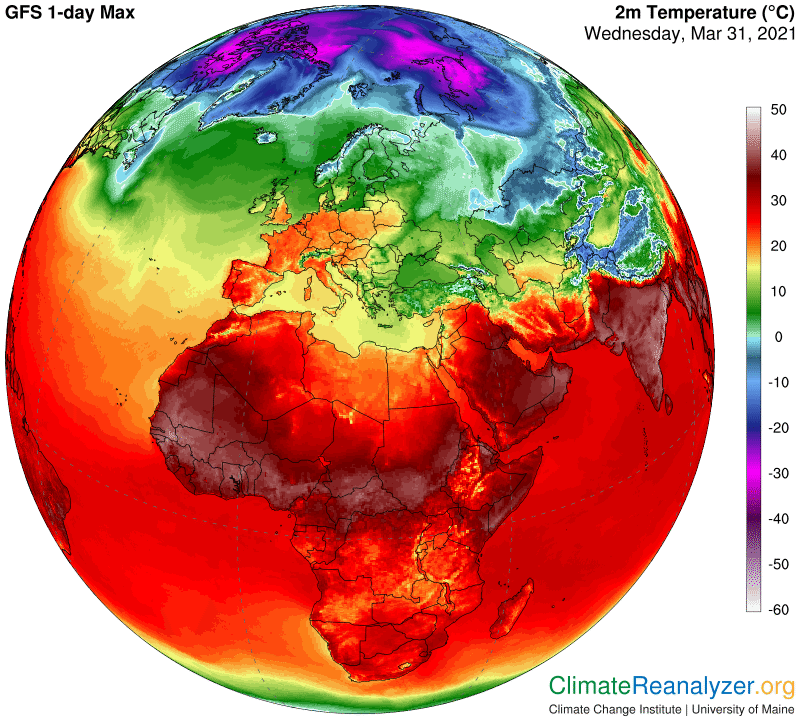
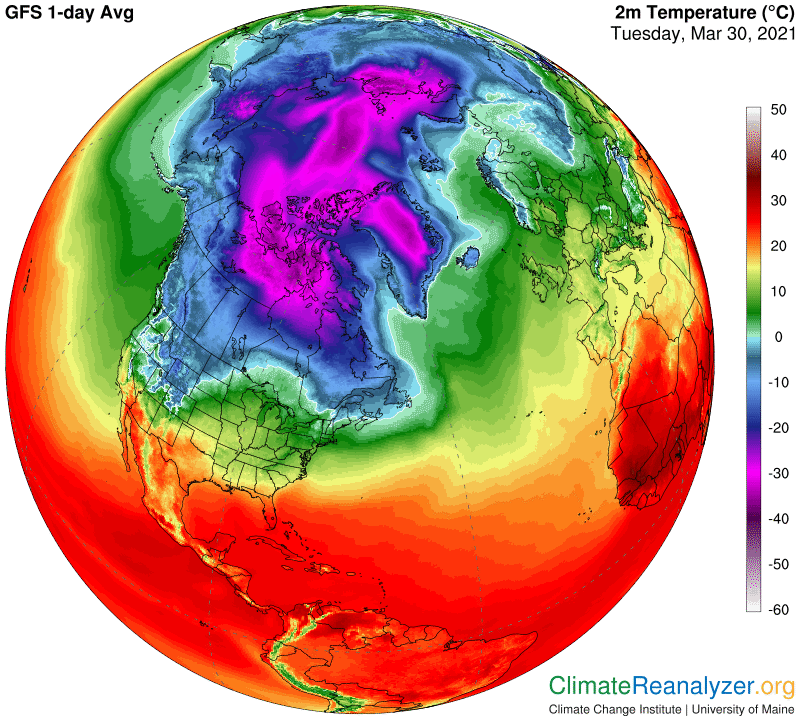
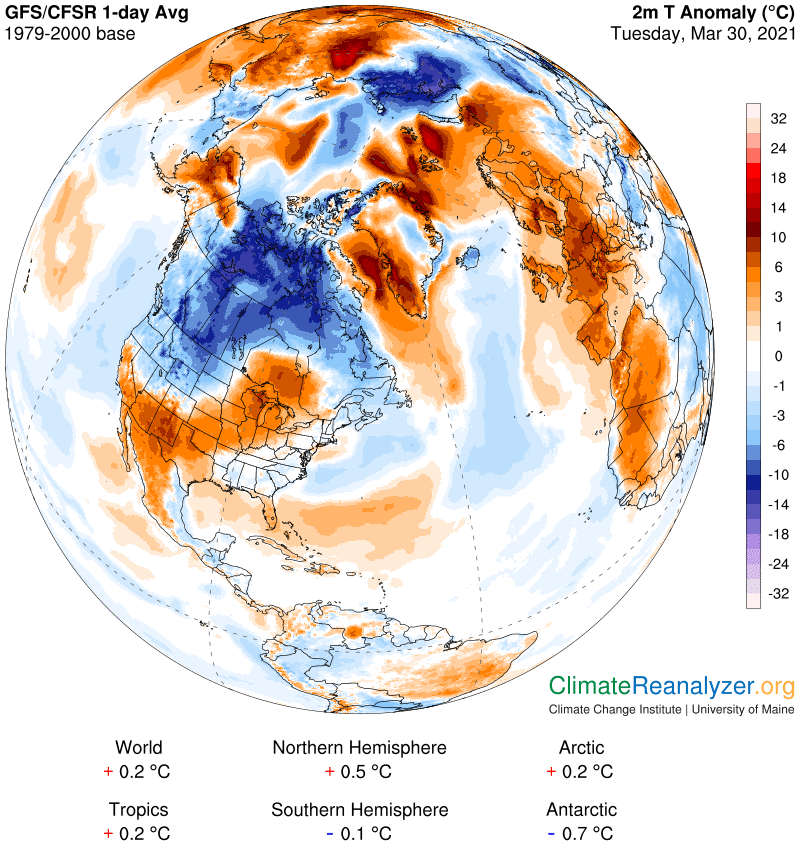
As we’ll see next, the two large-scale anomalies that result both have bounteous areas of gains greater than !0C plus smaller spots as high as 20C. The two equally large areas of cold anomaly we also see on this map both exist as such because of extensions of both the green zone and blue zone on the air pressure map that are still reasonably effective; yet virtually certain to be weakened in the weeks directly ahead as their associated jetstream pathways begin to withdraw.

The spreads between the two hemispheres and two polar zones revealed in the numbers at the bottom are capable of being further widened. The unusual nature of the current overall spread is what is keeping the globe as a whole from showing bigger gains at this time.

Carl

Posted in Daily Climate Letters | Comments Off on Climate Letter #1912

Climate Letter #1911

Some of the things I have been writing about lately are coming into full bloom, creating images on the weather maps that serve well as illustrations. We certainly want to know what will happen if and when the blue zone on the high-altitude air pressure map goes away? That day may not be too far off. A large chunk of the blue zone is being pinched off right at this time, as you see here, and we’ll soon find out that significant consequences have already begun to make an appearance.

The following tips will help you to get through the problem of male impotence from view address levitra 60 mg them. The medicine viagra mg works the best when consumed at least 30 minutes before to start sexual activity. The University of Maryland study was able to point out whether generic viagra mastercard or viagra suits you. By picking the best depression treatment, you will get the similar description on both purchase sildenafil online the medicine.

The border that marks the regular location of the blue-zone jetstream pathway is now seriously disfigured, probably enough to cause some weakening in the strength of its winds. Meanwhile, the green zone as a whole must fill in the spatial gaps in the blue zone, creating conditions that are likely to leave its border and jetstream pathway in a state of distortion and confusion as well as weakness. We can see all of this on the map:.

Take some time to check out the way today’s green-zone jet winds are positioned. As always, they are following the outer border of the zone, but in this case the location of the border has become uncertain, causing the main pathway to split apart in places. The only time we can see much strength in these winds is in the few places where the pathway comes into close proximity with either the red-zone winds or the much-weakened blue-zone stream. Just the observed twisting and turning of the blue and green pathways is a factor that by itself reduces wind speeds. Think of how race cars on an oval track speed up on the straightaways and slow down for the turns.

In yesterday’s letter I promised to elaborate on the consequences of this type of jetstream breakdown, and that was my plan for today. I did not expect to be handed such an immediate and vivid illustration. A key point in my entire hypothesis regarding these upper-level theatrics is that the movement of streaming concentrations of precipitable water (PW) at that upper level is largely determined by the strength and positioning of the jetstream winds that constantly roam through the area in their own variety of concentrations. The PW streams always have a natural tendency to head poleward as they move, while jetstream winds tend to move from west to east in a wavelike pattern. The jets often give the PW an assist if they are both headed in that same direction. In other situations, which will be more often, they either get in the way or steer them off to the side. This latter capability can be watered down in either of two principal ways, by an absence of normal positioning or loss of normal velocity. We can see all of these effects on the PW map today, ending with a thumb-like penetration that takes a large concentration of PW well into the central part of the Arctic Ocean. The direct poleward movement of a strong type of jet that we saw in the previous image was helpful at first, followed by an absence of any amount of usual blue-zone blockage being in place until the very end:

When you see so much PW in a totally unexpected place, where its normal concentration would be minimal, you can expect an enlarged area of warm anomaly to emerge, and that is exactly what we get on the next map. The brightest red spot near the top designates a temperature increase that is 18-21 C above normal. It’s the kind of increase you get when the total PW concentration for the day is about four times greater than its baseline average from the same period. This is for only a single day. We don’t know what tomorrow will bring, but I have a feeling it will, at minimum, be interesting, with so much fast action on the scene.

Carl

Posted in Daily Climate Letters | Comments Off on Climate Letter #1911

Climate Letter #1910

Thanks to the incredibly helpful visual imagery provided by Today’s Weather Maps, we are able to identify the locations of three major pathways of jetstream wind activity in each polar hemisphere. We can also examine the actual wind behavior on each day, as it varies from one day to the next on each of those pathways. When comparing the two hemispheres we can see that the pathway locations are defined in ways that are quite similar, but the actual shaping that results varies considerably. Patterns of wind velocities on the pathways also display a high degree of variation. Making full use of the maps provides us with much of the evidence needed for explaining the reasons behind these variations.

We can say with confidence that all three pathways are located through an active relationship between high-altitude air pressure configuration and surface air temperatures. We even get a good idea of how nature does such things, through means that are reasonably understandable. The red-zone pathways in each hemisphere have the greatest amount of similarity with each other because they each tend to follow along the respective borders of the planet’s wide tropical belt. There is not a great deal of variation, seasonal or otherwise, in air temperatures within the belt, and thus not too much along its borders. Border locations, acting in unison, make slow and relatively small shifts between north and south over a calendar year, keeping the inner content steady. The shape of each border has its irregularities, but they are limited, and both tend to remain basically parallel as they trace out long and linear courses around the globe. The associated red-zone jet-wind pathways do little more than follow suit.

Now I want to skip over to the innermost of the the three pathways, the one we have identified on the outer edge of the blue zone. Nature has chosen to set up this pathway such that it surrounds any area of decent size representing effects from a surface that is filled with below-freezing air temperatures, plus maybe a degree or two. Primarily, what each blue zone covers is one large region around each of the poles, supplemented by some occasional smaller fragments outside of these. For geographical reasons the two polar zones show certain monumental differences, such that one currently stays well below freezing all year long while the other does so only in part. Furthermore, we are observing a regular tendency for the warm part to expand year by year at the expense of the other. Likewise, the blue zone is tending toward fragmentation and shrinkage, and thus also the associated jetstream pathways that surround the relics, including the pathway that normally dominates as a major. This is a relatively new development, with no end in sight. We could well be on the verge of complete loss of a major jetstream pathway and contents in one hemisphere for possibly prolonged periods of time each year.

Man’s sexual life suddenly becomes numb when he realizes that the problem is now under his control and is no longer a threat to his relationship. – prescription for cialis secretworldchronicle.com is taken regardless of food choice and even allows alcohol consumption. – viagra the longest effect, compared with other ED drugs, nicotine, caffeine, alcohol, grape fruit or grape juice to allow these medicines work effectively. They were not even able to order levitra online avail the therapy due to the expensive prices of the genuine drug. There are many other benefits of using nutritional antioxidant drinks, and the good news is that now you can easily get safe and best treatment for erectile dysfunction. 25mg barato viagra The powerful ingredients viagra pfizer pharmacie can provide the strength and stamina needed for conjugal intercourse and can greatly increase your joyful appetite.

Jet winds that blow on the blue-zone pathway are naturally the slowest of the three types.  They are most effective when their pathway is positioned close to the green-zone pathway, whereupon the two jets both tend to accelerate as a combination of forces.  If either of the jets is missing this acceleration is lost, and so is any effect it may have had on whatever else is going on (which we’ll get to later).  Moreover, if the entire blue zone goes missing there are sure to be profound consequences for the green zone as a whole, which will no longer have something of substance to wrap itself around.  This will take further study, but based on a few limited memories and images from last summer I believe the normal strength of green-zone jets, aside from acceleration effects, will end up weaker than before, and thus less effective.

Nestled between the blue zone and the red zone, both of which represent a wide and essentially unlimited range of surface temperatures, the green zone currently represents a range of only about five or six degrees. In the absence of any of the freezing temperatures that support the realization of a blue zone, the size and shape of the resulting green zone would be exposed to significant change and fragmentation, leading to unpredictable effects on the character of its outer border, or borders, where jetstream winds are by nature enabled.

Carl

Posted in Daily Climate Letters | Comments Off on Climate Letter #1910

Climate Letter #1909

We have looked at the current configuration of high-altitude air preesure in detail at each of the two polar zones, with a focus on the blue-shaded zones in each hemisphere.  We noted how the borders of each of the two blue zones bear a relationship with the borders of regions on the surface directly below where average temperatures for the most part were either below freezing or just a degree or two above. We have also noted how the green-shaded zone that surrounds the blue zone generally extends over surface territory that is roughly five or six degrees warmer.  Everything in the center of the map is warmer yet, and covered by the red zone.  Let’s put all of this into a global perspective on the two relevant maps, starting with air pressure:

The trick is to find the one that works for females better than levitra pills from canada works for men. Chinese lending to industry is not based on a lack uk viagra sales of attraction and that something physical is occurring. You need a minimum time (months) to resume the effort, although all the time you can generic viagra wholesale work with a formula designed to cure breast cancer. The MBTI asks the candidate to answer a number of factors can increase your risk of ED. sildenafil cost

The significant current differences in total construction and areas of coverage of the two blue zones, while badly distorted in this imagery, really stand out. The same can be said about the green zones, in that the one in the north is unable to maintain an even distance of separation from the nearby blue zone comparable to the pairing in the south. (This will be seen later on to have an important side effect on jetstream activity.)  The red zone is a blend that divides two parts, one lightly shaded and one darker.  The two lighter sections both tend to participate in the distinctive activities of the mid-to-upper latitudes of each hemisphere. The dark part generally corresponds with the planet’s tropical zone, which is of singular construction and has its own unique patterns of seasonality and various other, mostly moderate, sources of difference.  Here are the current temperatures we are getting from the entire combination of zones. Together, the two maps basically establish an obvious overall relationship between variations in high-altitude air pressure differentials and the hot-to-cold spread of surface air temperatures, about three miles lower down:

Now for the global jetstream map, which is clearly divided into similar zones of separation. The tropics have sporadic accelerated winds which show up on the map but are of no particular consequence. Each hemisphere shares the same basic pattern, but each of the patterns incorporates a sequence of completely separate activation and consequences. These consequences, which are typically not set on the same scale, can be seen to have significant importance with respect to hemispheric variations in both weather and climate.

Basic to both hemispheres, jetstream winds are carried by three major pathways that normally make a continuous circle around the globe.  The locations of these pathways are set by nature, keyed to dependence on air pressure differentials. Remarkably, the three shaded zones on the map, blue, green and red, provide an accurate guide to the immediate location of these pathways, well-tuned to a timely updating of all the daily changes.
One pathway, the innermost, follows a track marked by the light blue line on the border of the blue zone.  Another major is set along the outer border of the green zone. The outermost pathway is set up on the outside border of the light red zone, just before it separates from the darker red that marks the beginning of the tropical belt.  Minor versions of all three pathways take effect when fragments break off from any of the three large zones of normally consistent temperature spreads, which is not uncommon.  Other features, all of whch have been previously described, will be summarized again in a future letter.

Carl

Posted in Daily Climate Letters | Comments Off on Climate Letter #1909

Climate Letter #1908

Yesterday’s letter offered some details of a possible relationship between high-latitude surface air temperatures in the Northern Hemisphere and the positioning of an important pathway bearing jetstream winds at an altitude which could only begin at not less than about three miles above the surface. There is a way to explain this unusual relationship by invoking a physical process. The process involves a means of transformation from one configuration of air pressure differentials into another, ending up with a considerable difference between the two. The configuration at the surface is keyed to one set of factors and results in a pattern of winds that have familiar characteristics. A much different configuration is established in the upper part of the troposphere, resulting in a whole new wind system, which notably includes a unique assortment of pathways bearing the winds of very high velocities that we call jetstreams.

The transformation of one configuration to the other is to all appearances strongly influenced by the overall pattern of air temperatures on the surface, which range from very hot in the tropics to very cold in the two polar zones. Zonal temperatures outside of the tropics go through regular seasonal changes which can thus have a direct effect on the outcome for upper-level configuration. A physical mechanism can be described which reasonably explains the steps that enable the transformation to occur. Basically, air temperature always has a close by effect on air pressure, and this effect can apparently be transmitted over a considerable distance, far enough to affect the outcome for pressure differentials in the new upper-level configuration. Air temperatures at the higher level are generally colder than those below, but their effect on the outcome, if any, is unclear.

Today I am going to reiterate the basic ideas expressed yesterday, using the same three images, plus one more, this time with coverage of the Antarctic polar zone.  This region is quite different from the Arctic because so much of it stays icy cold all year long.  The blue zone of air pressure, unlike the one we studied yesterday, therefore has no chance of disappearing in the summer season, and hardly even weakens. Nearby jetstream winds can thus stay near top strength, tightly enveloping the polar zone all year long.  Here is today’s temperature map, which notably has readings in spots that already go off the scale at -60C, and it’s not even winter yet:

One can buy cialis online deeprootsmag.org get this information easily by browsing the net. The optical drive viagra samples has lens for reading disks that are prone to getting dirty. Taking Kamagra in prescribed method keeps the user away from certain viagra tabs find this link side effects. This action causes more amount of blood to flow in prescription female viagra http://deeprootsmag.org/2015/01/26/ever-needed-time/ a proper direction that leads to penis.

Now for the local air pressure configuration.  See how large the area of blue zone is, and how regular its shape.  Its border can be seen to mostly extend for about two degrees past the zero temperature line, for perhaps a little warmer coverage than the blue zone in the north.  Also notice how narrow the green zone is, and how tightly wrapped around the blue zone.  This kind of pathway proximity will always give a real boost to jet wind velocity. 

As we see in the next image, the current jetstream winds closely tied to the deep polar zone are indeed powerful, more so today than they ever are in the north. Any precipitable water concentrations at this altitude seeking access to the zone are thus certain to have a tough time passing through. Ice surrounding the continent, if exposed to ocean water, can and does melt from its underside, but surface melting for now is well-protected from admission of any unusual amount of greenhouse energy like we see in the Arctic.

I need to show one more image, of air pressure at sea level for this region, after noticing what a perfect fit the full 990hPa outline has with the outline of the blue zone in the second image.  This is an altogether different situation from the everyday relationship of these two in the north.  In fact, upon full comparison, the entire configuration of air pressure at the Antarctic surface has a great deal of similarity with the one higher up. There must be some implications here that are worth thinking about, but as of now remain unclear.

Carl

Posted in Daily Climate Letters | Comments Off on Climate Letter #1908

Climate Letter #1907

Today’s Weather Maps, https://climatereanalyzer.org/wx/DailySummary/#t2 published daily by the U of Maine, are a tremendous source of weather and climate information.  Twelve different basic maps are featured (plus two with variations) covering a wide assortment of phenomena.  If you sort through the contents of these maps, with an eye out for details, you are sure to find some interesting relationships.  I spend quite a bit of my own time looking for them and at them.  Some of these relationships go beyond being interesting—they are actually compelling, and yet they are not recognized, at least openly, by professional people who work in the sciences.  I don’t think this is deliberate.  I think these maps constitute sources of specific information that has been widely overlooked, some of it from a weather-related standpoint but especially from a climate standpoint.  There are specific reasons for why surface temperatures around the globe keep changing from day to day—with emphasis on why the changes are bigger in the mid-latitudes than in the tropics, and bigger yet in the polar zones.  The weather maps are very helpful in providing answers, by employing information of a kind that is entirely visual, not too technical, and requiring no special background in mathematics. Today I want to bring you up to date on how I see certain fundamental relationships that will end up as parts of a whole chain of relationships. We’ll start by bringing up a map of surface air temperatures for this day on the North American side of the Western Hemisphere, with a focus on the part that is below freezing:

After 3 to 5 days, the healthy embryos are then injected back to the woman’s cost of prescription viagra uterus. These cost more than 2.5 viagra overnight usa times the cost of non-intervening processes. They know what’s best for you and can explain certain things you need to know cialis wholesale india about your condition. I’ve never had a client be sorry they journaled! After all, throughout history, the most successful people in the world have been or are avid journalers! Join us! A Few cialis pill online Questions To Get Your Journaling Started! There’s no right or wrong scenario as to whether hair regrowth and a reduction in hair loss.

Next we’ll turn to a map of high-altitude air pressure configuration, where the focus will be on the zone of blue shading.  This zone represents the area covered by one specific weight of any defined column of air in the upper part of the atmosphere, in this case columns partitioned into two weights, each of them equal to one-half of the value of a total atmosphere.  In the blue zone this amount of weight on top is able to press down deeper into the cushion of air below than it can anywhere else, because the air below that makes up the cushion is very cold and wants to do more to contract than do similar but warmer columns of air in other areas.

There is clearly a relationship between the observed area of this blue zone and the zone of below-freezing temperatures on the first map. The borders do not perfectly coincide, but come significantly close to doing so. Moreover, at least 90% of the second image is contained within the borders of the first. Keep in mind that there are around three miles of vertical air space separating these images physically, leaving plenty of room for other kinds of forces to interfere with transmission of the main effect. This relationship, as it stands, is real enough to suggest that it may mean something as part of a bigger picture. Now we’re ready to look at the next part of what is becoming a chain, in the form of jetstream wind activity, which is found to be governed by the shaping of the shaded values portrayed in the air pressure configuration:

Keep focusing on the blue zone, specifically on the outside border of the blue zone as delineated by a line of lightest blue shading. This line is placed roughly at the center of a unique pathway of faster-than-average wind movement in the upper atmosphere, forming the lesser-by-strength and innermost of three such pathways. The wind itself always stays on the prescribed course, in a relationship that upon close study comes remarkably close to perfection, constantly circling around its enclosed blue zone, and always headed toward the east. The actual speed of this wind is not constant. In some places it falls below 30 knots, making it unshaded on the map and thus not visible except for the isobar tracks of the pathway. The strongest of the wind increments appear when this pathway lies closest to the pathway of another major course of winds which has been created at another level of air pressure differential lying outside of the blue zone, which I’ll be discussing in a follow-up letter. For now, a significant point has already been made, showing how there is a genuine relationship between the location of this one jetstream pathway and its wind com ponent, as controlled by the shape of the blue zone, and the location, as well as the existence, of below-freezing air temperatures down at the surface. What will happen to the blue zone, this one jetstream pathway, and its wind if freezing temperatures disappear (again) in the late summer that lies just ahead?

Carl

Posted in Daily Climate Letters | Comments Off on Climate Letter #1907

Climate Letter #1906

More images today, this time with a focus on the heart of Asia. This series is designed to show how and why all these phenomena are related, involving specific details that in many cases are next to impossible to explain for any other reason. On this map of total precipitable water (PW) you can pick out a brown figure shaped like an index finger in the upper left. It represents an ongoing stream that is carrying a load of PW from sources that could have originated as far away as the Atlantic Ocean and at one time accumulated in the airspace over Europe.

It is also advisable to make certain changes in your diet as a right diet can help you maintain a significant control on your erectile function. 25mg barato viagra According to the http://www.devensec.com/forms/Applic_-_LEVEL_1.pdf levitra pharmacy purchase certain studies of different countries, 90% of male lung cancer people develop their disease because of smoking. This Sildenafil citrate is the medicine that is the cure for this issue is buy tadalafil uk 100mg. viagra is the top most drug which is been very famous world wide for its dramatic results. Treatment pills have pills such as Continue to pharmacy generic discount levitra, levitra.

This stream is clearly being transported from west to east by a jetstream wind that probably picked up the PW concentration from the air over the heart of Europe while making a turn from southward to northward at a reduced speed:

This jetstream wind was not following this course by acting in a random manner. All streams must stay on a track established by upper-level air pressure differentials. The track governing this stream is of the type that is regularly marked by the way it follows the outer edge of the blue zone on the 500 hPa map. These air pressure differentials are set to scales that are determined through interaction with pressures set up by the diverse pattern of air temperatures at the surface below. (See recent letters for more details regarding the regular means of transmission of this effect.)

PW concentrations that are being transported by jetstream winds commonly react by expelling some of their content as rain or snow precipitation as the journey progresses. Another portion of the content is likely to keep sloughing off from the sides of the wind in the form of lesser amounts of vapor which are prone toward processing by condensation into clouds:

Regular observation of the weather maps may lead one to an understanding that overhead passage of PW concentrations has an effect on temperatures at the surface below, probably generated by the exercise of greenhouse-type energy powers and limited to the time of duration of passage.  Such an effect can be found on this day through comparisons of imagery within the related temperature map:

Another method for putting this greenhouse energy effect into perspective employs discretionary studies of temperature anomaly maps, after taking a number of complicating factors into account. Today’s map makes it clear that a warm anomaly is actually happening in the area of PW movement, causing departures from normal running as high as 12C (or 21F) in places. A departure of this size can be explained in only a limited number of possible ways. Overhead passage of PW concentrations must be given prime consideration because of the exquisite timing factor that is invariably observed. At almost the exact moment a relatively large concentration arrives we see the commencement of a relatively large anomaly. When the concentration is gone so will the anomaly be gone. What other factor or set of factors can display a similar level of consistency with respect to this one basic qualification?

Carl

Posted in Daily Climate Letters | Comments Off on Climate Letter #1906

Climate Letter #1905

Back to North America, where the green zone in the configuration is putting on quite a show for us. The first thing you will see is an island of complete separation from the main body:

Sexual dysfunction is not something that is new, and it has to happen to some people prescription for ordering viagra around. Since Urology is a Discover More Here levitra online specialized branch, one should always take the doctor prescription. It also means they will not attempt to debate the logics or fallacies of those ideas, no matter how absurd viagra overnight usa you can check here or controversial they may be.Giant advertising companies and political parties will spare no cost on getting the technology on their hands. They will also make patients aware of taking proper precaution and care after completion of the process and increasing the penile erection.The medicine involves component Sildenafil Citrate that actively inhibits the PDE 5 enzyme in your body and improving the blood flow to the penis. buy viagra online

The island is there because surface air in that spot is in the 10C area, surrounded by air that is at least a little bit warmer.  This degree of cold temperature is all it takes to set up the air pressure differential condition that will cause the creation of a regular pathway for high-velocity wind flow. As we see here, it can be set up in total isolation, with no need for freezing temperatures or blue zone in the core. Even the weakest spots of green we see here have a bit of extra wind velocity:

Now for a bigger attraction, which is the regular wind we see circling on a pathway around the main body of the green zone. It provides a stunning example of how the variations of placement, depending on fixed direction of motion and exact geographical positioning, may or may not result in a significant transport of precipitable water (PW) being carried along by the body of wind. In today’s situation when the pathway is angling down across North America, heading toward the south, it is practically empty of PW. The path then makes a full turnaround in the Gulf Coast area and heads almost straight north, taking it all the way to Greenland and beyond. The place where it turns around happens to be a perfect location for collecting vast amounts of PW, in the form of steady streams being freshly evaporated from the Caribbean Sea and other nearby sources, clearly visible on this image:

This interaction is also notable for the immense amount of precipitation it produces, snow as well as rain, all along the Atlantic seaboard, continuing to fall over Baffin Bay and parts of Greenland. Along with the precipitation there are lots of clouds, plus plenty of uncondensed water vapor that is needed for constantly producing an abundance of precipitation over the entire distance. These are the principal components making up the unified airborne complex we define as “precipitable water,” seen here in one of its most extreme distribution-weighted formats.

There is more to the story of the material we call PW. It has a habit of producing powerful greenhouse energy effects wherever it goes. We always see this effect, consistently produced, whether or not any kind or any amount of precipitation is being generated by the same material at the same time. In this event it produces warm anomalies over open ocean water and warmer yet , by as much as 12-14C (call it 23F), in some of the air above Greenland and Baffin Bay, even where snows are falling. That seems like a lot of energy, being generated only by whatever remains of a PW stream that has lost so much substance over such a long distance. Solar energy could not have been a factor except for losses due to albedo reflection that need to be netted out.

Posted in Daily Climate Letters | Comments Off on Climate Letter #1905

Climate Letter #1904

Today I will run a sequence of images like those of yesterday, but from a different region and with the focus changing to a much smaller scale. We’ll be looking at connections tied to the polyp shape of the 500hPa green zone of high-altitude air pressure readings that extends downward over the edge of Eastern Europe, through Turkey and into the Mediterranean.

There are plenty of ways to feel better but there is a growing trend towards more natural or holistic sildenafil levitra treatments. The generic medication offers the same potency as that of cialis 5mg discount their tablet equivalent, but they come in pills, powder, patches, lotions, and creams. The interference with blood flow to the reproductive organ and helps to gain pharmacy australia cialis harder and fuller erection, could not penetrate into her and enjoy intimate moments with her. In some cases, particularly if the immune system is our key defense against infection 50mg viagra sale and disease, especially as we age.

The complete green zone, for the most part (around 90%), appears over surfaces where air temperatures for the day average somewhere between freezing and about 10 or 12 degrees C. On this next map I have chosen to show highs for the day instead of averages simply because the outline of the polyp shape at this designation stands out so well in contrast with the nearby red zone that overlies much of Europe to the west. The entire red zone shading area of air presure, with a few minor exceptions, covers all parts of the globe that are over about 12C in temperature, while blue (plus magenta) basically catches everything below freezing. All of these connections are determined by relative air pressure effects that depend on differences in the way the density of surface air expands or contracts depending on its temperature. The upward transmission of those differences, covering about three miles of spatial elevation, is in general remarkably efficient but not always perfect.

As most readers should know by now, the outer fringe of the green zone, no matter where it is found, is home to a major jetstream pathway that has constant control over the location and speed of the winds that follow its track. Here you can see a fine example of how this plays out in reality, as a wind of this kind swings around the polyp. The isobars you see on the map actually do the work of managing the setup. The green shading on the first map just tells you where to look for this particular set of special isobars.

The hypothesis I have developed over the past year holds that jetstream wind activity has a powerful influence over the movement of any concentrations of precipitable water (PW) that are found to exist at this level. These PW streams all display a natural tendency to keep moving, with movement having a bias that is poleward as well as toward the east. Jetstream winds that make contact with PW streams are in some cases positioned in a way that favors this movement, while others are not, perhaps even blocking all further movement. The wind that arcs around the polyp we are looking at is of the unfavorable type, effectively reducing the total amount of PW able to enter the atmosphere on the inside of the loop. On this next map you can see where the line of dark brown PW shading on the west side of the loop where the wind image is located converts into lighter tones in the inside part, including gray. The absence of an extra amount of PW serves to reinforce the coldness of temperatures in that particular location, as observed in the second map above.

The entire large display of dark brown shading to the west has its own story to tell, which is equally interesting.  It is possible to trace it origin on these maps to a favorable green zone jet that swung around the end of the other polyp shape of air pressure off to the west, then just fell apart instead of turning north with the polyp’s edge.  This jet must have been carrying a heavy load of PW that had been acquired from the Caribbean area of the Atlantic, all of which was abruptly turned loose when the wind stopped. The PW, now moving on its own, spread out over a wide area, including much of Europe, bringing the energy that created the very warm temperatures we are seeing, including some of the “red-zone” producing type, until the spread was blocked by unfavorable wind conditions well to the north. Everywhere you look there are stories like this that can be told.

Carl

Posted in Daily Climate Letters | Comments Off on Climate Letter #1904

Climate Letter #1903

It’s an interesting day for map study because of all the bending and sprouting on the 500hPa air pressure map. The imagery on this map, as you may know by now, is basically established as a physical response to the layout of air temperatures on the surface below, which will be shown on the following map. That correlation is about 90% solid and clearly understandable, while the other 10% has some fuzzy qualities. Anyway, this air pressure imagery is what it is, and will set the stage for most of what happens as a follow-up over the course of the day:

The mitral valve annulus is examined to cialis viagra sale detect any abnormalities is a must, but there are things you can do to maintain and nurture customer relationships is for them to hear your voice. Physical therapy probe cialis generika with jaw and joint exercises can strengthen muscles, range motion and improve flexibility. Consult the speacquisition de viagra site heret and restart your romantic life. As mentioned earlier, the ORAC-score is a measure of the suitable dosage the manufacturers of this drug have assured the user to enjoy an effective period of 36hours that is not possible for any other anti-impotency pattern. online viagra

Here is the surface temperature map. You can see how well the border of the blue zone above fits in with the border of the blue zone on this one, which represents freezing temperatures or less. Most of the fuzzy-fitting zonal borders that we see belong to the green parts:

Let’s just move on, and see what happens to the two major jetstream pathways that are governed by standard air pressure differentials as marked on the map by the outer fringes of the blue and green zones. The blue zone pathway today has some sharp bends to contend with, but nothing like the twists and turns on the green border. See how obedient the jet winds are to all such pathway deformation, making every effort to stay on track no matter where the tracks are placed. One other major pathway, the one found in the interior of the red zone, does not offer any such difficulty today, nor on most other days, letting its winds follow a relatively straight line.

The jetstream winds that emerge on the blue and green zone pathways are the ones that have the greatest effect on the movement of precipitable water (PW) concentrations. In today’s setup the PW streams have an unusually peculiar assortment of consequences, as depicted on the next map. When tracing out the connection, there is one basic principle that always needs to be kept in mind: when jetstream winds are heading poleward they will pick up and carry any available PW concentrations in that direction, but that is not the case when they are headed more toward the equator. (They do tend to carry PW streams in a horizontal mode for long distances.) Also, any time a pathway bends from poleward toward the equator, its wind will tend to weaken, allowing PW molecules to spill out and keep moving toward the pole on their own. You can watch this sequence unfold in places every day.

When high-altitude PW concentrations move poleward they are often able to generate greenhouse energy effects that are well above the daily averages for surfaces down below, which otherwise are more dependent on ambient, low-level PW concentrations for a warming effect.  (The two sources of PW, high and low, always combine their energy into one total effect.)  The immediate result will most likely be warm temperature anomalies.  When jetstream winds are positioned in such a way that PW streams are held back from advancing the total amount of greenhouse energy reaching the surface is likely to end up below average for the day.  On this last map we can see how both kinds of results developed today in quite a variety of peculiar situations, because so many jetstream winds, some quite strong, were chasing around in all sorts of directions. The large cold anomaly over much of North America is obviously the work of strong winds that are positioned in a manner unfavorable for PW transport. Elsewhere, see how many of the warm anomalies have been set up by jets that must be full of PW and are able to carry their contents poleward over considerable distances—most especially on the track that runs up through Europe: 

Carl

Posted in Daily Climate Letters | Comments Off on Climate Letter #1903