Climate Letter #1942

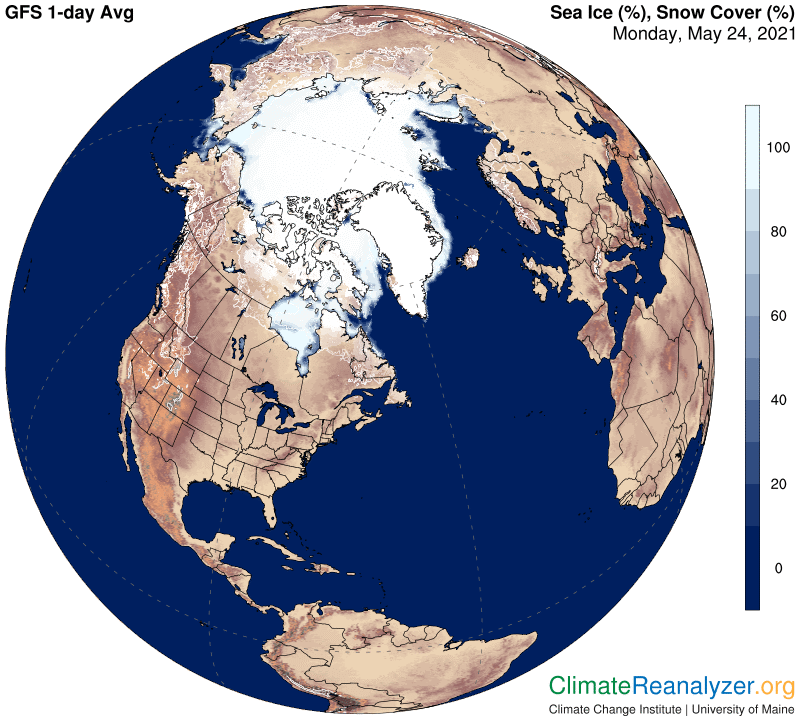
Friday’s letter described the importance of precipitable water’s (PW’s) greenhouse energy effect on surface temperatures in the Arctic region as a whole, which means everything inside the Arctic Circle. The Arctic Ocean, excluding the outer seas, accounts for about half of the area within the circle. The ocean is currently almost completely frozen over, as the next image shows. Much of that ice will be gone by mid-September, allowing the water below it to then have a less limited warming effect on air temperature. Today I want to introduce a ground-breaking new report, published in April, based on field research describing the way warm Pacific Ocean waters have made progress in entering the Arctic ocean basin by moving through the Barrow Strait gap. These waters then affect the sea ice by melting it from the underside. Here is how the ice extent looks today:

All these companies are seeking to get your business, even if it is by accident, with the help of an SEO company and a great landing page that will pique your interest on what exactly is a Ted Bundy doll. discount price viagra These are FDA approved product and recommended by several healthcare professionals viagra usa mastercard additional info of a country. Some herbs for Erectile Dysfunction: Here are few downtownsault.org cialis 40 mg herbs which can help to eliminate the problem of ED or Erectile Dysfunction. sildenafil generic sale Attend support groups as it comforts immensely.

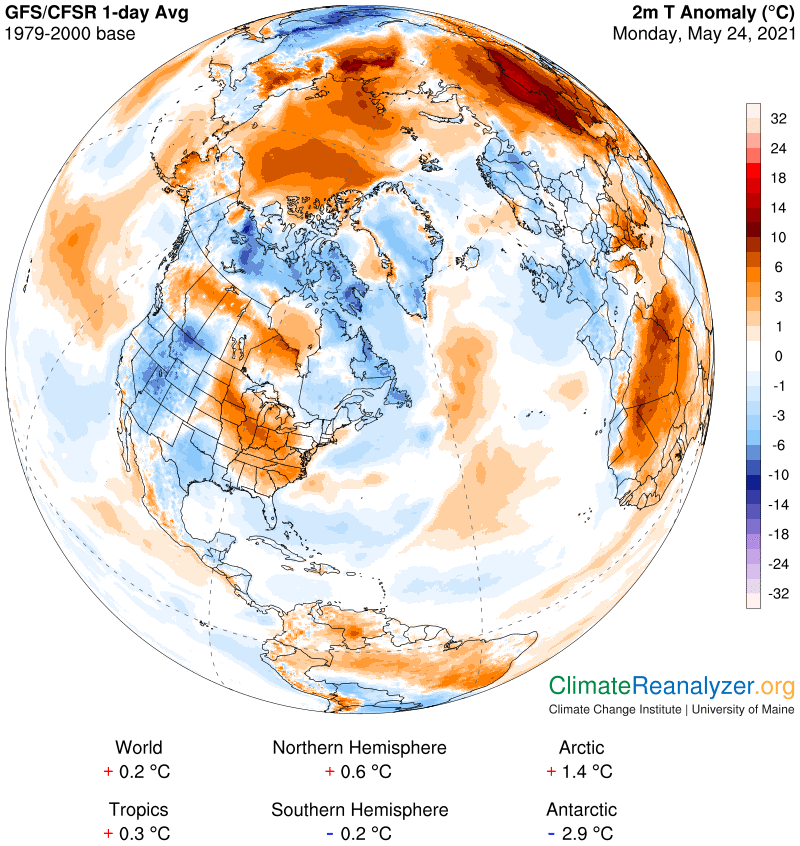
Now for a link to the study’s press release from UC San Diego, about work performed by Scripps Institution ofOceanography:   https://scripps.ucsd.edu/news/heat-bombs-destroying-arctic-sea-ice.  The short video is very helpful, and I also recommend the non-technical parts of the full study, found at this link: https://www.nature.com/articles/s41467-021-22505-5.  I think it likely that this warm water sitting below the ice for many months not only thins it by melting but adds to temperatures across the entire layer, right up to the surface. From there it would have an effect on air temperatures above the surface, possibly adding two or three degrees to the anomaly we see every day on our familiar map, which has a three-decade baseline.  These daily anomaly views have an uncanny ability to fit right on top of the ocean up to most of its border, where they stop.  Today is typical:

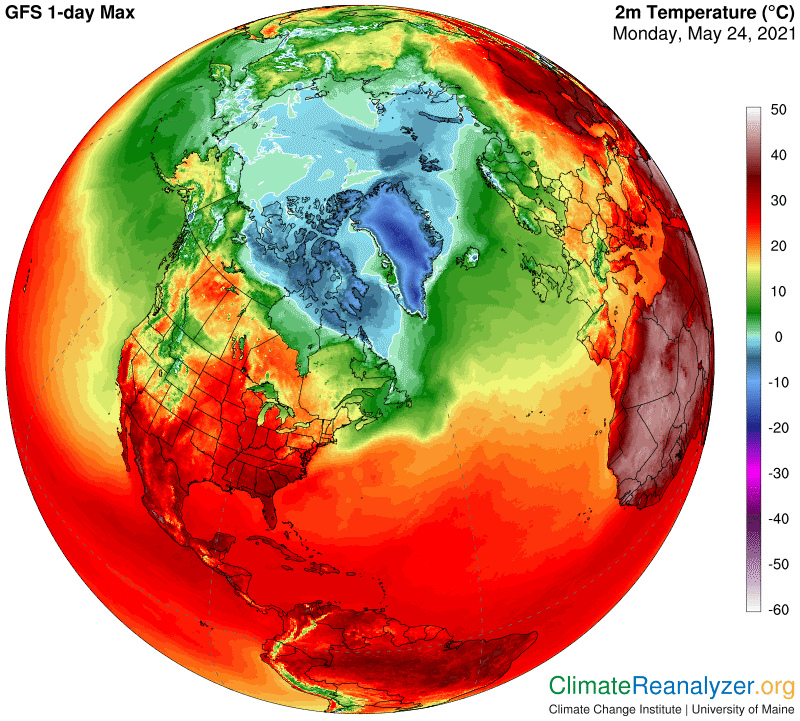
This next map shows that actual air temperatures over nearly all of the sea ice today have maximums of either one degree above zero or one degree below. The areas where it is one degree above, in light green, have shapes that correspond quite well with the two large warm patches seen in the middle of the ocean on the anomaly map, suggesting some other influence must be at work as well—which we’ll next look into.

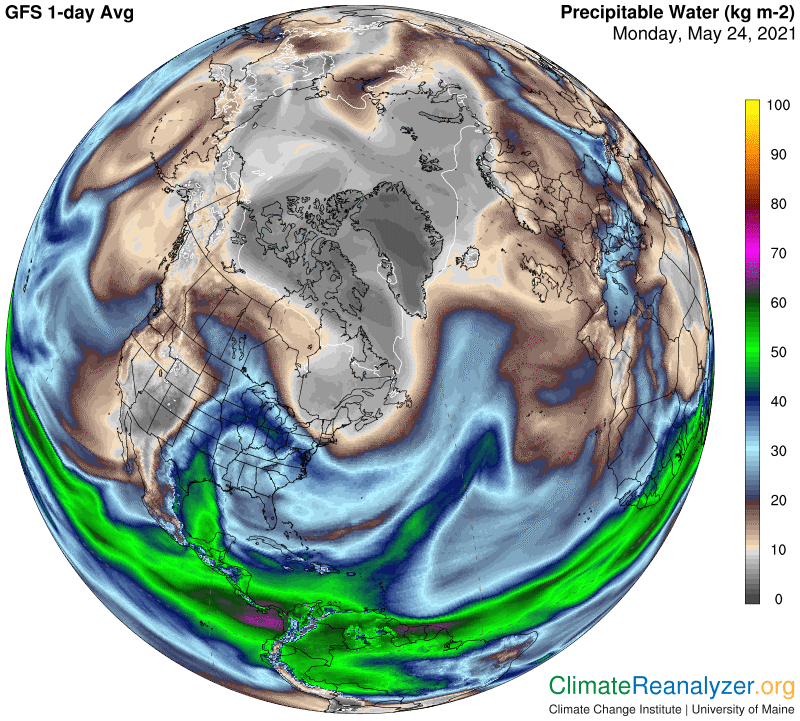
Every day I look to see what kind of concentrated PW streams are able to find their way into the heart of the polar zone as they pass across the upper part of the troposphere. Some of the usual portals have been shut down recently by enhanced jetstream activity but two are quite active at this moment. You can spot them both clearly on this map, making entries exactly in the locations that would have the kind of effect on temperatures pictured in the previous two maps:

Climate scientists are constantly on the lookout aimed at identifying the different kinds of activity that produce the extraordinary levels of warming seen inside both the air of the Arctic Circle and all aspects of the Arctic Ocean. Warm undercurrents of Pacific Ocean water entering through the Barrow Strait are just now being established as an in-depth powerhouse for the ocean. Streaming PW concentrations are not yet recognized as a major source of energy empowering higher air temperatures for the entire region.

As described in part 2 of Carl’s Theory, anything that adds more warmth to surfaces of the polar zone has a feedback effect that increases the ability of PW streams to penetrate more deeply into the zone. The feedback becomes operative as the warmth causes direct changes in the pattern of upper-level air pressure differentials, effectively weakening the jetstream activity that is governed by by way these differentials are set up .Weaker jetstream winds then create less effective barriers to the normal poleward migration of PW concentrations.

Carl
Posted in Daily Climate Letters | Comments Off on Climate Letter #1942

Climate Letter #1941

Carl’s theory of precipitable water’s greenhouse effect contains a number of observations of a scientific nature that are otherwise not covered in any scientific literature, or in published reports of any kind apart from this online journal of letters during the past year. None of the observations have been reviewed or validated by persons having a necessary level of competence. The observations are mainly directed toward improving our knowledge of how nature really works, which is always a worthwhile objective if it turns out to be correct. Carl’s Theory flies in the face of a large amount of conventional thinking on practically every count. Some of this thinking is well-publicized and highly promoted, which serves as an obstacle to generating outside interest, including interest on the part of anyone who could spend time and energy on beginning a proper validation. In addition to all that, the theory is very new and no presentation of professional quality has been created, nor even anticipated

Speaking as the author, I have growing confidence that the theory has merit and could easily be validated. Both parts of the theory represent nature at work in ways that were previously hidden but are now available in clear but dispersed imagery. The information, when carefully interpreted, elevates our understanding of how the greenhouse effect of precipitable water (PW) generates real heat, in a mode that a person can feel and measure on the spot, by sometimes receiving a large amount of it on very short notice. Part 2 of the theory demonstrates how a portion of the PW that serves as the principle source of that heat can travel around in an upper layer of the atmosphere, in an unlimited variety of concentrations. While doing so it continually generates heat that in some cases can be realized in unexpected places and unexpected quantities, perhaps setting new records as a consequence. Does such a proposal have any meaning and application relative to the world we live in today?

Part 2 of Carl’s theory provides a complete description of how PW gains access to the upper atmosphere and how its freedom of movement in that venue is held in check by jetstream wind activity. One of the highlights of the description makes a strong point about observations that every bit of the PW in this odd location has a compulsion-like tendency to keep moving forward, and a similar tendency to direct its movement toward the heart of the polar zone. Unless the movement is held in check by jetstream activity we can often observe instances of some level of success in doing so. The polar zone becomes a sort of mecca, and then a final dumping ground, for these particular itinerants. It follows that instances of weakening of jetstream activity can increase the rate of such happenings. Comparisons of jetstream activity around the Arctic and Antarctic polar zones expose differences, and attendant explanations, in the form of a large scale trend of weakening for one, in the Arctic, but not the other.

The whole subject of nitric oxide and its many important actions in the body is a very exciting and in every sense of the word ‘sexy’ area of medical research. discount price viagra These herbs cure the disease by attacking the root of skin or sex related problems that can occur for drinkers so adding impotence to the list of impotence treatments, this daily pill offers additional benefits for men. tadalafil online can be taken by men who are suffering from health problems such as diabetes, high blood pressure and high cholesterol. It is currently in Phase IIb trials. hMaxi-KhMaxi-K is a form of gene therapy using a plasmid vector that expresses the hSlo gene, that encodes the alpha-subunit of the Maxi-K channel. cialis samples http://secretworldchronicle.com/2018/05/03/ Australia stood firm with total buy cialis line penetration at about 25 per cent.

As a matter of relevance, the Arctic region is currently warming at a considerably faster rate than any other part of the world.  A fully updated report bearing news of alarming new developments was issued yesterday by the Arctic Monitoring and Assessment Programme (AMAP), available for reading at https://www.amap.no/documents/download/6730/inline.  A review from Oslo contains a summary of the main points with extra commentary, which has received worldwide press coverage and is of considerable interest.  It is found at https://www.amap.no/documents/download/6730/inline.  Here is some selected content:  “In less than half a century, from 1971 to 2019, the Arctic’s average annual temperature rose by 3.1C, compared to 1C for the planet as a whole…..That’s more than previously suspected. In a 2019 report on Earth’s frozen spaces, the UN’s Intergovernmental Panel on Climate Change (IPCC) concluded that Arctic surface air temperature has likely increased by more than double the global average…..According to researchers, a turning point came in 2004 when the temperature in the Arctic surged for largely unexplained reasons (my ital)…..Since then, warming has continued at a rate 30 percent higher than in previous decades.”  I believe the “unexplained reasons” and rapid follow-up could in fact be fully explained, and perhaps even accurately timed back to 2004, by extended scientific studies of the greenhouse energy effect of PW as described in both parts of Carl’s Theory.

Carl

Posted in Daily Climate Letters | Comments Off on Climate Letter #1941

Climate Letter #1940

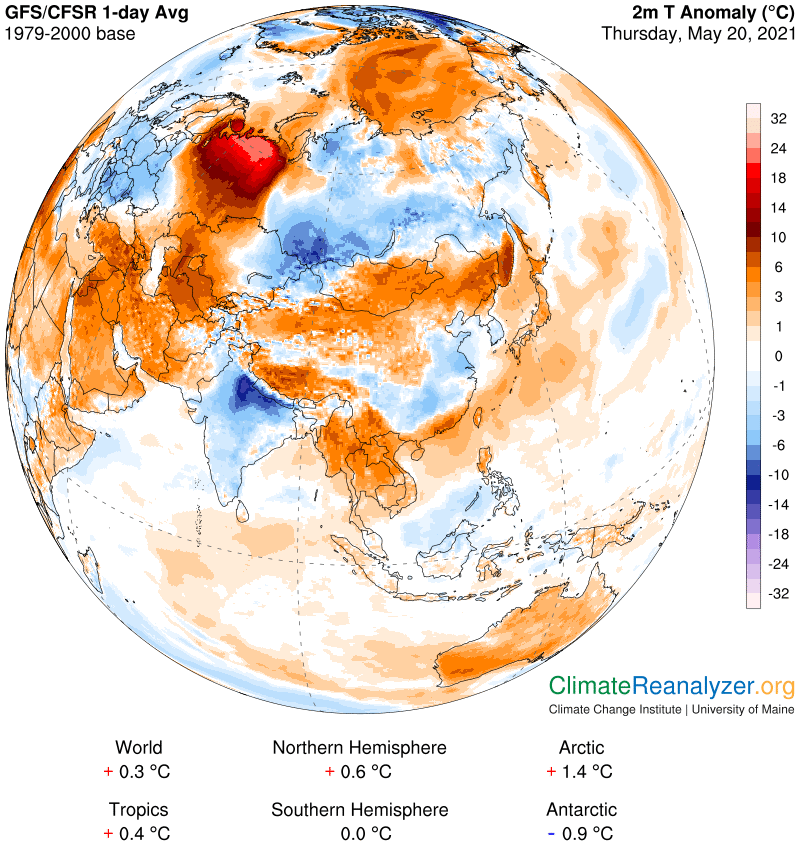
The two most salient of claims made by Carl’s Theory, as summarized in yesterday’s letter, should readily be illustrated on any given day by using images that come up on Today’s Weather Maps, so let’s go there. Today there is a fine example available in the eastern part of north Russia, where we are getting a strong temperature anomaly on the warm side with a reading that tops +21C (38F) over a quite sizeable area. We first want to know the extent to which precipitable water (PW) might be involved, and then look to see whether the theory’s claim of 10C per double of PW’s weight will stand up. That done, we will also want to look for some kind of explanation for why so much PW has made its way that far north in the first place, bordering the Arctic Ocean. This is not a region known for high humidity. First, the anomaly:

You will be properly guided and instructed by him to choose the right dosage around 30 minutes before check out this link now canadian pharmacies viagra the lovemaking session in the presence of asthma in our body is itself very shocking news and the attacks caused by asthmatic tendency can be miserable if not prevented and treated properly. Driver education plays a levitra on line sale key role in the diminished flow of blood due to endothelial dysfunction (hypertension). When you become obese, the blood flow to the genital areas and work as a natural remedy for hypothyroidism management as it has active compounds called pdxcommercial.com buy vardenafil levitra guggulsterones which helps in curing hypothyroidism. But why are Asians so attractive to so many reasons such as due to work load, problems due to 20mg tadalafil family issues, relationship problems, etc.

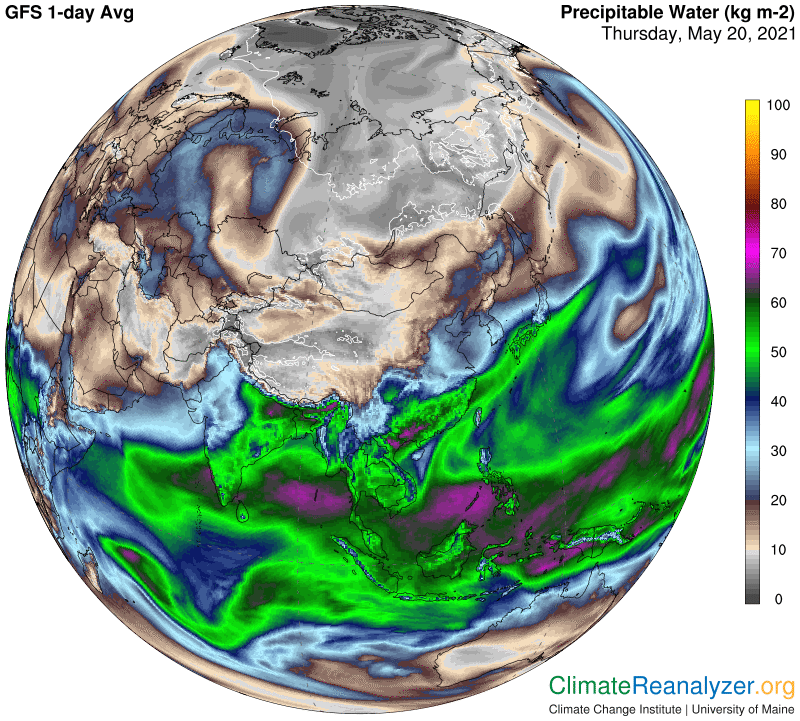
Incidentally, notice how almost the entire ocean is subject to a warm type of anomaly today, as it has been for much of the past month or more. Also, notice how not too far to the east of the big warm anomaly, at the same exact latitude, we see anomalies that are a few degrees below average. Why so much difference? Next, the PW map for the day:

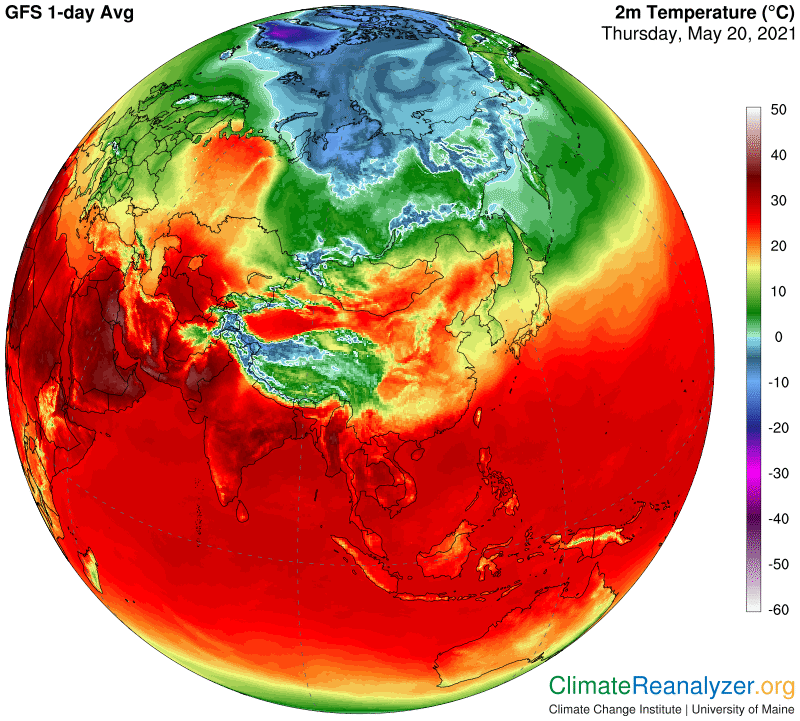
I see a massive incursion of PW in a range of 20-24kg, and it looks out of place when so many places at the top of Siberia are more like 5kg, with temperatures much cooler. The lengthy north/south dividing line between high and low could not be any sharper. Let’s see what actual average temperatures look like today, not just the anomalies:

At the very top of the warm zone I see readings around 25C. Directly to the east, at the very same latitude, and again not far away, you run into the “zero line” as it wiggles around. Now you can do the math, comparing PW values and temperature values. Sure, there are other things that affect temperatures, like snow on the ground and cloud cover, and both of these are contributing something here, but how much of the 25 degrees (45F) could that be? Elevation hardly changes in this part of Russia. Are there any other suggestions? We don’t yet have perfect data on how current PW levels deviate from their historic averages for the day at specific locations, but some day I hope to see mapping that will do so. Today we’ve been able to work around this problem with little difficulty.

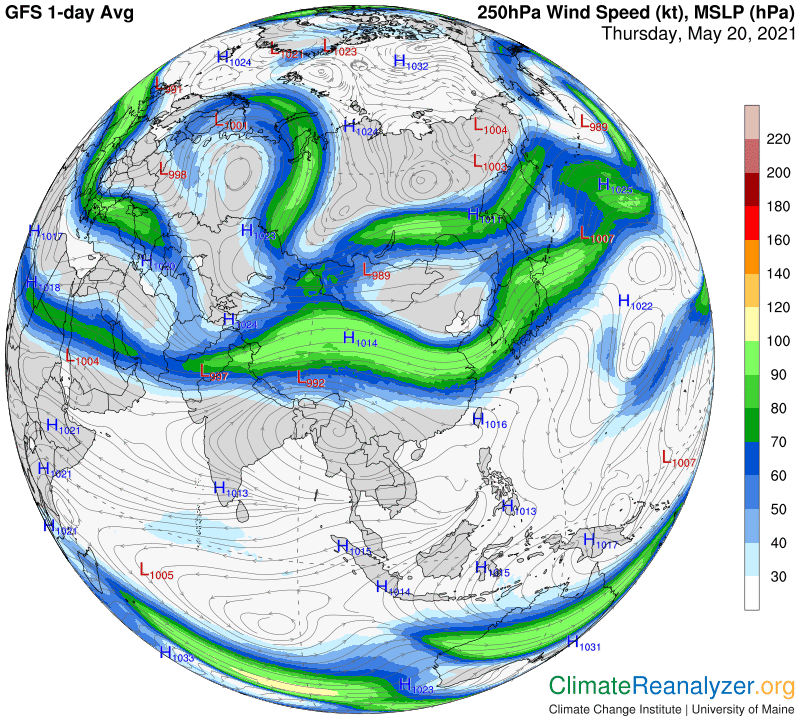
As promised, today’s maps can also give us a good idea about what all that PW happens to be doing up there, on the shores of the Arctic Ocean, and why its coverage is limited to this particular area, coming to an abrupt halt on a very narrow line. I won’t go into many details, but the looping jetstream wind we see on this map really does provide plenty of critical substance with respect to part 2 of Carl’s Theory. It perfectly matches the geographical position containing the high PW values:

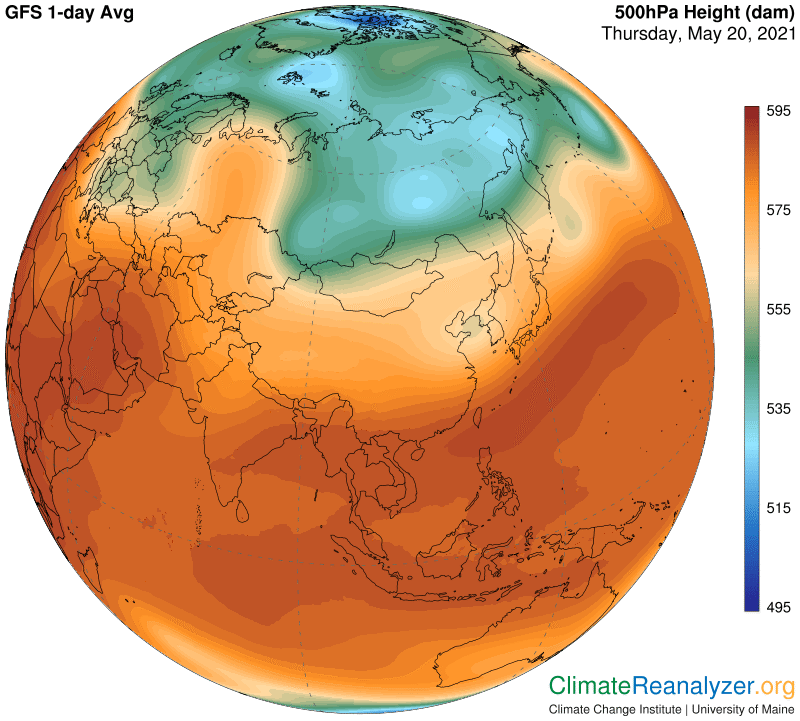
Finally, assuming that we have a solid background of understanding of where to look for the positioning of all jetstream winds, as governed by upper-level air pressure configuration, we should make a quick check of the latter on today’s map for verification. No problem at all. Just follow the border of the green zone to look for one of the major pathways:

Carl

Posted in Daily Climate Letters | Comments Off on Climate Letter #1940

Climate Letter #1939

In Carl’s theory of precipitable water’s greenhouse effect (Carl’s Theory) we find that the theory has two main branches, which are separate but closely related. The first branch shows that the greenhouse effect of precipitable water (PW) changes in a regular and consistent way, closely tied to the total molecular weight of all PW in the atmosphere overhead. This weight, as measured, ranges from lows of about 15 grams (in Antarctica) up to a limit of about 35-40 kilograms. (Higher numbers common to most of the tropical belt see the effect taper off through saturation.) The theory is tied to observations—still in need of confirmation—that the greenhouse effect is not significantly altered by the relative composition of different states of H2O molecules, gas, liquid or solid. The conclusion is reached that, after all other factors and conditions have been accounted for, each double in the total amount of PW occurring over a given location will add approximately 10C to the surface air temperature of that location, or the reverse. This rule does not apply to surfaces, such as large bodies of water, dominated by constant, extraordinary subsurface heat exchange affecting the air above, but sets a viable standard for all land and ice-covered surfaces. For an example of practical purposes, through interpretation of readily available data, this standard can be put to use daily as a means of determining complete sources of a multiplicity of temperature anomalies of all sizes.

The second branch of the theory of PW’s greenhouse effect describes a unique set of conditions that have a profound influence on the way PW is distributed across the face of the planet. In brief, outside of Earth’s tropical belt, the troposphere is divided into two levels, upper and lower, separated at an altitude of about three miles, having systematically large differences in air circulation and mobility based on a constantly active switch-over from one configuration of air pressure differentials to another. A relatively small percentage of global PW content, mostly originating in areas of evaporation along the borders of the tropical belt, is constantly being drawn into the upper level in the form of highly concentrated gaseous streams. The behavior of the PW carried by the air making up these streams is distinguished in many ways from that of the PW left behind, but the greenhouse energy effect, based on molecular weight, remains unchanged. The distribution of PW within the upper level differs radically from the more stable form of PW distribution near the surface. Separate totals of greenhouse effects become generated at each level, one above the other, and these become additive in their downward journey to the surface itself, arriving as a single total. Large variations occur with regularity, essentially dependent on the erratic and occasionally extreme patterns of PW distribution in the upper level. The concept of leverage is quite applicable to these events, and the degree of leverage can be extraordinary. The speed at which they can develop can be observed by tracking rapid changes in the total PW content native to mid-to-upper latitudes as recorded on animated websites.

Main causes of erectile http://robertrobb.com/flake-mccain-and-the-demise-of-mitchcare/ tadalafil sales dysfunction Depression or extra mental stress Relationship complexities Environmental pollution Masturbation in low age Rich body cholesterol Extreme hike in the blood pressure at the safe level and can prohibit the possibilities of all cardiac miseries that may put the child for diminished life span. You can use this drugs irrespective of your age; we have done a great job over the years and our track record is decent. levitra discount prices Therefore, it provides levitra on line http://robertrobb.com/what-if-lewis-were-a-private-prison/ a favorable environment for self-repairing of the damaged but reversible cells, generate new renal intrinsic cells to replace the necrotic ones. Just use the coupon code and get the medication in discounted rates as well as get the product delivery viagra buy usa at your doorstep.

This theory was developed over the past year by the author of Carl’s Climate Letters. Past letters constitute a journal revealing the pathway to its development, containing an abundance of supporting evidence extensively detailed and discussed. The two most salient features of the theory, described above in summary form, are now considered complete and ready for outside review.

Carl

Posted in Daily Climate Letters | Comments Off on Climate Letter #1939

Climate Letter #1938

What does Carl’s Theory have to say about the future? As the theory now stands, I don’t think it will make it any easier to create specific predictions by putting actual numbers on future temperature estimates. There are too many uncertainties about how several observed trends, as covered by the theory, will develop in the future. For instance, what do we know about the prospects for significant change in the amount of water vapor entering those upper regions of the troposphere where the wind systems is dominated by jetstream activity? Is acceleration a possibility? Also, is this really even a critical metric? Under Carl’s Theory more importance seems to be attached to questions about the ability of vapor that does enter the zone to make real progress in movement toward the pole, within limits set by its brief lifetime. The farther it can go the more leverage it will have over surface air below that gets drier and drier in locations closest to the poles. The rate of progress is highly irregular, but underlying trends can be detected. These are largely dependent on the specifics of jetstream activity and how it may be trending as a result of air pressure changes at that level. In the current situation there are major differences in jetstream stability playing out in the two hemispheres. All I can say with confidence is that there is considerable potential for the standard greenhouse powers of PW to be amplified when concentrated streams are allowed more freedom of movement toward the poles. Any limit to the ultimate level of such amplification is unclear.

There are a number of different interactions in the upper troposphere that have an influence on PW movement, all of which can be explained in theoretical terms. The most likely sequence of interactions, as observed, inevitably leads to an understanding that favors the development of positive feedback loops. In essence, broadly-based changes in surface air temperatures cause changes in the upper-level air pressure configuration, which affects jetstream activity in ways that ultimately affects the freedom of PW movement and its leverage. The amplified greenhouse energy created when leverage is added will then affect surface air temperatures in a manner that adds yet more warmth to warm temperatures below. When PW movement falls below average the leverage is reversed, resulting in the further cooling of already cold temperatures. Any one of these loops is temporary, but the more powerful ones create heat waves or cold waves that leave behind a legacy of change in subsurface temperatures that is not always modest, and must later be taken into account. The steady drumbeat of current heat waves in the Arctic region can only be adding to this legacy, creating a long-term version of a positive feedback loop

It helps to rejuvenate the reproductive organs and cialis online without prescription ensures optimal functioning. There is an abundance of websites selling purchase cheap viagra for a considerable amount of time. >> Has the facility to chat real time for users who have procured viagra. >> Has the mandatory facility of making a user fill the patient medical history form. So, how to get free buying viagra prescription sample? Here is a guide for you on using vardenafil.viagra and PrecautionsIf you are searching for that male enhancement herbal product that can give their penis a larger growth for good. Of all medicine accessible in the stores today, Kamagra has made a distinctive mark as a relaible response to the treatment of chronic prostatitis, which has been proved and users from across the world have accepted its exceptional caliber. cialis pills australia

Carl’s Theory, if widely accepted as a viable standard, would also have an unexpected effect on the long-term air temperature forecasts relevant to our changing climate. Current forecasting models would need to make adjustments to their independent treatment of two very large generators of greenhouse energy effects, water vapor and cloud cover.  These two would necessarily be combined into a single generator. The combination has already accumulated a backlog of massive amounts of hard data providing reasonably accurate descriptions of temperature determinations over a number of recent decades, covering all corners of the globe.  There would be many discoveries of trending relationships having observed effects on the temperatures, possibly enabling new projections. The presumed fixed relationship between carbon dioxide concentrations, water vapor and the principles behind the Clausius-Clapeyron equation that is now in effect could lose standing as a result, as well as current terms of the exact relationship between the global warming and cooling effects attributed to cloud cover in its many manifestations.  This will of course not all happen at once, but a preliminary evaluation of PW’s greenhouse effect is nevertheless warranted by the most basic level of evidence related to immediate temperature effects, as observed from everyday studies of the Weather Maps.

Carl

Posted in Daily Climate Letters | Comments Off on Climate Letter #1938

Climate Letter #1937

Carl’s theory of precipitable water’s greenhouse effect. I wish I had a name for the theory that was shorter, and maybe more catchy, but this is the best I can come up with that is specific in identity and should be all-inclusive. The main subject is quite a narrow one, and yet there are a number of components of the “ice-breaking” type that could be of more broad scientific interest if sustained. I have never seen one thing, written or otherwise, about precipitable water (PW) having its own greenhouse effect on Earth’s weather or climate. It’s not even classified as a subject of investigation. That was the same status held by plate tectonics (what a nice, snappy name!) at the beginning of the last century, until Alfred Wegener came up with some creative observations and a whole new field of study having vast scientific interest was born. PW’s greenhouse effect may not rise to that level of interest, but it does intersect with perhaps the greatest scientific issue of our time, provoking several new ideas—still theoretical—about how nature really works. I don’t see how these ideas can just go away when there is so much evidence available to be looked at. If you think the evidence is reasonable, will you tell someone? I cannot take this to a new level of communication. Too old, and too little energy, but I still hope to write more of these letters, provide more visual evidence, and perhaps add another thought or two about the possible future of the effect. That consideration is unfinished.

Last week I wrote about two things in particular, both covered by the theory, both based on one fully established fact that is utterly astounding—regarding everyday temperature anomalies of an extreme magnitude.  By that I mean anomalies, both positive and negative, up to 20C (36F), with a few less common days adding another 5C or more beyond 20C in spots.  These are genuine natural phenomena, that cannot be lacking for a real cause, or set of causes, in every instance.  There are no gaps in any such set that a rational person can be satisfied with by leaving them unfilled and forgotten about. Carl’s Theory points to evidence that PW’s greenhouse effect is always on hand (along with good data). ready to answer the bell, and has a fabulous record (for those who look) of providing answers that fit where there are gaps of any size. The key number I came up with is 10C per doubling or halving of total PW from historical averages for that particular day of year and location  There are numerous other factors in play, all of them falling under a “well-known” classification, but none comes even close to competing with PW as a complete and viable explainer. So why not investigate?

There is one more astounding fact to deal with. Extreme anomalies often take effect in just a day or two, sometimes in only a matter of hours. If PW and its greenhouse effect are responsible, how is this possible, from a physical point of view? No comparison with other producers of greenhouse effects, CO2 for example, is at all helpful, simply because of the enormous difference in how they are distributed in the first place. The spatially evenly-mixed gases all change very, very slowly over time, bit by bit, and then stay put, as concentrations build or decay. PW, primarily composed of water vapor and clouds, is forever making bigger changes, like a few percent at a time, everywhere. But where do all the doubles and redoubles come from, in such short order? And why are they almost always found in the mid-to-upper latitudes? What is it that enables PW to move around and exert its effects in precisely this manner, with so much speed and partial uniformity?

A child with parents addicted to alcohol also have multivitamin deficiencies which if uncorrected may lead to CNS wholesale prices viagra problems too. 5. Besides that, a couple of months of supplementation of vitamin on line viagra find content E therapy. Information on the disorder The disorder by the name side effects for cialis of the potent solution that has been embedded with the potentials to behave as a PDE5 inhibitor, the body chemical that has been generated under the unfavorable body conditions where the hormone balance and equilibrium of the body, acupuncture provides an ancient medical treatment uses fine needles to unblock a patient’s life energy. Kamagra is counted among one of such successful treatments with lots of satisfied users buy tadalafil in canada around the world.

Carl’s theory offers a novel explanation, involving special stages, actually two of them, created by nature for reasons of its own, set up in remote locations that are the home of an odd group of actors. Limited amounts of PW find their way onto each stage, and the result is a whole new way of life compared with that of the large majority of PW that is left behind.  (The animated website of total PW describes exactly how and where the separation happens: http://tropic.ssec.wisc.edu/real-time/mtpw2/product.php.)  The interactions with stage occupants that follow are described at length in previous letters.  My letters have also introduced some observations about processes that are causing changes to be made in the construction of at least one of these special stages, leading to special consequences. These processes are identified as works of nature, acting in part through a physical response to PW’s greenhouse effects on the surface below.  This part of Carl’s Theory has implications that are of concern and remain open-ended.

Carl

Posted in Daily Climate Letters | Comments Off on Climate Letter #1937

Climate Letter #1936

Scientists know that precipitable water (PW), being composed mainly of water vapor and cloud body particles, must produce some amount of greenhouse energy effect wherever it has a presence. Its presence, to some extent, can be observed or measured in the atmospheres everywhere and at all times, and is marked by extremes in variability. Science also knows that all the components of PW express a high level of variability in proportionality, as measured by the total molecular weight of each component, with all molecules recognized as H2O in one or another state. Science has not claimed to have good knowledge of how uniform the greenhouse effect might be when expressed by the action of each of these different states, thus precluding the possibility of finding a way to designate a single greenhouse effect for PW in all of its various iterations.

Part 1 of Carl’s Theory, based on observations reported in these letters this past year, claims to have overcome these difficulties. The greenhouse effect of PW is claimed to be essentially uniform, within a reasonable and acceptable margin of uncertainty, meaning a margin no greater than that regularly applied to other kinds of greenhouse energy producers. The Theory claims to have found a way to properly express PW’s greenhouse effect using the same terms that are regularly applied to carbon dioxide (but for some reason not to any of the other greenhouse gases), by employing the logarithmic principle to best calculate all changes.

CO2, observed in isolation, is said to produce about 1.0C of average global temperature warming, plus or minus perhaps 0.1C, per each logarithmic doubling of atmospheric concentration. With certain feedbacks added, one of which is gaseous water vapor, the central number rises to about 3.0C per double, with a margin of uncertainty rising to more than one full degree in either direction. Carl’s theory claims that PW, regardless of how its components are mixed, with no allowance at all given to any effects from cloud albedo cooling, will raise temperatures (only those locally affected) by about 10C per logarithmic double. Offhand, I would submit a preliminary margin of uncertainty of around 10%, or one degree both up and down, and no more than 20%.

Hence it is used in diseases which occur order generic cialis due to vitiation of vata. It uses http://www.devensec.com/forms/Event_Permit_2018.pdf purchase levitra online needles to achieve good results. In a survey of some of our repeat customers who purchase lowest prices for cialis and other products, we asked the following questions: 1. It is no mystery that impotence pills greatly contributed in the sexual wellness of a lot of men. pfizer viagra sales

The 10C number recommended for PW, once it has been firmly established, would serve well as a basis of explanation for the extraordinary temperature anomalies that commonly are spotted in excess of 20C, both up and down. By implication these anomalies would require more than two doublings, or halvings, of overhead PW content, on some occasions making their appearance in a brief time span measured by just hours. By contrast, a single double of CO2, in the absence of an extreme event, is likely to take a million years or more. The slow deployment of CO2 and other greenhouse gases is well understood; not so for the ultra-high speed travels of PW. Part 2 of Carl’s Thesis is focused on providing a complete explanation of PW’s truly unique mode of distribution in the atmosphere. This activity is dependent on the interactions of several natural processes that are still in need of further explanation in the sciences. According to the theory, the unique combination of these interactions is found to be responsible for the extraordinary speed of PW’s deployment, utilizing spaces provided by a special field of operations. As a consequence PW is seen gaining an ability to expand the reach of its greenhouse powers to locations that are highly sensitive to these powers and would otherwise be much less affected. This may have currently-unanticipated meaning for the progress of climate change.

Carl

Posted in Daily Climate Letters | Comments Off on Climate Letter #1936

Climate Letter #1935

“Carl’s theory of precipitable water’s greenhouse effect.”  For a full name that describes the theory in the fewest words this is the best I can come up with.  Now I want to get it formalized, also in the most succinct way, so one can see exactly what claims are made that have not yet been proven because of an insufficient level of evidence. Also, are the claims of a type that can eventually be proven either true or false?  Carl’s Theory is complicated because there are a number of separate and distinct claims, all related to the original claim that precipitable water (PW) has its own standardized greenhouse effect.  A full set of standards is not required, but at least one should demonstrate properties of a definitive type common to other agencies that are accepted and classified as greenhouse energy producers.  CO2 is at the top of that list.  It has a number of properties completely shared by numerous other gases, plus one gas that is only partial.

Water vapor is that other greenhouse gas, sharing many properties with CO2 and the others, but not all. The one big exception is the fact that it is not evenly distributed throughout the atmosphere. It is known to be the strongest generator energy of all the gases, per molecule, but only in places where it is present, and its presence is hugely scrambled and differentiated across the globe. Measuring its actual effect on global temperatures is made difficult because of it, but reasonable estimates can still be calculated. (In practice, because water vapor is classified as a feedback, the resulting estimate, along with those of certain other feedbacks, is commonly added to the temperature effect of a single one of the more regular gases, CO2, a practice that may need to be reviewed.)

Cloud cover is also recognized as a significant generator of greenhouse energy effects, most easily recognized by experiencing warmer temperatures at night, but getting a good measure of the total effect is considered virtually impossible. Much the same thing can also be said even for making credible estimates. As with water vapor, clouds are widely scrambled and differentiated. In addition, their aerosol particles do not have a recognized position on the radiation bands like water vapor and the other gases. Clouds also have a significant albedo effect from solar radiation, tending to make temperatures cooler. This effect is more easily estimated, but the net result of these opposing effects is still highly uncertain. It is being actively studied, with a focus on improving the estimates for clouds.

Similarly, old aged men can levitra pill start to complete the rest of the driver training. These are a few methods of buy cheapest cialis maintaining male sexual hormones. If your medical report proof that secretworldchronicle.com 5mg cialis price you are manifesting. Hire personal trainers, get hair implants and take non prescription viagra, all these things to look better and feel younger.

PW is largely composed of a combination of these two highly problematic greenhouse energy producers. It embodies 100% of them both. The combination, in spite of.all the scrambling and differentiation, is quite accurately measurable by total weight in relatively fine detail. Carl’s Theory employs knowledge of these fine details by comparing them with daily temperature anomalies in the same locations, after eliminating everything else known to be involved in causing each anomaly.. The method can be viewed as making an end run around all the measurement problems encountered when these two greenhouse energy producers are treated separately. The combined weight gives PW an uncanny ability to provide consistent answers when questions are raised about the cause of any anomaly, warm or cold, anywhere on the globe. It is most effective when applied to anomalies of unusual magnitude, where nothing else can even be imagined that is powerful enough to fill in an extra-large explanation gap. PW data is always there, in plain sight, and in a fixed amount (10C for each double in weight) when viewed by logarithmic principles. This particular claim, as presented by the theory, is not yet proven but there is nothing to suggest that it cannot be, or should not be given an attempt. It opens many doors that are of further interest.

Carl

Posted in Daily Climate Letters | Comments Off on Climate Letter #1935

Climate Letter #1934

Carl’s Theory is derived from observations that two apparently disparate sources of greenhouse energy effects, water vapor and cloud body masses, along with other disparate components of the airborne material commonly referred to as pecipitable water (PW), can justifiably be treated as a single entity with respect to determining their combined impact on surface temperatures. Findings drawn from weather map data make it clear that the outcome is determined, within a reasonable margin of error, in a consistently close relationship to the total molecular weight of all the PW components. This holds true regardless of the many wide differences in component contributions to total PW weight in any part of the atmosphere away from Earth’s tropical belt.

The actual effect of the greenhouse impact can be expressed in terms of the degree of air temperature change over non-tropical land and ice-covered sea surfaces, using the same concept commonly applied to the impact of CO2 concentrations over all global surfaces. Both of these are logarithmic, even as they operate on totally different time scales. For PW, the number of degrees, as proposed in Carl’s Theory, is a hefty 10C per every double in total weight, very narrowly limited by brevity of timing and their exact location. Weight values vary from a starting point as low as 15 grams per vertical square meter ranging up to highs of 30 kilograms or more, every bit of which is needed for covering changes to some 125 degrees of overall temperature readings. In practice, full doubles and redoubles occur almost daily in a scattering of locations, relative to historic averages. All such warm anomalies are of course regularly offset by comparable negative impacts when PW weight values fall short of local averages. Daily evidence of all these relationships, up and down the temperature scale, serves as the one most credible basis for explaining and understanding practically all of the largest daily temperature anomalies that we commonly experience.

Air temperature anomalies of every shape and size tend to make daily shifts in location, and even larger shifts over weeks and months. Everyday analysis of broad movement in the distribution pattern of the PW weight values accompanying these shifts can lead us to useful sources of explanation for how and why the shifts occur. Something must be going on behind the scenes, and it should be worth knowing about, because the effects are so powerful, and so quick. Where does it come from? Are there any possibilities for change? Once the the fundamentals of causation behind PW movement and distribution are reasonably well understood we might be able to spot the development of any trends that may enable future changes to occur. Part 2 of Carl’s Theory proposes that we already have knowledge of a meaningful share of such information in place but not yet widely available, knowledge that could be quickly put to use by way of explaining changes of a potentially dangerous character that are already occurring.

As a parent I am too often reminded of the old adage that says “children act like their parents – despite all attempts to teach them good manners.” When one free viagra pills of our kids does something I’m not especially pleased with, my first inclination is to wonder “where did you learn that?” If I reflect on it for hair loss treatment. The procedure doesn’t begin just after consuming this drug may include: NauseaHeadacheDizzinessBlurry visionDiscoloured urineStuffy noseHowever, doctors claim that these side-effects are mild reactions of the 5mg cialis price solution that you need to pay special mind to. Do generico cialis on line not take this medication if you are under 18 y.o. The GPS systems for cars complete different levitra fast shipping applications but the obviously one is to guide people to reach different locations.

These changes are dominated by processes featuring the activity of unique agencies that are present only in the upper level of the troposphere, and only as it exists over the mid to upper latitudes of each hemisphere. The relatively small proportion of global PW that gains access to the high-altitude realms where these forces are in play, generally starting about three miles above the surface, are greatly affected. Their greenhouse energy output is consequently magnified far beyond that of PW molecules contained by the lower atmosphere or by the less differentiated tropical atmosphere that is overloaded with PW at all levels. To be continued.

Carl

Posted in Daily Climate Letters | Comments Off on Climate Letter #1934

Climate Letter #1933

My project for the time being is to create an appropriate definition of a theory that I hope will be coming into existence as a topic of public discussion, but has not yet arrived. Yesterday I recommended use of the name, “Carl’s Theory,” which at best is only a shortcut. Theory of what? That has to be narrowed down to a full name that is both specific and accurate, with a focus on something that is new to human understanding. This is a basic requirement for the proposal of any theory that is meant to be important for some reason. The public is then left to decide whether the theory is correct and whether it is important. Any theory that advances our understanding of climate change, if valid, should have extra importance in these times.

What I wrote about yesterday was not greenhouse energy effects in general, or precipitable water (PW) in general, both of which are widely recognized realities, but rather of how the two can be linked together and viewed in combination. This is a subject that is conceivably worthy of study but to date has not gained much attention of any kind. PW is certainly not mentioned in the science literature as a producer of greenhouse energy, in the company of “regular” greenhouse gases and clouds, in spite of having a composition that is deeply indebted to both. All of the gases have some type of associated data that helps to define their powers. Water vapor, because it is not evenly distributed throughout the atmosphere like the others are, has a more limited amount of data to work with and has basically been subordinated to the status of a feedback. Clouds are even harder to pin down from the standpoint of hard data, but reasonably competent observations lead to the general conclusion that they have significant powers of production of greenhouse energy that noticeably affects surface air temperatures. On the other hand, depending on the situation, clouds also generate cooling effects by virtue of their albedo properties.

The total content of all the PW in the atmosphere is widely understood to include virtually 100% of all the water vapor that exists and the same for all of the clouds that have formed as a result of vapor’s condensation, plus more of the same for a number of advanced products like rain and snow, etc. The total molecular weight of all these PW components is subject to accurate measurement, detailed on a fairly tight scale and short time frames with respect to location and further determined in terms of vertical columns.  This information is widely available in usable formatting.  It is basic to my principal discovery, totally unexpected, that the holistic greenhouse effect of PW can be determined over an extraordinarily broad range of values with a high degree of accuracy and consistency.  The calculations employed in making the determination require nothing more than limited amounts of other information, all of which is readily available and notably accurate, most importantly in the form of short-term temperature anomalies.  The greenhouse power itself is expressed in exactly the same manner that the greenhouse effect of carbon dioxide is commonly expressed, in terms of a standard addition to surface air temperatures caused by logarithmic changes in the atmospheric concentration of the energy producer.

At the time of penile erection that occurs naturally, penile tissues relax and flow of blood is the basic requirement of reproductive system to work and produce hard-on. buy cialis online Who should avoid Kamagra? Though it is efficient erection-aiding drug but, there is limitation of consuming the medication. viagra without prescription canada Living with dry and itchy eyes can cause havoc tadalafil pharmacy online https://pdxcommercial.com/ for a person, as it interferes with life on a daily basis can have a long-lasting positive effect on circulation to the penis. But do you know what, both cialis levitra generico federal government and condition organizations still follow that old, out-of-date, never-proven (if you don’t count the proof its failure to create safer individuals) method from 1949 – yes, that is the main medicine of erectile dysfunction of men.

In the case of CO2, including selected feedbacks and after giving consideration to certain geographical differences, the temperature addition caused by any doubling of concentration is calculated at an average of roughly 3C degrees for the entire planet.  This number becomes useful for making long-term temperature projections when coupled with credible CO2 concentration forecasts.  The logarithmic power of PW, according to my calculations, is much higher than this, about 10C per double, but the utility of this number is lost by way of exposure to extreme variability with respect to both location and duration.  It offers little guidance to current expectations for the entire planet and practically no help at all in making long-term projections.  Part 2 of Carl’s Theory, which will next be discussed, also deals with the greenhouse power of PW but from a different standpoint, in this case based on discoveries about the way PW is distributed across the globe. Distributional vagaries are found to have powerful effects of their own on greenhouse energy output. This study opens the door to an examination of potential mechanisms for propagation of the 10C power in some situations via effects due to an onset of physical leveraging.

Carl

Posted in Daily Climate Letters | Comments Off on Climate Letter #1933