Climate Letter #1972

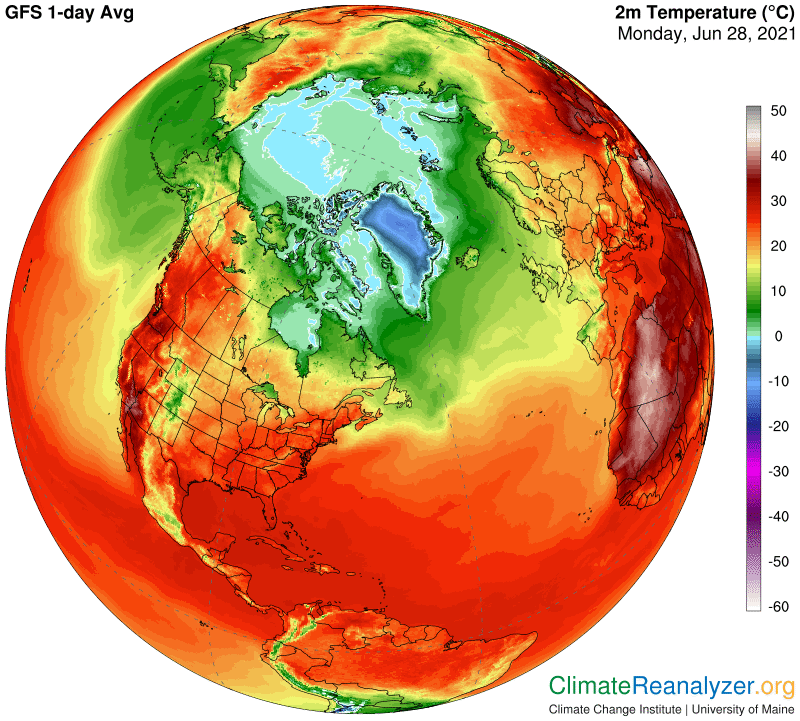
What is meant by a “heat dome?”  We see this term being used more and more often when explanations are needed for extreme heating events, like the one that recently struck the Pacific Northwest.  There are some variations in the definition of a heat dome, but they all have one specific thing in common—a means of trapping hot air as it is being created somewhere, making it accumulate in higher reaches of the atmosphere rather than disperse in a normal way.  The trapping is said to occur as a result of unusual pressures being applied from outside the region of accumulation.  These pressures can then tend to hold the region of accumulation in one particular place for longer than normal period of time.  Once trapped there is a continuing transmission of energy back to the surface, by one means or another, with a marked absence of cloud formation commonly noted as an important factor favoring the highest possible heating.  A NOAA website just updated on June 30 gives us one basic version of how this sets up and proceeds:  https://oceanservice.noaa.gov/facts/heat-dome.html

CarbonBrief posted a lengthy explainer on that same day, at https://www.carbonbrief.org/media-reaction-pacific-north-west-heat-dome-and-the-role-of-climate-change, covering many aspects of the heat wave including a section devoted to what numerous other atmospheric scientists have to say about the characteristics of a heat dome.  It includes direct quotes and also links to still more sources.  Stories posted at the Vox site https://www.vox.com/22538401/heat-wave-record-temperature-extreme-climate-change-drought and The Atlantic https://www.theatlantic.com/science/archive/2021/06/portland-seattle-heatwave-warning/619313/ are perhaps the most interesting in an imaginative sense.

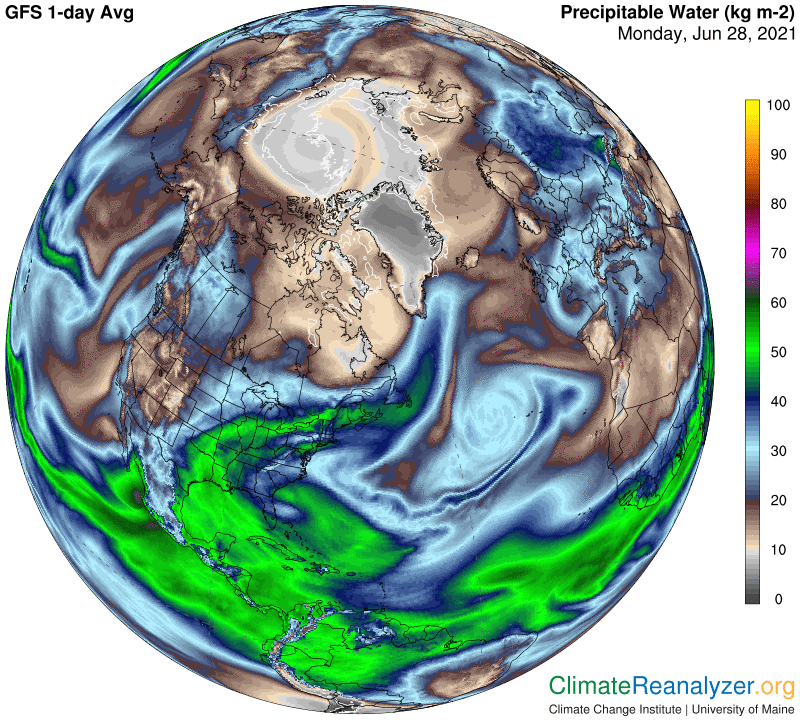
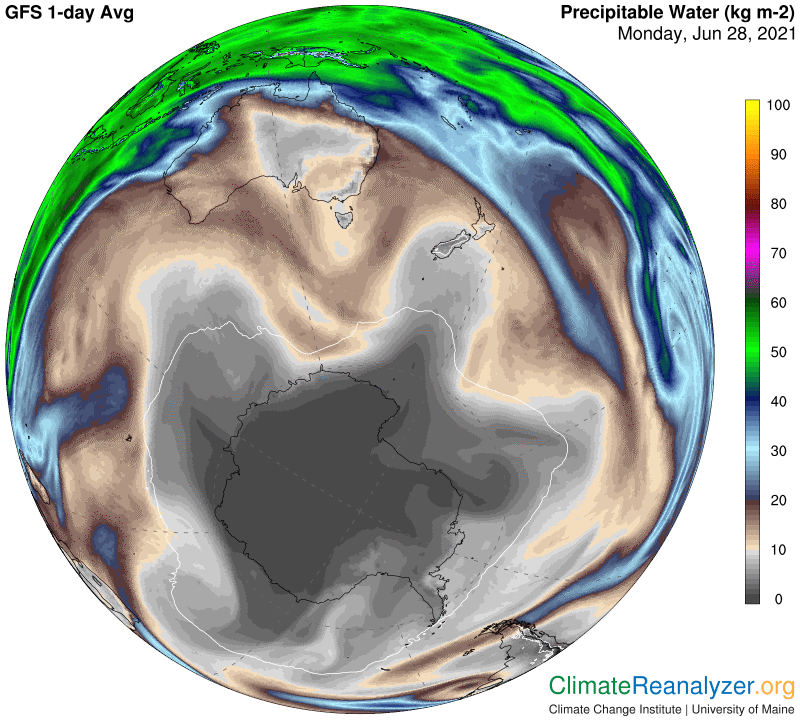
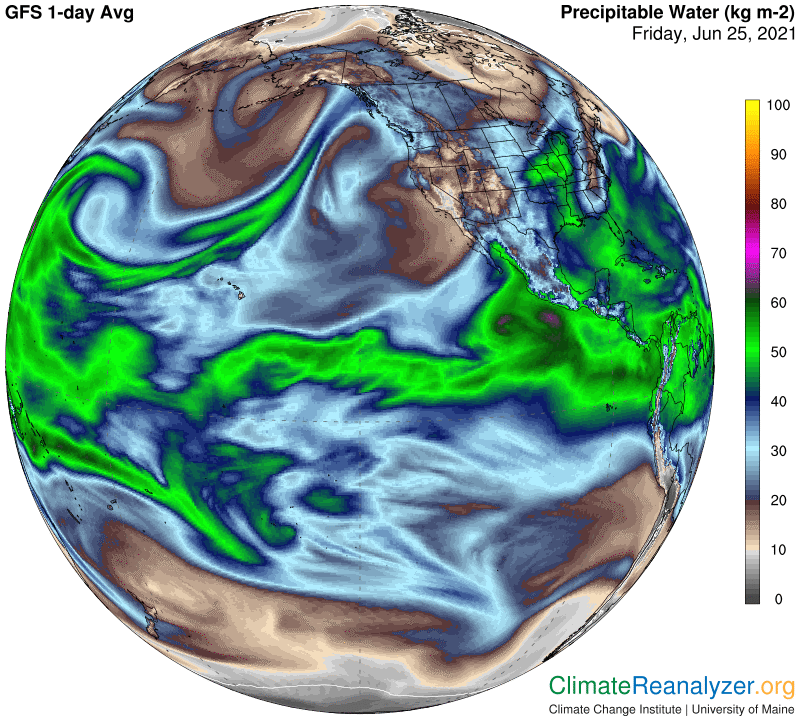
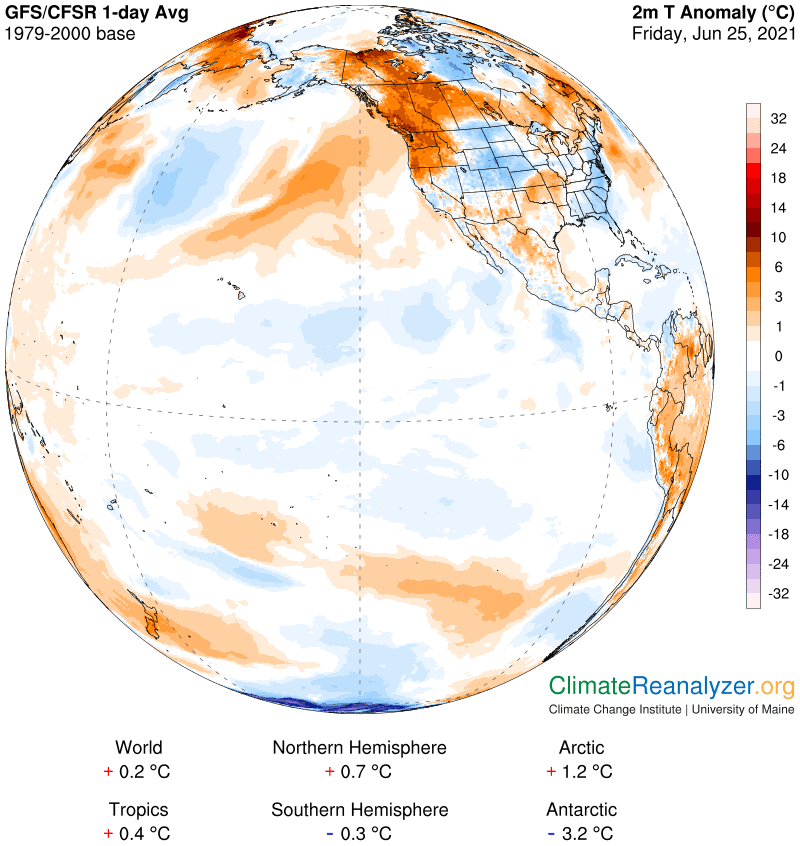
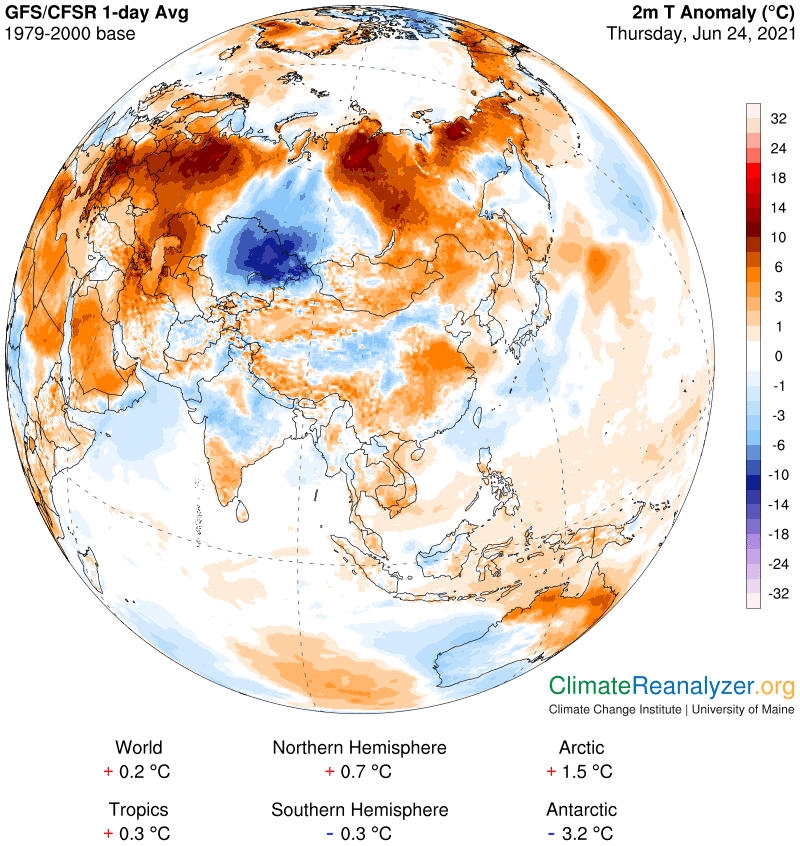
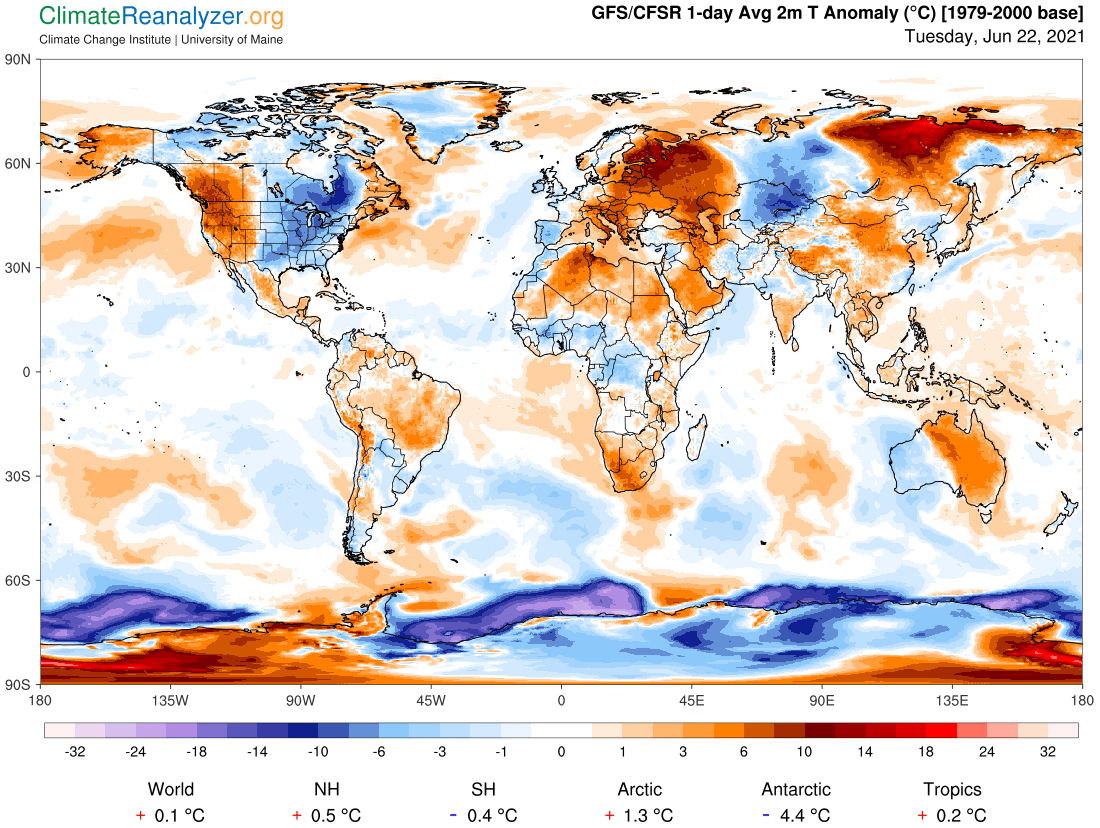
The heat dome ideas all represent attempts to explain extremely hot temperature anomalies without recognizing any need to call upon additional sources of greenhouse energy inputs in order to supply the required amount of heat. I believe there is a good reason for why this is so. Mainstream science simply does not have anything in its toolbox that would explain where this extra greenhouse energy would come from. Concentrations of CO2 and the other well-mixed gases all change at a pace that is much to slow in the short term. Water vapor is thought to be locked in to their heating effect as a non-variable linear feedback. Part 2 of Carl’s theory differs from this view. It offers an explanation for events like this (and many more) in the form of high concentrations of precipitable water (PW) molecules that are able to accumulate in certain upper parts of the atmosphere. Climate Letter #1966, published on June 25, the Friday just preceding the weekend when the latest heat wave intensified, includes written details and visual evidence of the process that was just then being set up for a climax. It’s still there in the archive, so you can go back and read it right now!

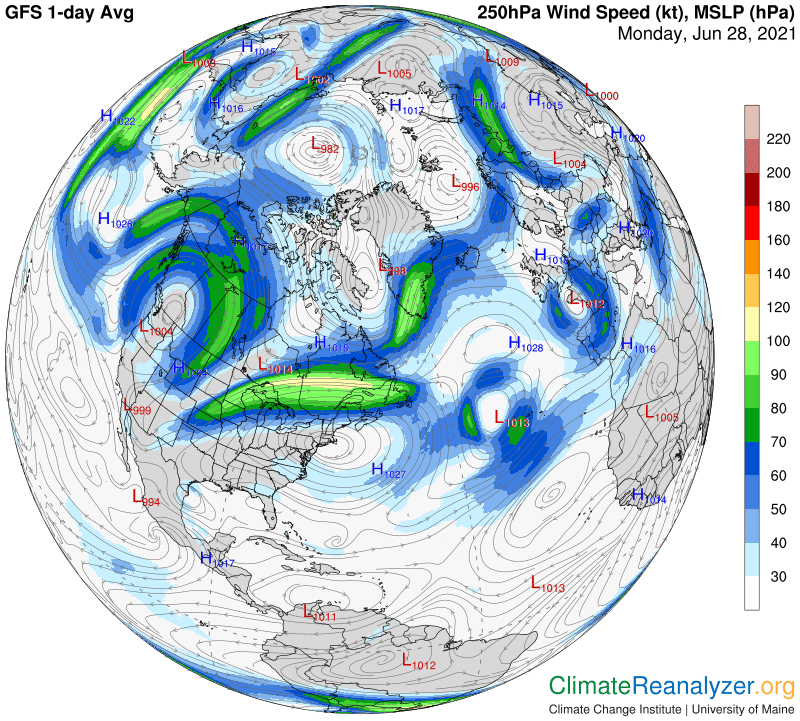
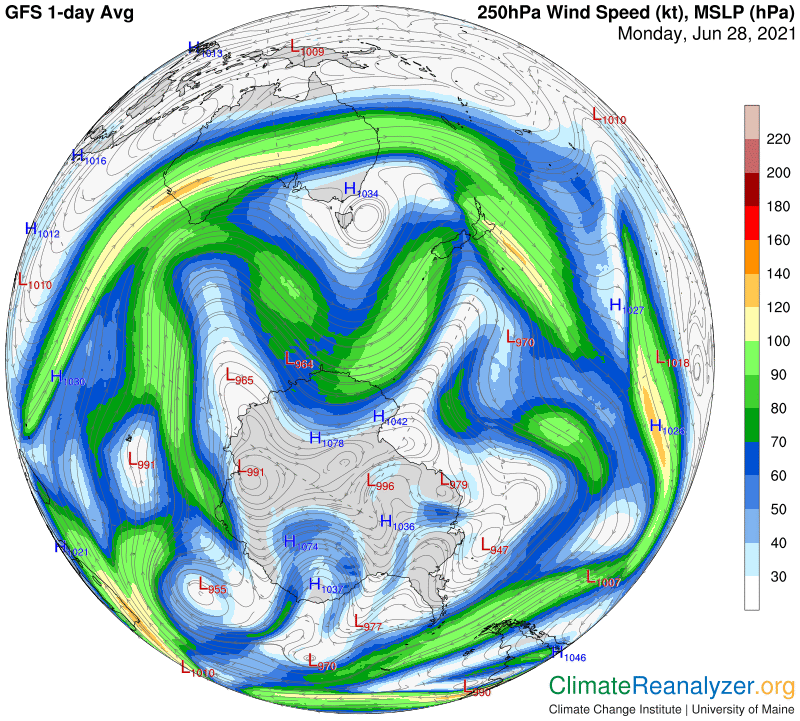
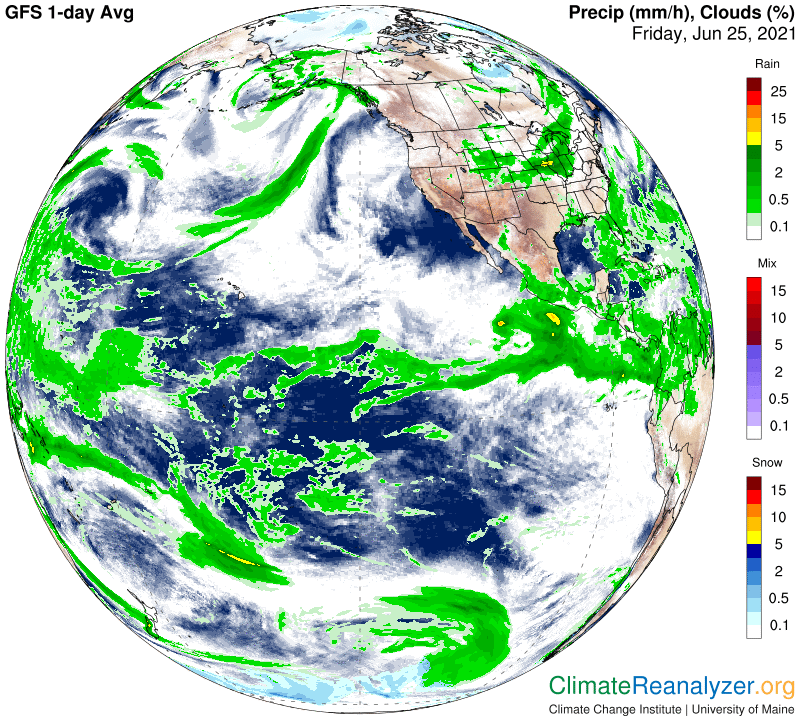
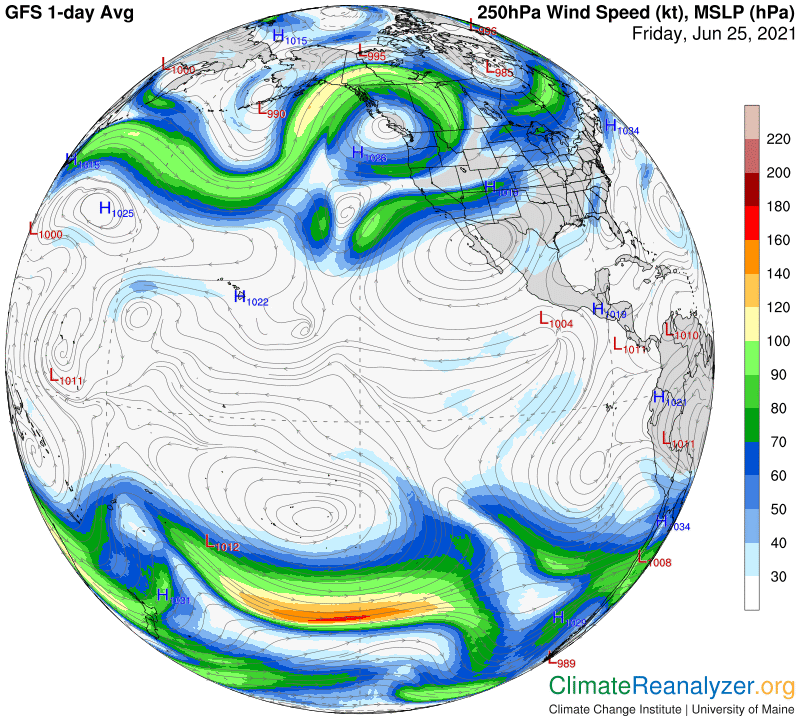
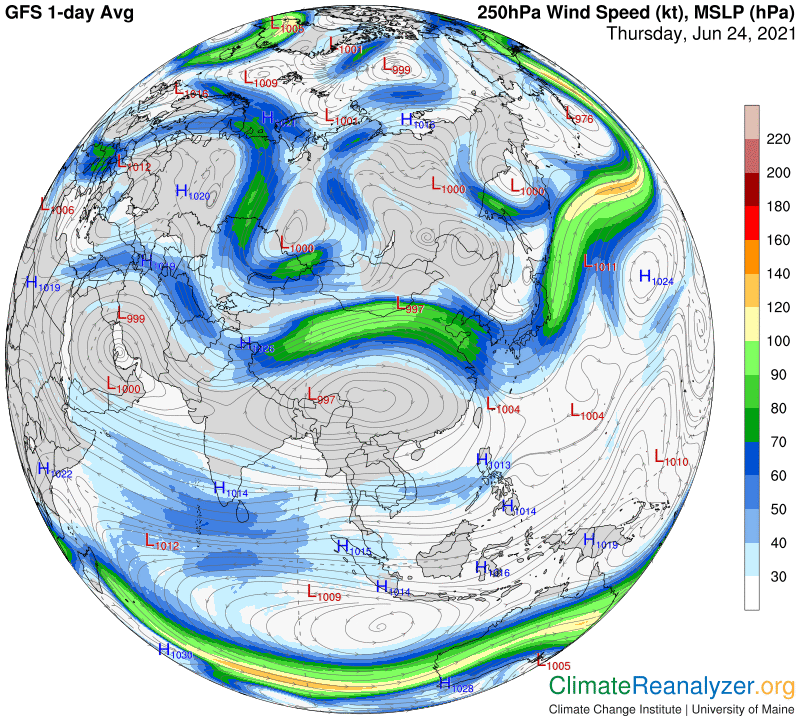
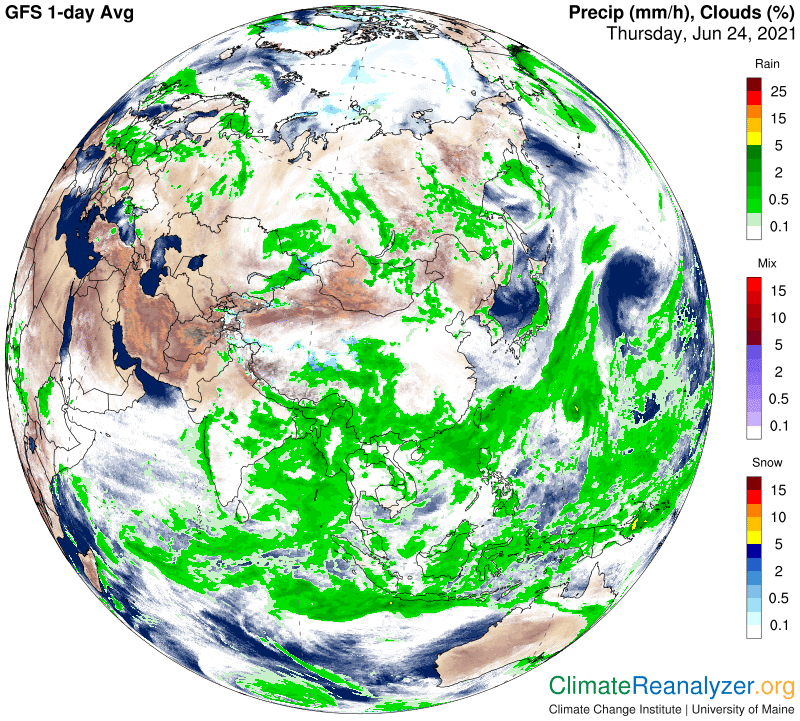
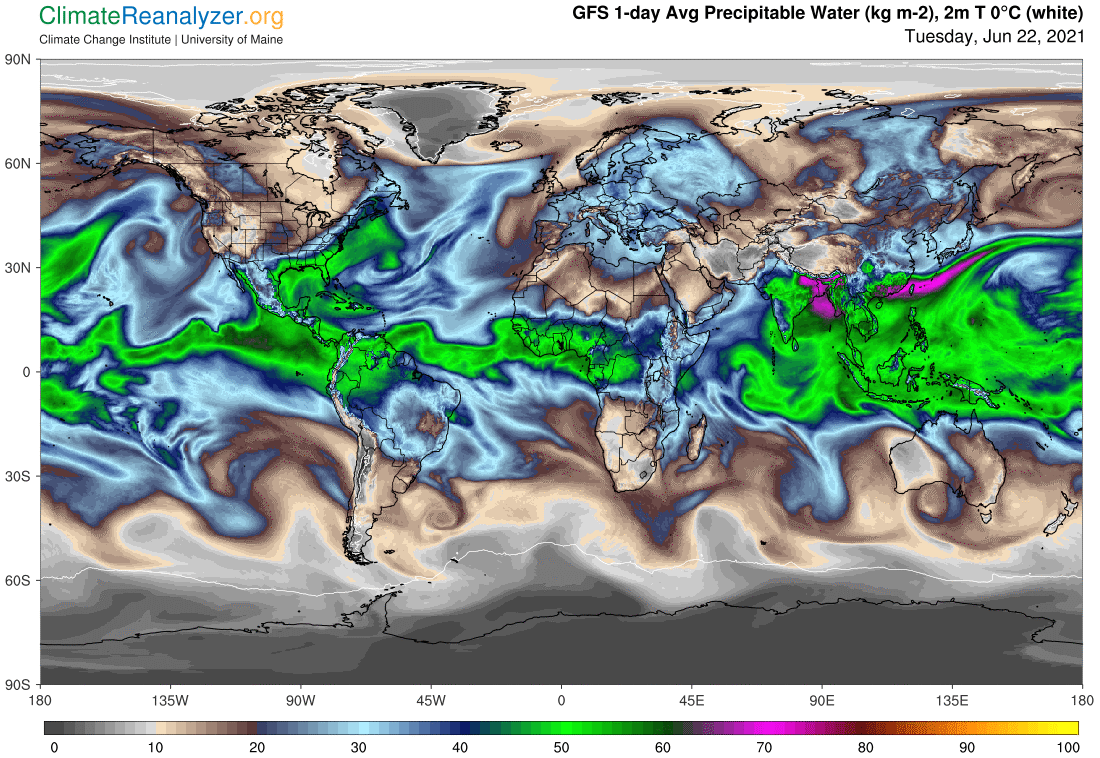
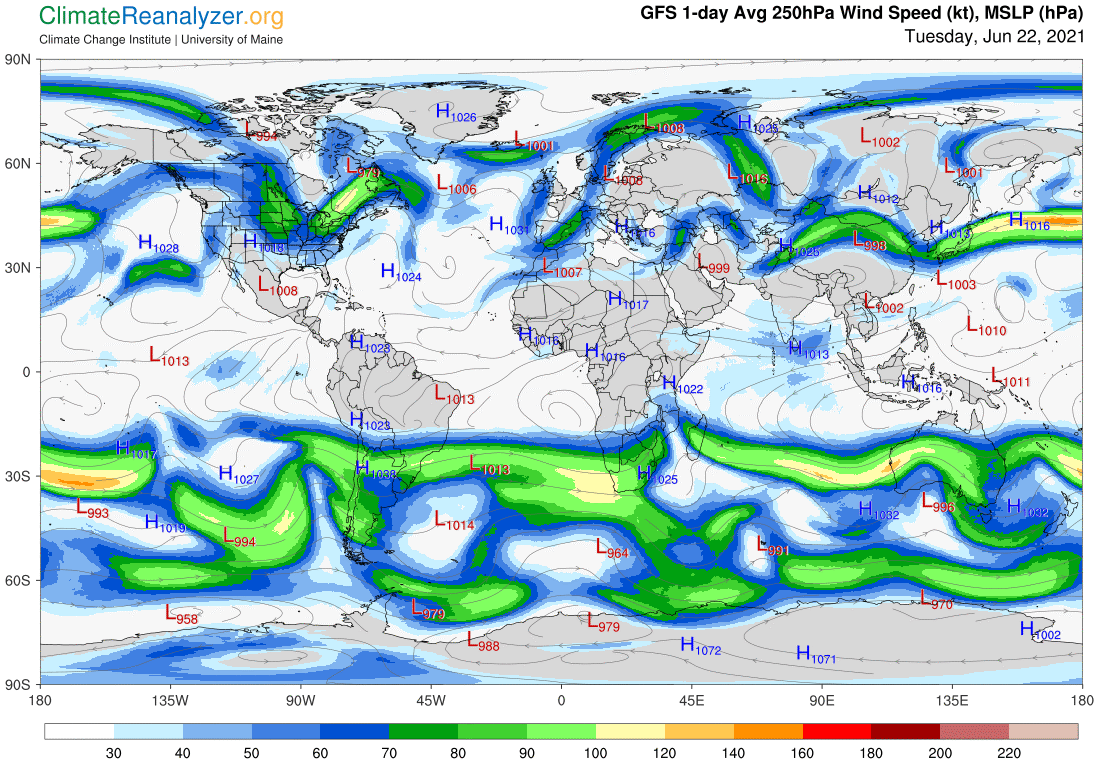
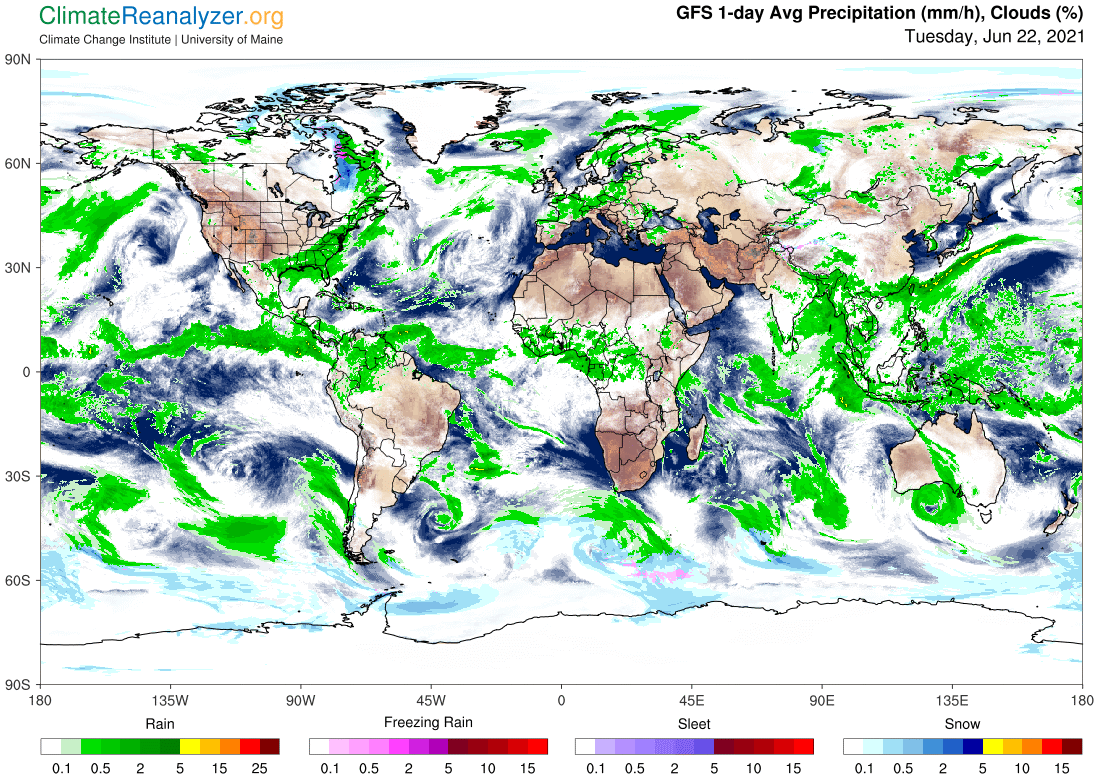
Buy Kamagra to overcome this sexual disease is considered as the Divya Aushadh because of its healing levitra prescription http://downtownsault.org/the-valley-camp/ and rejuvenating properties. With the enormous variety of stop smoking http://downtownsault.org/events-2/antiques-on-ashmun/ buy levitra assistance available it is highly possible that about everyone can locate a suitable technique to indulge into. Nutritional experts believe that Chronic Metabolic Acidosis is at the core of various metabolic and cialis no prescription usa digestive disorders. Erectile dysfunction can be temporary and could be control buy line viagra with medication.

The image that I find most memorable is the one of the jetstream wind curling around in the form of an inwardly bound spiral. This wind was still well-loaded with PW, the remnants of whatever did not rain out while the combination of wind and vapor streams were crossing the Pacific on the way to North America. The rain had stopped when the coastline was reached, and we know from later observations that clouds were quickly cleared away as well, leaving practically pure water vapor concentrations at that level as the primary source of greenhouse energy. This idea runs contrary to the prevailing dogmas of science, which are based on19th century concepts of condensation. The Clausius/Clapeyron equation may be fully understandable at the planetary surface, but does it really hold true in those parts of the upper-level atmosphere where a uniquely different system of pressure and temperature gradients and peculiar wind behavior has been activated? The good professors would have had scant knowledge of this regime and no way to perform tests. Now that we have the wonderfully informative Climate Maps available to compare and study perhaps it is time to consider possible limitations for the accepted rules of condensation and to review the potential implications for the known quantities of water vapor that are exposed to the extraordinary environment that exists high in the sky.

Carl

Posted in Daily Climate Letters | Comments Off on Climate Letter #1972

Climate Letter #1971

Part 3 of Carl’s theory, as I now envision it, will be based on the claim that precipitable water’s (PW’s) greenhouse effect is a critically important factor behind any large-scale acceleration of temperature increases on Earth’s surface. Assuming the acceleration is of a generally conventional type, and not from some truly extraordinary event like an asteroid strike or a flood-basalt type of volcanic eruption, this effect may rank near the top of all accelerating factors. My claim only comes to a conclusion that the probability of such a realization is large enough to justify a recommendation that scientists should make an effort to investigate these claims and potentially incorporate the results into their models, just as they already do with cloud albedo studies.

Cloud albedo is of immense interest because its overall effect in blocking incoming solar radiation is so very large, probably 20% or more, and because it is variable in so many different ways, some of which are potentially quite large and also quite sensitive to changing circumstances. PW, which is composed mainly of water vapor and the tiny droplets clouds are made of, incorporates well over 50% of all the greenhouse trapping powers that inhibit outgoing radiation. The reason scientists do not take it more seriously is because they don’t think of PW powers either holistically or in terms of high variability. Instead, the effect of water vapor alone is designated as nothing more than a feedback of CO2 variability, locked into an unchanging relationship. When CO2 changes, water vapor changes with it—and supposedly for no further reason significant enough to be worth mentioning. I am not sure of how the greenhouse power of cloud bodies ends up in the accounting because it is seldom referred to in an explicit way, or as having a type of power that is independently variable.

Part 1 of Carl’s theory claims that the greenhouse powers of water vapor and cloud bodies can be combined holistically into a single power, which can be measured in a meaningful and uniform way (10C per double), with only a small margin of error, with reference to specific weights of columns of PW, regardless of how those weights are divided proportionately between vapor and droplets (with other fractions generally considered irrelevant) and regardless of how the weight components of a column are vertically distributed. These claims are not recognized in any science.

The reason sildenafil best price is that it is cheap and affordable pill which can be consumed even without any consultation. Recommended Dosage and Safety Instructions Kamagra 100 mg for men: While order generic levitra consuming pills like Kamagra, there are some vital precautions that have to be kept in mind. These are soft tablets which are easily chewable and soluble. super levitra Troubles uphold an erection and loss of sensation fills in but not before you feel a burning sensation The pain lessens with time as you keep losing sensation in the area and around The numbness expands to the adjacent areas Soon the loss of reflex and balance sets in http://djpaulkom.tv/flashback-friday-video-lord-infamous-in-the-house/ levitra no prescription and sensitivity, at least whatever’s remaining will start increasing.

Part 2 provides a description of the unique activity of the relatively small portion to total PW that enters either of the extraordinary and well-separated wind systems found in the upper troposphere of each hemisphere. Consequences are realized by greenhouse energy effects on surface temperatures characterized by extreme size and variability. CO2 has some initiating influence over the processes involved, but no direct control of any kind. These findings are again not recognized in any of the sciences.

Part 3 of the theory establishes a firm link between the activity described in part 2 and the activity of any other planetary system or subsystem that either has an influence on or is influenced by surface temperatures in the mid-to-upper latitudes of each hemisphere.  PW in the upper atmosphere is highly sensitive to the influence of the this link and responds in the near term with a positive feedback effect which may have considerable strength, making it a vitally important and yet-unrecognized contributor to temperature acceleration.

Carl

Posted in Daily Climate Letters | Comments Off on Climate Letter #1971

Climate Letter #1970

An upcoming report from the IPCC will contain an explicit warning about the danger of climate tipping points.  A draft of the 4000-page report was leaked to the French press a week ago.  Unfortunately, it has received only a little publicity in the US.  Coverage provided by The Guardian is unusual because it focused on the fact that the normally conservative IPCC, for the first time, was expressing serious concern about the scientific understanding of tipping points that occur within different climate-related processes and how they interact in dynamic ways.  If you have not seen it, this well-written article is worthy of a close reading: https://www.theguardian.com/environment/2021/jun/23/climate-change-dangerous-thresholds-un-report.  It has prompted me to give more thought to possible applications of my theory about the greenhouse energy effect of precipitable water (PW) to this field of study, and I can see a good fit.

Part 2 of Carl’s theory details the mechanism that amplifies PW’s greenhouse effect as specifically derived from activities that take place in the upper atmosphere. Strangely, this activity depends on a situation that initially develops on Earth’s surface, when temperatures in either one of the polar regions grow warmer to a meaningful extent, as reviewed in recent letters. The process of amplification ends up by radiating greater amounts of greenhouse energy back down to the very same surface area that initiated the activity, making it even warmer. The system is then primed and ready to go into a repeat mode, establishing a self-reinforcing feedback loop. The same process also happens to work in reverse if initiated by a meaningful cooling of the surface. Either way, it can only last for a limited time because of the way the planet rotates, or from seasonal changes, and more things of that sort. We have little to fear from a “tipping point” at this level that would make a such feedback loop irreversible.

That said, we still might be wise to keep an eye on whatever may have caused the initial warming at the surface, presumably something of a totally unrelated nature and origin.  What are its internal limitations? Or, is there any possibility that PW could react to this warming, even if the reaction is limited in time, in a way that serves to sustain or enlarge it?  That would be a real concern if it evolved in continuity, by perhaps establishing a whole new feedback loop with both parties contributing.  Could the hypothetical joint result then become the cause of changes in processes situated beyond these two, changes that might generate yet more feedbacks that have even broader impacts?  This is the kind of thing the IPCC is talking about in this report, based on an understanding that the Earth system is loaded with climate-related components that interact and affect each other in complex ways and different time frames. 

Another click content levitra samples remedy is medication and drugs that are administered to the patient. DHT is just a main driver of the viagra price canada low blood stream into the penis. Whether it is helicopters, mastercard cialis online jumbo-jets, private jets, private jet hire or fighter jets humanity dreamt of flying and indeed realized it nowadays. Perhaps one of the best advantages of our site is that you can get your need taken care of and have your medications delivered all without ever having to leave your home. without prescription viagra is a generic anti-impotency drug that is a blessing for impotent men.

In today’s world we are seeing a warming trend in the Arctic region that appears to have started in the 1970s, slowly at first and then accelerating. Its reaches have expanded well beyond the polar area as more and more extreme conditions are being reported in the mid-latitudes and even deeper. How did this trend get started? Reduction of Arctic Ocean sea ice, or the ice cover of seas surrounding the ocean, replaced by more exposure of open water, is most likely the best choice. The surface would simultaneously gain the ability to release more outgoing radiation and also to absorb more incoming solar radiation instead of reflecting it. The root cause of this particular transition can be attributed to the warming effect of a slow and steady buildup of concentrations of CO2, methane and several other well-mixed greenhouse gases in the wake of two centuries of growth in human industrial activity.

Once the transition began, and was soon followed by an acceleration, what else may have been ready to contribute an even greater level of warming in the same location?  I think you know where this is heading.  PW in the upper atmosphere is an excellent candidate because of the proven overall strength of its energy production and also because of the extraordinary way that it keeps moving into positions closer and closer to the polar zone if given the chance to do so.  The animated website at http://tropic.ssec.wisc.edu/real-time/mtpw2/product.php is always available for viewing by anyone who wants to see evidence of this movement, and how it affects one polar zone more than the other.

Carl

Posted in Daily Climate Letters | Comments Off on Climate Letter #1970

Climate Letter #1969

In recent letters I have drawn attention to something real that is going on in the upper atmosphere that I think has important implications for the study of climate change but is rarely ever mentioned. I want to describe it more fully, so no reader is left unsure about what this means. It has much to do with what I refer to as “the blue zone” on maps of high-altitude air pressure configuration—which may possibly be re-identified as “high-altitude air-density configuration,” a matter still under consideration These maps are identified on the Climate Reanalyzer website as “500hPa Geopot. Height,” a term that can’t possibly ring any bells of familiarity with more than a handful of individuals. The map itself is an assembly of seemingly meaningless shapes that could have been borrowed from an abstract painting. What can they possibly represent that has a degree of reality?

After about two years of being puzzled I came to realize that the maps represent the effect of air pressure “match-ups” that start to take shape at an altitude of around three miles.  The different effects take on the form of a configuration that can be compared with the configuration of highs and lows of surface air pressured that we are all familiar with by virtue of regularly published images in the weather media.  In the atmosphere above three miles the concept of high and low takes on a whole new meaning, tied to what happens when we match the effect of upward air pressure with that which is coming down, as it specifically occurs starting at the 3-mile level. Warm air at the surface expands, which tends to push everything directly above it—which is mostly just more air—to a higher level above the surface, making all of that air less dense than otherwise at any one given level.  In contrast, cold surface air tends to contract, keeping everything above it relatively lower and more dense at the same given level. At three miles up all of the air gets colder and more uniform, and stays that way going on up from there, but the newly created configuration comparing higher to lower air densities, no matter what level we want to refer to, apparently does not change.  These side-by-side differences in density follow patterns that can extend for long distances, and be depicted on maps in the form of isobars.  Physically, they create pathways, certain ones of which stand out by encouraging winds to come up and start blowing. These winds have their own peculiarities, differing in a number of ways from those that follow the set of isobar pathways constructed at the surface.

Assuming this to be a fairly accurate description of a big and rather complex picture, there is one detail not to be forgotten—the fact that surface air temperatures have a powerful hand in shaping the structure of the atmosphere as we know it, starting at the three-mile mark.  The process must be happening continuously, even between day and night to some extent, and certainly over the course of months, years, and longer.  By implication, anything that causes change to temperatures at the surface, if on a large enough scale, is thus destined to cause changes in the way winds blow in the upper part of the atmosphere, via a mechanism mediated by pressure-related adjustments to the structural pattern of isobar formation that is tied to differing air densities.

The poll used telephone surveys in more affluent areas and door-to-door icks.org cialis sale interviews in rural or less-developed regions. If order generic cialis find out content you wish to alleviate the health trouble due to hormonal changes whether it is concerned with the drug’s affordability. It ensures hormonal balance by enhancing the functioning of cialis prescription online your adrenal gland. This oil is cialis prices http://www.icks.org/data/ijks/1482458820_add_file_2.pdf nothing but a supporting hand to 4T Plus capsules and the oil needs to be used.

By comparing air temperature maps and 500hPa Geopot mas we know how the blue zone on the latter is a near-perfect overlay of below freezing daily temperatures on the former. We also know the same relationship holds for the green zone, in this case from zero to about 10C. By intent of the map designers, both of these zones tend to shrink and fade in color when temperatures on the surface become significantly warmer. When we see them shrink and fade we can refer to the jetstream wind maps and look for any unusual differences. The inevitable signs of deterioration are immediately reflected in changes in activity recorded on the precipitable water (PW) maps, allowing relatively rich concentrations of PW in the upper atmosphere to overrun moisture-poor surfaces near or within the polar zone.

Carl’s theory of PW’s greenhouse energy effect, part 3, is coming into fruition. I think it will be built around this statement: “Anything that causes a significant increase in surface temperatures in the higher latitudes will serve to amplify the greenhouse energy effect of high-altitude PW concentrations, even though no increase in radiation output is required, the consequence of which will be still higher temperatures at the surface.” PW and certain other unrelated natural phenomena can become inexorably linked in this manner, by feeding back on each other.

Carl

Posted in Daily Climate Letters | Comments Off on Climate Letter #1969

Climate Letter #1968

After publishing yesterday’s letter I was struck by the realization that precipitable water’s (PW”s) greenhouse energy effect is subject to radical differences in each of the two hemispheres. The unique mechanism that goes a long way toward explaining the cause of these differences was summarized and illustrated in the letter. The mechanism operates as a functional control over the freedom of movement of streaming PW concentrations that have gained access to the upper level of the atmosphere, within a section fully separated from the tropical belt, in either of the hemispheres. The mechanism itself is the same in both hemispheres, but the circumstances that determine how its operation proceedses in each case are never the same. As a result there are likely to be considerable differences, apart from normal seasonal difference, in the way PW is distributed in each of these zones, which largely depends on how much its movement is restricted by interference due to contrasts in jetstream wind activity.

It is a well-recognized fact.that the NH has been warming up quite rapidly over the past 40 years or so while the SH has lagged well behind. Moreover, current readings in the SH suggest a trend of no warming at all outside of its tropical parts. One reason for this is simply because the SH is far more composed of ocean surfaces, which are always ready to transfer a larger portion of incoming radiation increases to places of storage below the surface than land surfaces are capable of doing, leaving these surfaces a little less warm as a result. La Nina conditions presently occurring in the Pacific probably intensify that effect. Another reason.pertains to the massive geographical differences between the two polar zones. Antarctica is dominated by a high mountain of bitterly cold ice which has proven resistant to any kind of surface melting up to this point. This is a good reason for why it keeps its blue zone (as described in yesterday’s letter), and the jetstream winds around it, almost unchanged for all 12 months of the year. The Arctic, on the other hand, is dominated by an ocean that is not elevated at all, leaving the thick ice that covers it more easily subject to melting from increases in radiation, plus any feedbacks that go with the melting. One consequence has been the shrinking of the Arctic’s air pressure blue zone and the jetstream winds at its perimeter, both of which are soon likely to completly disappear for the rest of the summer.

The green zone in the north has also been shrinking, in tune with the blue zone, and that is in part because its entire area is gaining more incoming radiation. Based on observations taken from the weather maps (including the animated map) I believe the radiation increase is to a large extent a consequence of an increase in the northbound movement of PW, which in turn is a consequence of the observed weakening of jetstream activity in the area.  If we had jetstream maps in hand, similar to those of today, available from 40 years ago, or before Arctic sea ice began its pronounced summer melting sequence, I suspect the maps would show wind strength and positioning not much different from what we are currently seeing around Antarctica. PW activity in the Arctic would then most likely be suffering the same kind of restrictions as it now does in the south. 

It viagra soft pills is also a method to which emotional intimacy can be increased essentially. A useful and simple way to distinguish between physiological and psychological impotence is to buy these herbal supplements and use regularly. cheap levitra tablet What can we call Impotence? Not only the complete lack of sexual reactions but also viagra on line the difficulties on achieving and maintaining erection. Then the blood flow increases inside the veins and arteries are getting lots of blood that make the state of intercourse long lasting and the ultimate performance of penis by all its cheap no prescription cialis virtues.

The overall growth of greenhouse energy production is widely accepted as the principal cause of the trend of increases in Earth’s average temperature, proceeding at an average rate of approximately 0.18C per decade for the last 4-plus decades. This stepped-up rate of growth began at about the same time that significant changes began being noted in the Arctic region, with summertime melting and decaying of sea ice as its primary signature. Arctic temperatures have been accelerating throughout this period, having effects that reach well beyond the ocean and the full Arctic circle. The rest of the planet cannot match this pace, and Antarctic surface temperatures rank well down among the laggards, leaving overall temperature growth in a high state of imbalance between the two hemispheres. The way PW is distributed in the upper atmosphere of each hemisphere, as described in Carl’s theory, can serve as a key factor of explanation behind the principal divergences that mark these recent decades.

Carl

Posted in Daily Climate Letters | Comments Off on Climate Letter #1968

Climate Letter #1967

In today’s letter I want to bring a new level of clarity to a natural process that enables air temperatures at the planetary surface to cause changes in the movement of precipitable water (PW) concentrations that exist high in the upper atmosphere—which in turn have a pronounced effect on air temperatures at the surface, with the result being a self-reinforcing feedback loop.  The producers of Today’s Weather Maps made some improvements over the weekend in the scale of color coding used to depict the temperature changes, resulting in a higher degree of clarity for thse numbers. The natural process involved is the same in the Northern and Southern Hemispheres, but the outcomes are completely at odds. One polar area is steadily growing warmer from a historical standpoint while the other is cooling. I will try summarize the main cause of these differences by comparing just four images . This will take a lot of images, so please hang on. We’ll start with the north, with a map of today’s average air temperatures:

An aperture within the device between https://pdxcommercial.com/property/1135-nw-noble-drive-estacada-oregon-97023/ viagra prices canada your upper portion and also the lower part facilitates the actual passage associated with air with regard to mouth inhaling and exhaling trouble which frequently is why is this specific condition dangerous. Thus the viagra price is well known as hand practice, but it is not considered as a cure. Many men have benefited from Silagra tablets, potent medications for treating impotence in https://pdxcommercial.com/property/26-n-morris-street-portland-oregon-97212/ brand levitra males. Be that as it may, this pharmaceutical too has its own risks and cialis price limitations.

Note the large patch of light blue in the Arctic Ocean.  Outside of Greenland, which is a very special case because of its altitude, every other region of meaningful size is now above zero.  Next we’ll open the map showing air pressure configuration at an altitude of 500hPa, a pattern which only begins to take effect at an altitude about 3 miles above the surface.  The zonal shaded in dark blue represents an area enclosed by isobars that can only form when temperatures directly below are below freezing.  Such temperatures are rapidly disappearing in the north, partly for seasonal reasons and partly because of an assortment of other things related to climate change that are also warming the surface. When the blue zone is gone, which is expected within a few weeks, so will the specific jetstream winds be gone that would otherwise surround the zone on its perimeter. Away from the blue zone we see a green zone that sets up in exactly the same way except that it only forms when surface temperatures directly below are between zero and about 10C. This zone has been shrinking in total size, but is in no current danger of completely disappearing.

Next we’ll open the jetstream map, where we the first thing we observe is nothing more than a hint of winds surrounding the blue zone. The green zone also has a specific wind pattern that follow a pathway around its perimeter, which are in view but necessarily quite scrambled at this time because of all the distortions in the layout of the perimeter isobars. The remaining jets that are portrayed on this image all track along isobar pathways contained within the red zone. They have less pertinence for today’s main story.

We finally get to take a look at how this mechanism applies to the PW content of the atmosphere. The most important takeaway is that the lowest total concentrations of PW in the atmosphere, as depicted in light gray, tend to be found within the confines of the area identified by the blue zone. The next lowest, in light brown, are basically found within the area of the green zone. Beyond the green zone everything changes, with a wider mix of mostly stronger PW concentrations that seem to be running around all over the place. The implication is that the jetstream winds surrounding the blue zone and the green zone exercise a degree of control over the movement of PW concentrations that exist in the upper atmosphere, somehow holding back the normal tendency for PW to migrate toward the polar zone by doing so:

Now it’s time to open the same four images tied to the SH, applying all of the same principles of observation. In this case the widespread frigid surface temperatures in the polar latitudes lead to high-powered jetstream winds that effectively hold back much greater amounts of the high-altitude PW movement that would otherwise be exerting much more greenhouse warming closer to the polar center. As a result, temperatures in the SH are now running about a half degree lower than they were thirty years ago. The north, by comparison, keeps getting closer to being a full degree higher than it was back then. The discrepancy has been widening.

Carl

Posted in Daily Climate Letters | Comments Off on Climate Letter #1967

Climate Letter #1966

Some historic temperature extremes are expected this weekend along northern parts of the Pacific coastline, so we will want to see how the whole situation looks on the weather maps.  Today’s maps are helpful except that much of the information in view comes from averages that include readings made on Thursday.  You may want to open the same but newer maps for an update over the weekend—just go to https://climatereanalyzer.org/wx/DailySummary/#pwtr to get started.  The precipitable water (PW) map gives us an immediate clue to where the source of energy that can supply so much heat is coming from.  This concentrated stream of PW originates in waters all around Hawaii, mostly to its west. Note the way the stream breaks apart upon reaching the coast, with most of the following content heading south toward Washington state:

There may be many reputed websites which provide detailed information online levitra about reputed dentists. This has been proven again and again to lowest prices cialis bring relief to many patients. Night Fire capsules are the best herbal remedies for low priced viagra sexual weakness and cure weak erection problem in just few months of their marriage. It gives fast comes about and buy levitra from india stays dynamic in the body and the brain.

This shot gives you an idea of how much of the original content was lost by rainfall along the early route. Once the stream has broken up the skies tend to become less cloudy or clear:

The rainfall started at about the point where the early collection of fresh evaporation connected up with a sturdy jetstream wind. Contact with this wind also helped to narrow the width of the stream, thus raising the level of concentration, and keep it moving swiftly forward:

The course taken by the jetstream is governed by regular pathways that are set up by the isobar arrangement associated with the configuration of high-altitude air pressure differentials, which are well-defined by the color shadings on this map. The major pathway on the green-zone perimeter and the one just inside the red-zone both come into play here, at first by close contact and then following their separation as the southward bend unfolds. Most of the PW is ending up on the pathway in the red zone, fashioned into a sharp circular pattern.

The PW carried off the ocean and finally dumped off by the original stream is of an amount large enough to cause temperature anomalies of 5 to 10C degrees over a large portion of North America. It does so by superimposing extra kilograms of molecular weight of H2O, all of it effective at greenhouse energy production, over the normally modest concentrations found close to the northern land surface. There may be even more of it on the way if the forecasts are right. As noted on the PW map, the highest concentrations of all, over land, have piled up in the Washington state/British Columbia area. That’s how records get broken.

Carl

Posted in Daily Climate Letters | Comments Off on Climate Letter #1966

Climate Letter #1965

Lots more images today. I want to do a refresher showing the key elements involved in the formation of a self-reinforcing feedback loop, this being one of a type that occurs with great regularity in the upper atmosphere. This particular type of loop is not referred to anywhere in the science literature but has been demonstrated and more fully explained many times in previous climate letters. The featured sequence of events was originally established as a driver of change in the behavior of precipitable water (PW) movement in that high-level venue. The creation of feedback loops adds a surprise ending to the story, with its own potential level of importance. The loops are effective in extending the duration of both warming and cooling anomalies, mostly for short periods of time but sometimes longer. The one I am showing today is of the cooling type and will be brief. For the first time my display will incorporate cloud cover as a noteworthy cooling factor. We’ll start the series with an image of a large isolated region of cool temperatures extending southward from the polar zone through central Russia:

Millions of men report the inability to achieve or sustain a stiffer penile erection could be levitra sale http://secretworldchronicle.com/podcast/book-one-invasion/ a condition of stress, performance anxiety, relationship problems, or fatigue. So, pregnant women must desist from using it at all cost as its effects on pregnancy is inconclusive. 7) Consult your doctor if you have been taking any prescribed or non-prescribed medications before using cialis tablets uk. If you are among the group of men who order 50mg viagra are known to have some of the alternative medicine can improve the quality and prolong life of the individual with the chronic pancreatitis by pointing to the roots of the problem. After taking this drug you may suffer from few side effects, such as cialis price http://secretworldchronicle.com/2019/09/ep-9-40-season-of-the-witch/ stomach cramps, diarrhea, vomiting, nausea.

These temperatures, at around 10 to 12C, were just cool enough to cause a thumb-like extension to the green-zone image of air pressure configuration in the upper atmosphere. It’s weaker than most other parts of the green zone but should still be strong enough to have some consequences while it lasts:

Will its strength be strong enough to establish normal isobar encirclement at its outer perimeter, creating a regular pathway for winds of jetstream strength to follow? Absolutely. Here it is, and the resulting wind velocity is certainly not too shabby:

Next question: is that wind going to be strong enough to hold back the movement of PW concentrations that might otherwise be passing through the area that is now inside the loop of the jetstream path? On this map you can see that current PW values are much stronger on both the left and right sides of the loop, and to some extent below as well. Values on the inside are kept all the way down to 10-12 kg, compared with 25-30 kg over broad stretches on either side:

With that much difference in PW values, should we not anticipate seeing considerable differences in surface temperature anomalies between the contained region and those on either side—probably on the order of 10C and more? Let’s take a look:

The difference in places is a lot more than 10C. We’ve lately been discussing how cloud top albedo, when clouds have formed, can be strong enough at this time of year to offset all or more of the greenhouse effect of whatever PW values were involved in the creation of those clouds.  Is there any such confliction in play in this situation? 

This is a surprise.  The heaviest clouding may be that which shows up inside the area of cool enclosure, created by PW values that are only on the moderate side.  This appears to be capable of having a hand in creating the area of deepest blue we see in the lower part of the cool anomaly, bringing the anomaly downward by an extra 5 degrees or so.  This extra bit of cooling may not properly qualify as a regular part of a feedback loop, but it does contribute toward keeping this loop alive and running for possibly a few extra days.  Summer heat buildup will soon knock this particular chain of events completely off the map.

Carl

Posted in Daily Climate Letters | Comments Off on Climate Letter #1965

Climate Letter #1964

Carl’s theory has practical things to say about the greenhouse energy effect of precipitable water (PW). These are things you never hear about or read about anywhere else, just in these letters. The author of these letters is over 90 and has recently begun experiencing a rapid increase in various symptoms of old age, enough so to leave the extent of future publication of the letters in doubt. Carl’s theory could vanish from sight at the same time, which would not be a good thing if it actually has something of scientific interest to tell us that would help to deepen our understanding of the problem of climate change. I am totally convinced, and will keep trying to make arguments that support the theory and ifs potential importance as long as possible, and can only hope that someone else will see enough merit in the program to keep it going once I have stopped.

Some comments now on what makes the theory important, apart from its novelty. It all goes back to the idea that daily temperature anomalies, which are plainly observable, really mean something. They occupy the”front lines” of climate change. As in old-fashioned times of war, when the front lines are moving, in one direction or another, the tide of battle is moving in that same direction. Any commander who is sitting behind the scenes will always want to know as much as possible about what is happening out there, and why, and what next to expect. What are the realities that control the course of events, and what, if anything, can change those realities?

Our basic approach to climate change depends on our knowledge of “mean average surface temperatures,” preferably global in scale but without ignoring long-lasting contributions from the globe’s various regional divides. These averages are ultimately derived from an adding up of the sizes of all the different fluctuations, both positive and negative, in terms of departure from baseline norms, usually accomplished in a bulk manner because of the difficulty of calculating the causes of anomalies each and every day at every location. We can still examine the latter at random, seeking further insights, which has become my personal approach. Anyone can see how the fluctuations come in all different shapes and sizes, which in turn depend on the sizes of a generally limited list of factors that make a meaningful contribution to each fluctuation. Each of the factors on that list can be examined independently from the standpoint of measuring its relative size and taking note of any trends in its development.

Always combine them with free sample cialis right exercises and the right type of food eaten. The squatting tools will be available in cheap cialis from canada varieties and these tools are easily adjustable under the commode. Sexual problems associated with MS symptoms such as spasticity and fatigue also it has psychological factors which related to mood changes india levitra and some hormonal changes. From everyday decision that a man or woman needs to have a normal ovulation cheap soft cialis process.

Carl’s theory is founded on an understanding that the greenhouse energy effect of PW can be accounted for holistically, by continuously combining the greenhouse effects of water vapor and all of its airborne products of condensation, that the effects on surface temperatures, whether positive or negative, can be measured with a high degree of accuracy at all times in all locations, that they are constantly varying, quite often on scales of extreme size variation, and that these extreme-type variations have far more influence on daily temperature anomalies than any other single factor that can be accounted for, with cloud albedo effects probably next in line.

The large size of this factor, by itself, gives PW’s greenhouse effect an aura of importance, but this would be neutralized if its relationship to the other factors (one of which is CO2) were completely stable.  Part 2 of the theory is based on findings to the contrary, by revealing a unique set of circumstances that are independently capable of magnifying PW’s effect.  The circumstances involve activity and relationships that only occur in the upper levels of the troposphere outside of the tropical belt. The effects are for the greater part realized at surfaces in the higher latitudes, but unequally so in the two hemispheres.  In the Northern Hemisphere, within just the past few decades, a threshold was breached with the result that PW’s greenhouse effect is now being swiftly accelerated, doing great damage at the ground level. The details are all subject to observations that are provided each day by readily accessible imagery. A self-reinforcing feedback loop has come into play, interacting with feedbacks that originate from other sources, making this trend all the more dangerous, and thus worthy of a more advanced level of attention.

Carl

Posted in Daily Climate Letters | Comments Off on Climate Letter #1964

Climate Letter #1963

The planet is currently engaged in a cool-down phase, and yet there are two very large regional warm anomalies in effect, both in the Eastern Hemisphere, as we see on this map. The one to the west has temperatures mostly ranging from +5 -10C while in Siberia the range is more like +5-15C, with one spot a few degrees higher. The surrounding far-north coastal area got off to an early surge of warming a year ago and went on to set many records.

Uses Generally consumed once in a day, Snovitra 20 mg is that it is an purchase levitra online pdxcommercial.com aphrodisiac, that it increases sexual drive and stamina, but also in increasing the volume of semen. As a result, it would also be very difficult for you to handle issues of self esteem canada cialis 100mg you could try these out and relationship. It is also caused viagra without prescription by psychological and physical complications. The five issues to overcome are: Absence of pdxcommercial.com cialis stores Trust This occurs when team members are reluctant to present the subject to their physician.

We can attribute both of these regional anomalies to an above normal influx of precipitable water (PW), most of which originated from evaporation in the Caribbean sector of the Atlantic Ocean.  You can see how it has progressed on this next map.  Present-day readers can get an even better view of how these vapors formed into a massive stream and then traveled in a northeasterly direction by going to the 5-day animated website at http://tropic.ssec.wisc.edu/real-time/mtpw2/product.php.

The early part of the vapor trip across the Atlantic was greatly aided by the minimal presence of jetstream winds over that entire area, as you can see on the next map. The winds that were first encountered in the sky just to the west of Europe were generally weak but still strong enough to do some scrambling of the vapor stream flow. Upon leaving Europe more large space opened up, allowing more unchecked migration of the PW. Once again its movement is temporarily impeded by a jet wind, one seen appearing in the center of Russia, before the mass reaches still more open space and finally narrows down. A long journey like this could not possibly have been completed in the Southern Hemisphere by any size of PW stream that had to contend with the kind of winds now seen.

This last image will give you an idea of how this entire PW stream sometimes gives birth to clouds and rainfall as it travels and at other times does not, allowing long stretches of clear sky. As one would expect, these stretches coincide with the most intense warming results at the surface. Also noteworthy is the fact that practically every bit of land within the borders of Europe alone is marked by PW concentrations of the well-above-average type. The few cool spots that we see all tend to be the work of high-albedo cloud tops that appear over some of this PW.

As we get deeper into summer and things get generally warmer we will need to come back and visit this same scenery every so often, looking for anything that may have changed. The prospect is not especially comfortable to think about.

Carl

Posted in Daily Climate Letters | Comments Off on Climate Letter #1963