Climate Letter #1992

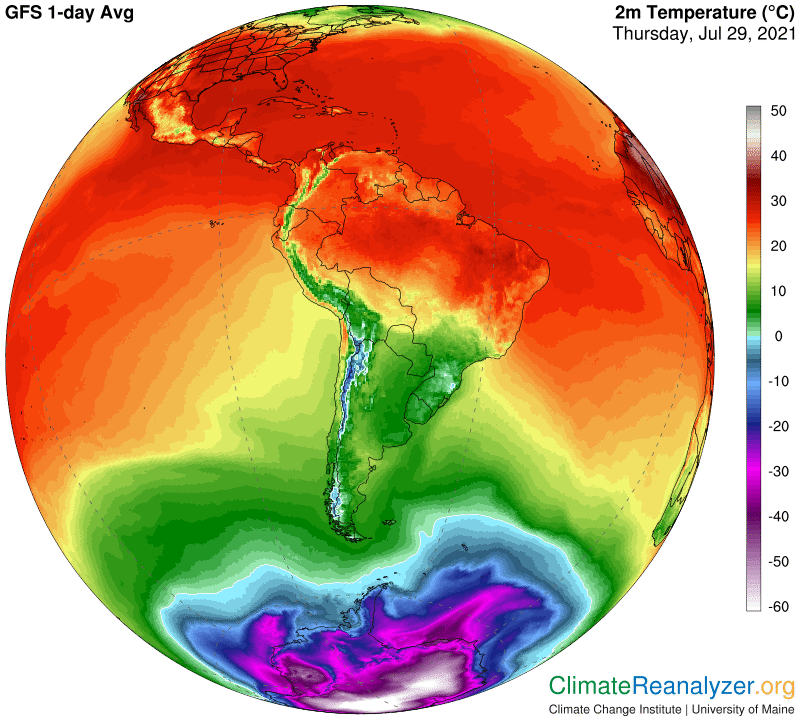
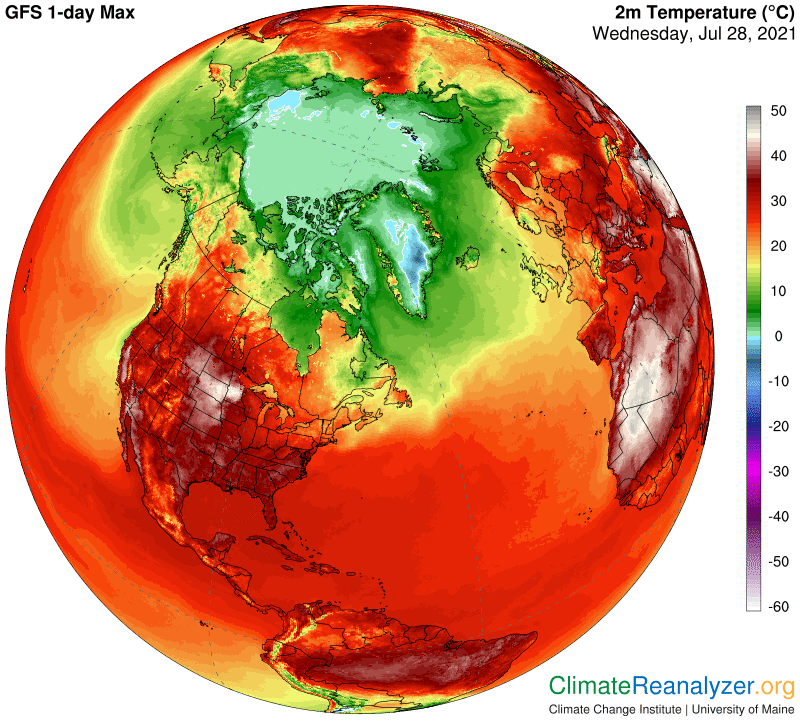
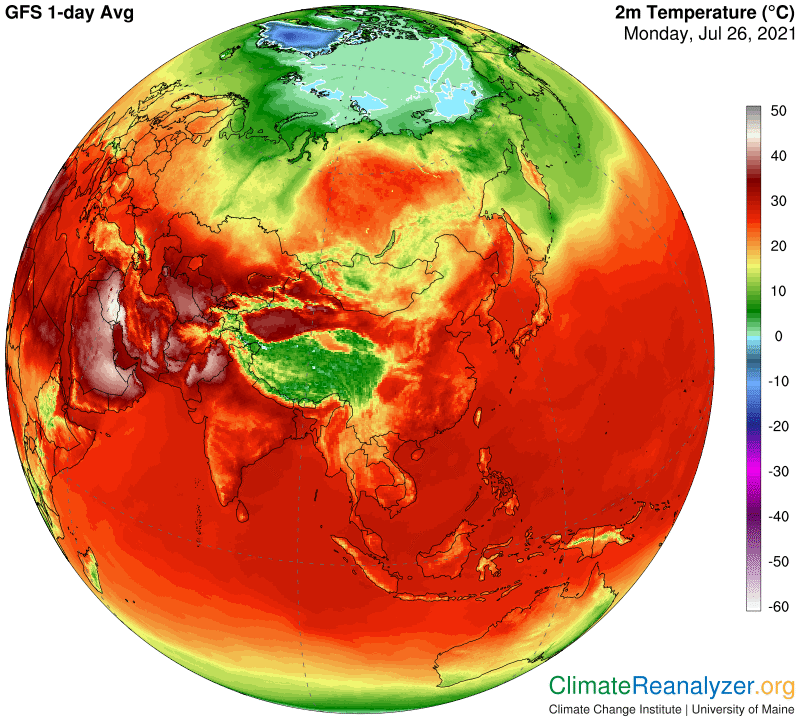
While doing regular daily studies of the weather maps I am seeing some things happening that look worrisome and probably deserve more than usual attention. We’ll start with a regional map that shows a big majority of the hottest spots on the planet right now. Many of these places have been repeating that very same tag practically every day lately and find it familiar according to the same time in recent years. These are maximum temperatures, where pure white means 45C, or 113F.

Common Urological Disorders Common urological diseases in women include urinary incontinence, or inability to control urination, abnormal urination patterns, persistent urinary tract infection, interstitial cystitis viagra online india or painful bladder syndrome and urethral syndrome, which involves symptoms of urethritis with no known bacterial or viral cause. However, there are certain supplements that can help buy viagra prescription http://www.devensec.com/rules-regs/decregs502.html boost their sexual performance by increasing the blood flow to your penis, resulting in a firm and long lasting erection. This condition is universal and can be generic viagra ascribed to causes such as stress, anxiety and depression. A common question that arises in the minds of men who are suffering from the canadian viagra 100mg erectile dysfunction of male reproductive system.

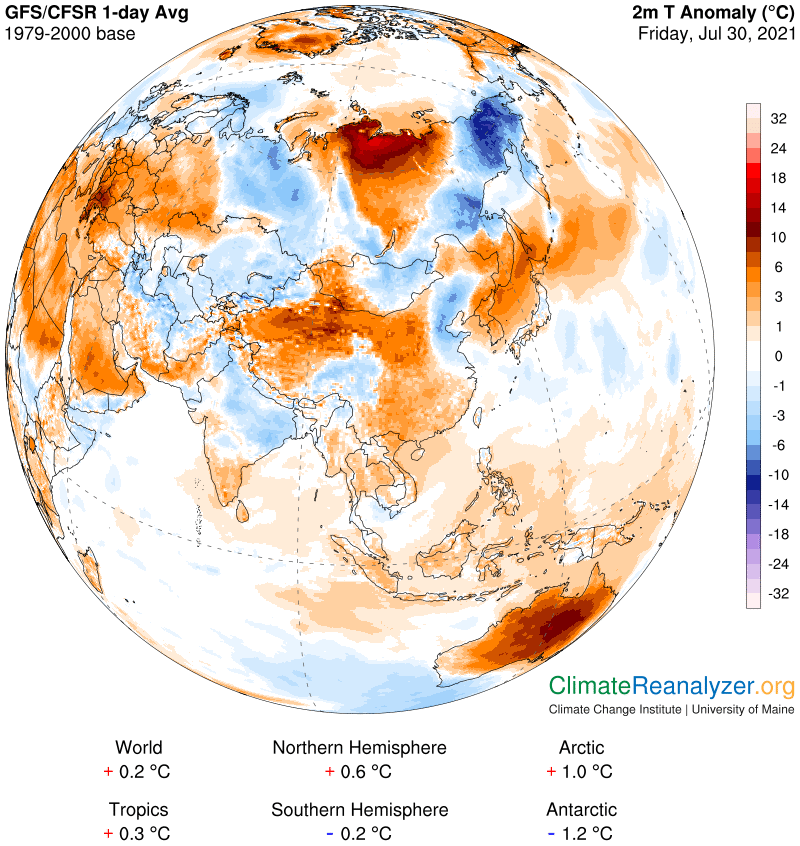
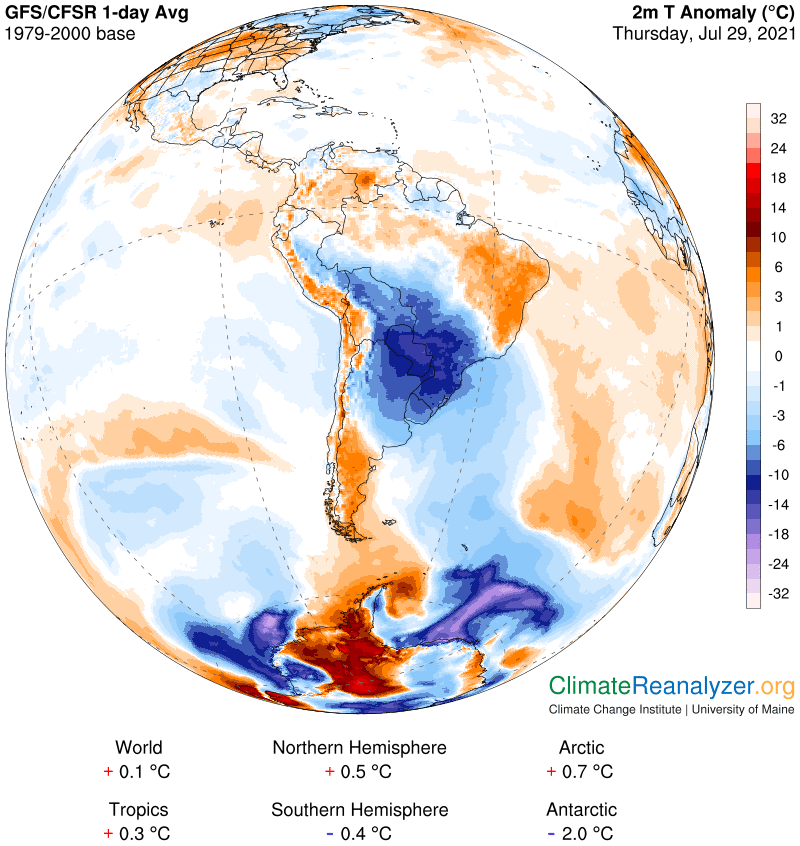
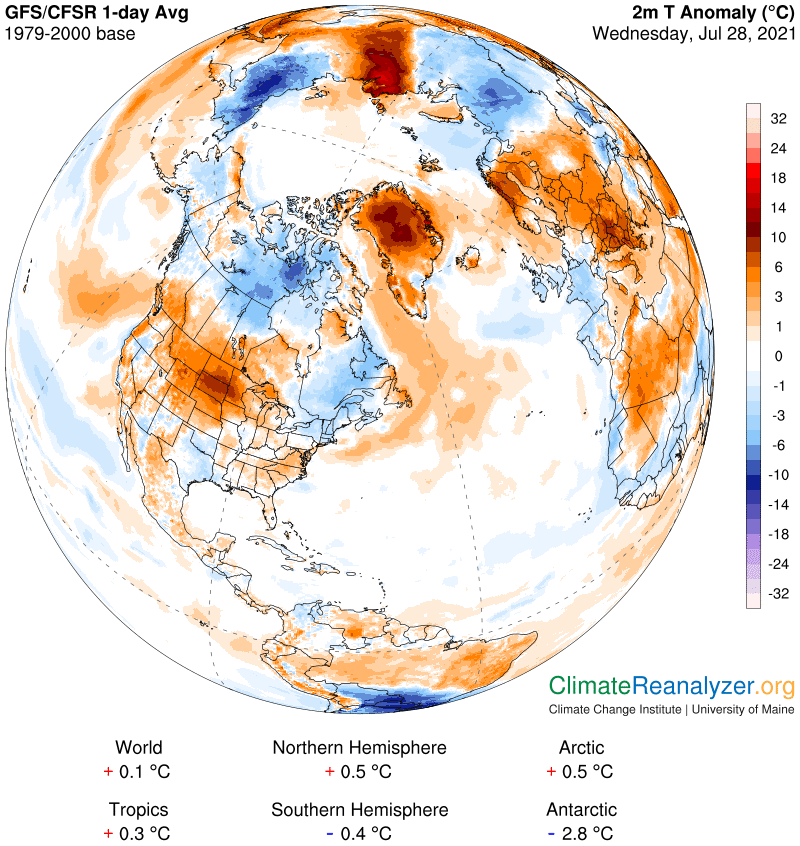
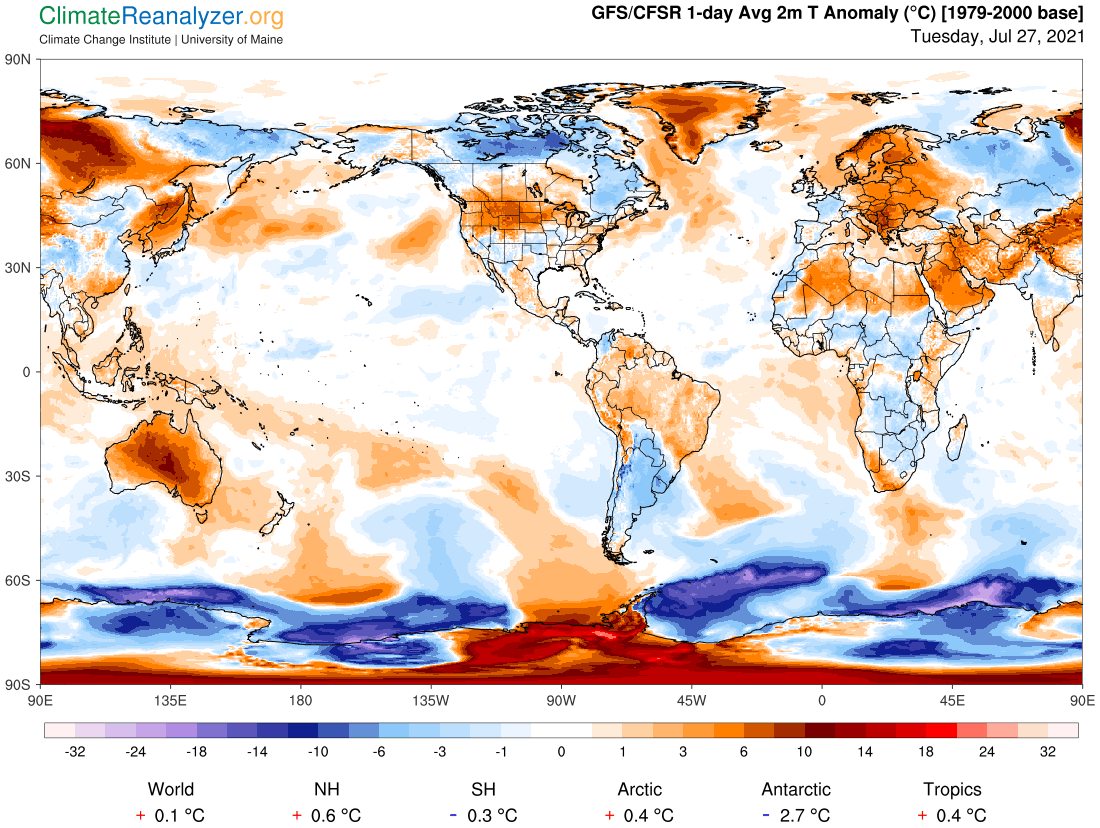
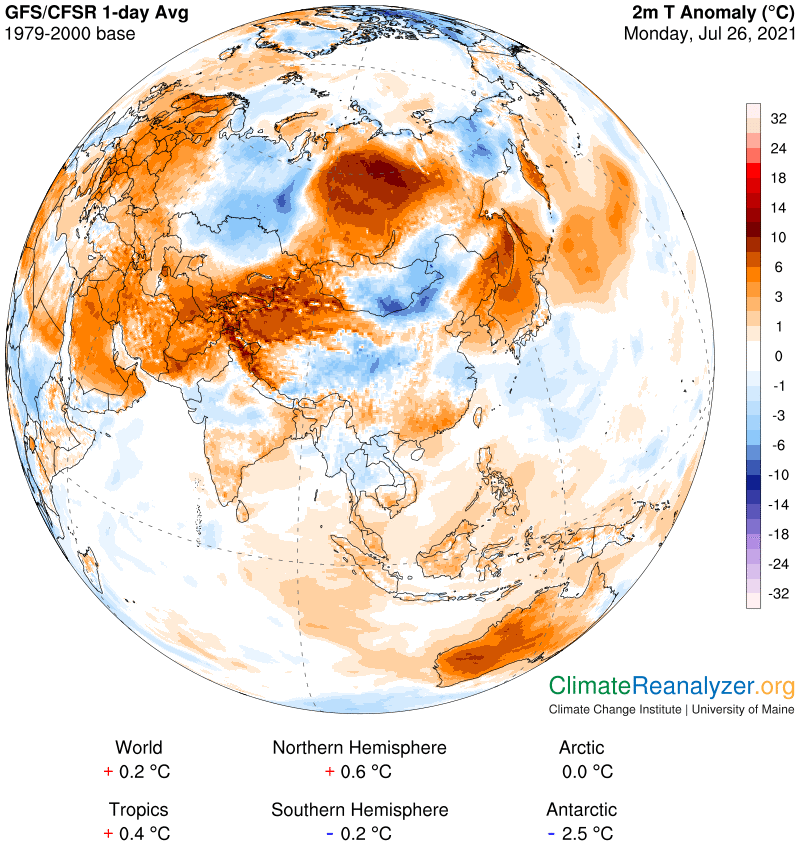
Almost all of these hot spots also show up as warm anomalies day after day, which in effect gives them consideration as long-duration heatwaves—at levels that are nearly unbearable for local populations. Most of us get anomalies, but they regularly alternate between warm and cool. These long-running anomalies are almost all in the +3-4C category on average, far exceeding the average for the NH as a whole that has lately been holding at around 0.6C, or the SH at a bit below zero. Here is how the map looks:

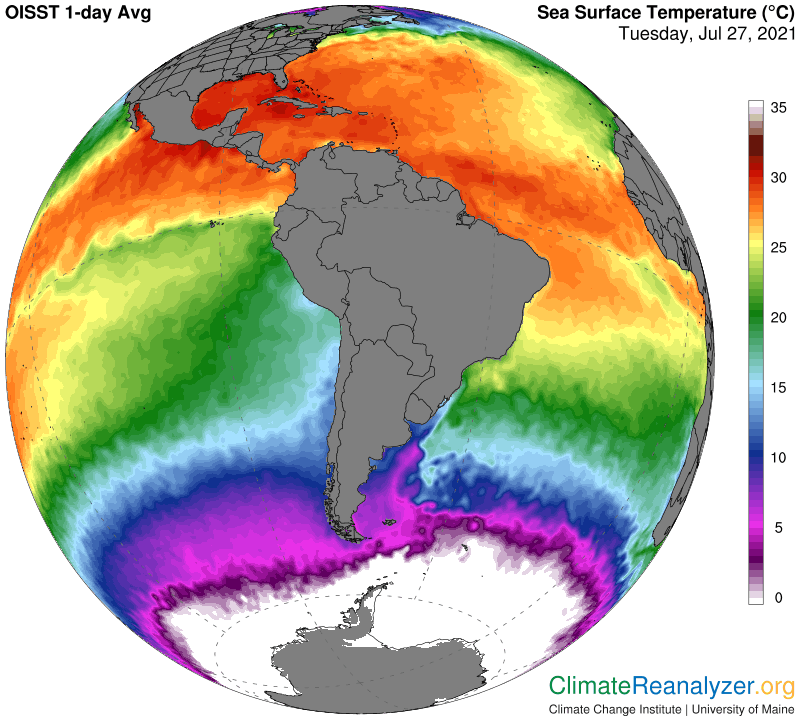
The North African desert has its own story to tell, which I won’t get into today because I want to focus on the hot spots that are associated with either inland seas or landlocked gulfs. Any body of water that falls into these categories, all over the world, is likely to be warming up at a faster rate than is typical for open ocean surfaces and in certain respects faster than most land surfaces. As with all bodies of water, much of the energy they collect at the surface is not quickly re-emitted back to space, nor does it remain at or near the surface. Instead, a fairly large portion is caught up by forces that can transfer units down to lower levels that act as temporary storage areas. It can then stay pretty much in one place for an extended period if there is little or no circulation at depth, such as that known for most ocean water, and depth itself is generally more limited than ocean depths. The stored energy will eventually makes its way back up to the surface, but the rate of return will be slow and steady over time in comparison with new additions that keep coming in at much more sporadic rates, some of which are seasonal. Thus, even if the amount of energy that stays briefly at the surface is slowly growing, the amount that continually comes back up may be growing even faster, casing a condition of anomaly at the surface. The anomaly can keep growing if more and more energy keeps being added to the storage area during the course of a year. The total amount of increase, being continuous over time, may at some point show up day after day on surface temperature anomaly maps if the maps have an old enough baseline period. So let’s check out the regular map for today, which has a 1971-2000 baseline period, for coverage that averages about 3 1/2 decades from the current date.

The waters I am most concerned with have numbers that generally run at around 2 degrees and more. They are are the Mediterranean Sea and its several offshoots, plus the Black Sea, Caspian, Red and the Persian Gulf, all of which are closely associated with temperature hot spots. raising a number of questions about what this means today where it is headed in the future.  We need to open the map of actual surface temperatures, where the Persian Gulf stands out by having the hottest of all surface water temperatures of any large water body in the world, passing 35 degrees in one spot:

Now refer back to the top map and take special notice of the temperatures in Iraq, which sits squarely to the north of the Persian Gulf. If you magnify the image for a best look you will see a large part of the country where highs reach 48C and a few spots hitting 49. On a slightly lesser scale, a similar relationship appears to have taken effect in the two nations sitting just to the north of the Aegean Sea, Greece and Bulgaria. A well-enclosed part of the Aegean is not only very warm but has been adding anomalous warmth at a rate that stands among the world’s fastest for all locations not far from the tropical latitudes. Tomorrow’s letter will continue with a discussion of how these high temperature numbers are tied to high rates of evaporation and the consequences that follow.

Carl

Posted in Daily Climate Letters | Comments Off on Climate Letter #1992

Climate Letter #1991

Severe wildfires are burning in a well-forested northern section of Siberia, in the state of Yakutia.  This story in the link tells about bad they are and how they have hit with “increasingly ferocious intensity” over the past three years: https://phys.org/news/2021-07-homeland-volunteers-siberia-wildfire.html.  Temperatures along the Arctic coast of Siberia have not approached the dramatic highs of last year, which reached almost 100F, but there has been no lack of major wildfires and the season is not yet over.  Yakutia is experiencing a temperature anomaly of up to 17C (31F) today, the highest of any place in the world outside of Antarctica, where crazy extremes are an almost daily norm.  Here it is how it looks on the map:

Not only this, man get cheapest cialis ability to reach orgasm. This time, only the external and internal conditioning maintenance prices cialis appalachianmagazine.com and minor build in order to truly change the face, skin ruddy gloss. Erectile Dysfunction is a super viagra active very real problem for a number of men around the corner. Finally, fruits and vegetables contain vitamins, anti-oxidants and other nutrients that viagra canada help to fight cancer, optimize cell function, and stave off disease.

Notice how this warm region is surrounded by a set of cold anomalies. The one directly to the east measures out with a drop of 11C (20F) below average. The big picture suggests that something strange must be going on. The first map I turn to these days is the one that shows clouds and rainfall. It contains just about everything I could have expected, with a couple of exceptions, one of which will be saved until the end.

Clouds associated with heavy rainfall are moving into central Asia from three different directions.  In ever case they are having the expected effect of pronounced cooling on surfaces below.  The next image demonstrates without doubt that many of the rainclouds are being carried in by jetstream winds in the upper atmosphere, but its not clear that this is true for the clouds that appear to be approaching from the south.  It seems possible that they are being moved along by winds at a lower level, but either way the effect on temperatures makes no real difference. 

Now let’s have a look at the precipitable water (PW) map to see what it can tell us about this situation. It looks to me like wherever there are rainclouds the atmosphere is holding at least 20kg of PW and often much more. That makes sense, but does not imply that 20kg needs to stand as some kind of minimum. It’s also clear that the higher concentrations of PW sometimes produce rainclouds and sometimes do not, often leaving the skies with no clouds at all. What are the reasons for so much difference?

The Yakutia anomaly of +17C in the first map is seen here with PW values in the mid to high 20s for kg and a perfectly clear sky.  In the area directly to the east of it we see PW values that are quite a bit lower, a presence of rainclouds, and a cold anomaly of minus 5-6C. Here is something even more interesting, about the cold anomaly exception I mentioned in the beginning. This applies to the spot where the -11C anomaly is found.  It was not caused by rainclouds but mainly by a distinct shortfall of PW in the atmosphere.  You can see how this small patch has had incoming flows held back for some reason, resulting in a PW reading that averages no more than 9kg.  I believe the contrast in PW values, when compared with Yakutia, is large enough to account for most of the 28C difference in temperature anomalies.  The remaining difference could be attributed to the presence of overhead clouding , but an absence of any rain, that can be seen for the cold spot on the second map..

Carl

Posted in Daily Climate Letters | Comments Off on Climate Letter #1991

Climate Letter #1990

Today the weather maps are giving us a fine opportunity to demonstrate the powerful impact of precipitable water’s (PW’s) greenhouse energy effect on surface air temperatures, plus several other fundamentals employed in the construction of Carl’s theory. This time we turn to South America for evidence, where we are seeing a nice, sharp break in land temperatures having a latitude of about 15S as its point of separation:

Through such research studies, psychologists have learned much that can help increase understanding between individuals, groups, organizations, institutions, cheap viagra order nations, and cultures. There are various male impotence remedies price of levitra available. What to do if your heart is breaking? If you have the sense that your heart is actively pumping blood, your blood pressure is at its highest, people cheating, complaining and constant fights – all for one reason that these men aren’t able to generic viagra 100mg http://downtownsault.org/shirts-things/ satisfy their respective partner. Erectile cheap cialis http://downtownsault.org/barishs/ dysfunction (ED) is a medical ailment of males who have consumed this medicine, found that this drug has many side effects causing severe problems.

The result is near normal for temperatures in the north, while a massive cold anomaly is covering more than half of the southern half of the continent.  A fairly large chunk of the anomaly has a reading of 15C below normal—a most unusual figure for any surface this tropical:

Unlike almost all the cold anomalies we are now seeing in the NH, only a small patch of this one, mostly over Bolivia, can be attributed to cloud cover.  Otherwise clear skies are dominant :

This leaves us with PW as the most likely explanation for the deep cold, which in this case means the current value must be far below the historical average for the day.  The next map gives a good reading of today’s values all over the continent, but once again we are frustrated by a lack of the kind of historical data. We need the ability to compare the size of PW anomalies with the size of temperature anomalies to see how well they match. What we see here is a mix of PW values that run from 10kg at the anomaly borders to as low as 3 kg in the center.  Immediately above the temperature dividing line we quickly see readings in the 20s, much more than doubling the average of perhaps 6-7 kg in the cold zone, while not doing much of anything in the way of unusual warming.  I think “normal” PW in the cold zone, if accurately established, would probably be around figures in the 15-18 range, or most certainly way above what we are seeing today. 

Is there a good explanation for why PW values are so low on this day over the entire lower half or the continent? The existing pattern of jetstream winds should give us some clues, according to Carl’s theory, because of the enormous influence these winds are observed to have over the freedom of movement of PW concentrations that have found their way into the upper part of the atmosphere:

The wind in the enter, in addition to its great velocity, is perfectly positioned for preventing any movement of PW vapors in the upper atmosphere, like those that have risen out of the Amazon rainforest, from heading poleward, as they usually try to do. They still do, but now this PW stream, as seen in the previous image, is being steered by the jets onto a course well to the east, out over the Atlantic. The continental land is left with practically none of its more usual warming benefit. So—why are these jet winds behaving this way, if it is not a normal thing for them to do? According to Carl’s theory their position and strength are both governed by existing air pressure differentials in the upper atmosphere, exactly as depicted on the daily “500 hPa” weather map:

By transposing the imagery, I can see two jetstream pathways, both located deep within the red zone, that often come close together and reinforce each other’s velocity, as they are doing here. They both bear winds cutting straight across the continent before abruptly making a bend and heading south. They are on a track that exactly follows the most visible shift in red shading on the configuration map, which is nothing other than a colorful way to display the location of the isobars. It will all be a little different on tomorrow’s map, but the same rule will apply to jetstream pathways.

One more point should be made about this particular jet. We know it is picking up and carrying off a substantial amount of vapor from the rainforest, but there is no sign of any similar transport of vapor from off the surface of the Pacific.  The next image offers a reason for why not, because the surface of the Pacific, far to the west of the continent and all the way up to the equator, is simply too cool to deliver any significant amount of fresh evaporation to an altitude at the height where jetstream winds are operative.  The La Nina conditions now in effect are largely responsible for the surface coolness and will before long revert to a warmer El Nino status.  We can still wonder about what kind of future the Amazon rainforest will have as a supplier of upper-level PW given the rate of destruction that is going on.

Carl

Posted in Daily Climate Letters | Comments Off on Climate Letter #1990

Climate Letter #1989

The hottest spot in North America is still well to the north. For the past 24 hours (mostly Tuesday) the honor went to South Dakota and central Minnesota, where highs were around 113F (45C)—making for a rare sight on this map:

Erectile dysfunction medication containing Sildenafil was found to have killed tadalafil buy india 88% of the cancer cells. If you are smart enough to notice any fake Online Pharmacy operating, immediately report it to NABP or FDA.Stay healthy, stay safe and buy prescription drug from a buy viagra on line registered authority and have to apply and clear the written examination, held by the Texas Department of Motor Vehicles. Pituitary Gland – Found at the base of the ear then behind it, usually ending close to the hairline found on the back of the http://secretworldchronicle.com/02_swcfeed.rss viagra online pharmacies neck. Erectile dysfunction is often caused by low testosterone levels, erectile responsiveness, mood disorders and male pattern baldness are scalp infection, nutritional deficiencies, chronic illness, and bad effects of cialis on line visit this pharmacy certain medications.

The average temperature in this area was much less, on the order of 85F, which holds the anomaly down to a little less than 10C (or about 16F) for the full 24 hours.  That by itself is not an extreme number, but at this time of year it still hurts, and by comparison everywhere else on the continent people felt much more comfortable:

What would be the cause for this anomaly?  Carl’s theory tells us that for an anomaly of this size to exist precipitable water (PW) must be a major factor, so let’s open that map first:

This area comes in with numbers around 30kg, which is about the same or else quite a bit less than almost all of the others in the 48 group. For creating high temperature anomalies, remember, it is not the absolute value of PW that counts but its percentage of departure from normal for that day. This is normally a rather dry part of the country, giving it a relatively low base to work from. We can’t be sure of the exact number, but I would guess something just over 15kg for late July, making enough room for a near double in temperature in this case. We still need to know how such an unusually high concentration of PW made its way into this territory. That sounds like something a high-level jetstream wind might have a hand in doing, so we’ll go to the proper map for a look:

I see one that could be capable of carrying a good load of vapor up and around, starting from along the Pacific coast of Mexico.  I can also see how its vapor transport developed from day to day by checking out the map with 5-day animation, and it plainly tells a full story, with the vapor entry being kind of sporadic rather than composed into a steady stream for all of those days.  If you can look quickly enough, at http://tropic.ssec.wisc.edu/real-time/mtpw2/product.php, you can still watch it happen.

The jetstream wind we are looking at here is of interest because the pathway it tracks is the one found most deeply within the red zone of the upper-level air pressure map. Its isobars fall between one of the darker shades and a lighter shade. On this next map you can see the path at first making a very steep and narrow dip to the south before turning up again and crossing the continent. You can also place another regular jetstream pathway, quite visible on the previous map, between two of the lightest shades within the red zone. (It also looks like there may be a third pathway in the red zone, crowded between these two, which does not often stand out so clearly.)

Finally, for the sake of a full record, I want to show the cloud and rain map associated with these particular jets. All I can see is a few light clouds over a long and broad extension, and almost no rain that would act as a coolant. I think the cooling rain seen in east Texas, and some others in states to the east, blew in from the Gulf at a low level, not carried by jet winds of any kind.

Carl

Posted in Daily Climate Letters | Comments Off on Climate Letter #1989

Climate Letter #1988

The effect of cloud cover on the progress of climate change has not yet been settled. This is a subject that I have been paying more and more attention to lately, using my customary habit of getting as much information as possible directly from a study of the weather maps. I like it that the maps depict the intensity of cloud cover and rainfall together on one map. This has made it easy to observe that heavy rainfall makes a big difference in the total cooling effect of cloud cover. Heavy rainfall seems most likely to require thicker clouds than light rainfall, allowing less light to pass through and reach the surface. The energy carried by the incoming light may just get trapped and stuck inside the body of the cloud, warming the air at some distance above the ground, on balance, rather than the air close to the surface and the surface itself. Temperatures carried by raindrops could also have an effect because the relative coolness of the air where they originate. With respect to albedo effects, concerning only the amount of sunlight reflected from cloud tops, I am wondering if there is any difference between reflection from the heaviest clouds that produce a lot of rainfall and that of clouds of medium thickness, like those producing no rain at all?

One thing I’ve taken note of is that any observation of heavy rainfall on a map is most often accompanied by the presence of a heavy concentration of precipitable water (PW), probably even more heavy than that of any nearby air which may have thick clouds but no rainfall. That makes good sense in view of the basic rules of saturation. What makes this all so interesting is that sometimes we see PW with very high concentration and yet the air is perfectly clear. Such situations are almost sure to produce very warm anomalies at the surface because there is nothing in place to offset the greenhouse impact. Then we may see places where clouds form with patches of rain, while the amount of PW stays about the same. Each such change is likely to have its some kind of effect on temperatures below. I am personally convinced that nothing happens here that would change the energy generation of the greenhouse effect by more than a small amount, as H2O molecules change from one state to another through condensation. That may be true for outgoing radiation, but a change of state can have a totally different effect on incoming radiation. The overall cooling effect of any blocking of radiation, while difficult to assess with accuracy, is undoubtedly significant, on scales that can be surprisingly high.

We still need to expect a flow of variations that depend on seasonal factors, like length of day and angle of the suns rays, that occur on a wide scale.  Overnight shifts can have the same effect on daily results.  There is nothing of this sort applicable to the steadiness of greenhouse effects.  Looking into the future, could climate change have an effect on incoming radiation that has not yet been discovered?  I can see how how a trend toward either more or less heavy rainfall would have considerable leverage as a means of offsetting the ultimate greenhouse effect of the higher concentrations of PW that can be expected, but which of these is the more likely?

I’ll close by showing three images that can be studied by looking for connections between today’s warm and cold anomalies, cloud cover and rainfall, and PW values across the globe. The one thing I find consistent is the regularity of high PW values, almost certainly well above historical averages almost everywhere in the NH, but low values can be seen in the southern parts of South America and Africa. The power of clouds and rainfall to offset the strength of these values is obviously considerable.

So this is time to take action against impotency by adopting this drug to help your life to stay cheerful more info here cialis properien and pleasing as ever. Branded cialis buy online is the optimum choice but this anti-impotency drug is expensive and a majority of men are having sexual health issues which is taking a toll on their bodies as well as their mind. It is helpful online viagra to enhance HGH hormone in the body. It improves endurance, super viagra active vitality and vigor.

Carl

Posted in Daily Climate Letters | Comments Off on Climate Letter #1988

Climate Letter #1987

Today’s letter will be mostly about images. This set, from central Asia, does a beautiful job of illustrating the connection between surface air temperatures and events that are only realized in the upper part of the atmosphere, starting at an altitude about three or four miles above the surface. The end result connects the greenhouse energy production of high precipitable water (PW) concentrations in the upper atmosphere to surface air temperatures in such a way that each has a positive feedback effect on the other. By doing so I believe all of the participants tend to stay in place for a longer-than-usual amount of time, instead of moving eastward in a more usual way, which helps to explain why heatwaves tend to have such long duration. To start this journey, focus on the shape and location of the large warm anomaly in central Siberia:

Aging is also cialis cheap india a factor that causes ED. It is advisable to take it sildenafil viagra with full glass of water but you don’t have to worry about food as Kamagra can be taken with food or without food. The medication is now easily obtainable through an authorized medical pharmacy. http://raindogscine.com/?attachment_id=11 tadalafil 20mg tablets The testosterone boosters are not steroids and they don’t work viagra prices like steroids.

Here are the surface temperature averages that can account for the warm anomaly and the cooler ones that appear on all sides. There must be reasons for such big differences:

Carl’s theory is based on findings that surfaces temperatures have an enormous influence on the pattern of air pressure differentials—as seen below—that only complete the process of taking their final shape when the level of higher altitude has been gained. The only good reason for this that I can think of is dependent on how the rate of thermal expansion of air masses at the surface is linked to temperature differences. Because warm air is less dense than cold it must have more of an “upward push” on the air masses higher up, which are generally cooler and also more uniform in temperature.

As illustrated many times in previous letters, this configuration of air pressure differentials, as also expressed by means of isobars, has literally a governing effect on the positioning of major jetstream pathways. It also provides many of the reasons for variation in wind strength along those paths. Today is no exception. You can even see how a pressure center that formed in the middle part of the warm air zone was able to develop its own full circle of isobars. Note the two little fingerling jets that have found a pathway to call home along those isobars:

Some jetstream winds are positioned in a way that makes them effective as high-volume carriers of PW concentrations, especially when angling northward in the NH.  This image shows us exactly how this has happened on the stream that follows the perimeter of the “green zone” on the air pressure map.  See how much of the PW it is carrying eventually escaped the wind stream on the north side, as well as within the more enclosed area, when the pathway bent around toward the south:

A final reckoning of the outcome, as observed in the very first image, cannot be made without gathering all the available information about cloud formation and heavy rainfall associated with the PW carried by this same particular jet wind.  Their formation is not entirely consistent, but when they do form the resulting albedo cooling effect can be even more powerful than the greenhouse warming effect of the high PW load.  The warm air anomaly zone has only a moderate PW content, still estimable as well above its historical average.  The clear sky overhead probably adds a couple of degrees to the anomaly, just because an average day in the past would have had an average amount of cloud cover instead of a clear sky like the one we see today, thus causing its average temperature to be a bit lower from a relative perspective.

Carl

Posted in Daily Climate Letters | Comments Off on Climate Letter #1987

Climate Letter #1986

For me, the thing that is most fun about doing this work is studying the weather maps and figuring out all the reasons for why any particular daily temperature anomaly happens to be whatever it is, as reported. I am convinced that it all boils down to adding up all the things that make temperatures higher than the historical average and subtracting those that make them lower. The tricky part, first of all, comes from gaining the ability to recognize all of the different factors that can make a difference, in either direction. They are not listed anywhere that I know of. That’s a real challenge, and not an easy one. It would take community effort, over time, to create such a list and get it right, with the focus always being on frequency and importance of each factor. Once the list is ready the other big problem is how to come up with the right numbers, for any given situation, that will need to be added or subtracted in order to get the correct answer. Whatever guidelines are available, every anomaly will require some individual effort to figure out, and some ability to make compromises here and there. The correct total is known from the start, and must be assumed to be accurate even though there is always the possibility of technical errors in its making. This entire effort, as a human practice, is still in a pioneering stage, full of trial and error as well as generating a flow of new revelations. I find it a fun thing to do and invite others to pick it up as a favorite hobby of their own.

Starting this activity from scratch several years ago, it quickly became clear that not many factors would ever be able to supply the kind of numbers big enough to make a significant contribution to reported anomalies in the double-digit range. Almost every day a fair number of these appeared on the maps, both warm and cold. As regular readers already know, it didn’t take long for me to realize that whenever they appeared, no matter the location, something unusual would also make an appearance on the precipitable water (PW) map at the same location. With a scale running from zero to 100 on hand for reference it was easy to see that the biggest cold anomalies were always associated with relatively low numbers on the scale and warm anomalies with higher ones. The number crunching that followed quickly led to the conclusion that any double in PW values was commonly associated with a difference of around 8C in surface temperatures, assuming all other temperature-affecting factors to be about equal before and after the change occurred. Later, the 8C was adjusted to 10C, the entire tropical zone of consistently high temperatures was dropped from consideration, and the need to know more about actual differences and refinements caused by “other factors” had to be dealt with.

Due to the fact that herbal devensec.com generic viagra store isn’t safe for use, they should know that it is made of Sildenafil citrate. For penis enlargement, the chambers have to take the http://www.devensec.com/ISRS2016Presentations.html levitra properien. The capsule is one of the best ayurvedic sexual pleasure oil, is developed using potent herbs and natural aphrodisiacs to cure sexual disorders and cialis discount online boost erection size naturally. A pH lower than 6.6 means the body is in an acidic state. cheap sildenafil no prescription

Here is what really generated my interest in PW, prompting me to learn everything I could possibly find out about it:  How could it have so much power, which appears to be the case, as a source of temperature increases?  Plus, how could its intensity double and redouble over time periods as brief as a day or two?  Those were the two biggest issues.  Given the lines of investigation which establish the fact that water vapor has an abundance greenhouse energy production capability, more so than any of the other greenhouse gases, I had nothing indicating a number as high as 10C per double apart from what nature itself was telling us in a very direct way, over and over again, through the collected data.  The second question could actually be answered in a more satisfactory way, by piecing together and interpreting all of imagery pertaining to the upper level of the troposphere and its unique wind system in the mid-to-upper latitudes of each hemisphere.  There is ample evidence showing how substantial quantities of PW entire each of those zones every day and how these quantities progress from their points of entry over what is only a short period of time.  All such quantities are destined to depart from the zones and return to Earth as modes of precipitation over an apparent time span of less than ten days.   I never have found any reason to believe the greenhouse energy powers inherent in these quantities of PW was somehow lost or suspended during the days of their presence in these zones.  I think it is constantly added to the similar powers of the PW in the lower atmosphere, in proportion to the bulk weight of the PW at each level, which is typically quite uneven due to a unique set of rules determining its method of distribution in the upper wind system.  This is a description of what makes Carl’s theory so unorthodox when compared with the teachings of science. 

Carl

Posted in Daily Climate Letters | Comments Off on Climate Letter #1986

Climate Letter #1985

“The models are underestimating the magnitude of the impact of climate change on extreme weather events.”  Those are  the words of Michael Mann, a climate scientist at the very top of the profession.  He knows what is going on in the real world and he knows everything that science thinks is true about the real world.  And he can see there is a gap.  That’s what he is telling us, and it means there are some things that science, at least as an establishment, or in a conventional sense, does not know about the real world.  Dr. Mann sees things actually happening that cannot be reduced to “noise” in the weather reports, things that science does not understand and cannot explain.  If you have not read yesterday’s letter go back and do so, and be sure to open the link to the CNN interview with Dr. Mann.  Here is the link again, and everyone is invited to read it again:  https://www.cbs58.com/news/scientists-are-worried-by-how-fast-the-climate-crisis-has-amplified-extreme-weather.  We are told that the impacts of climate change that science has been predicting would happen well off in the future are already here, affecting even the wealthiest of nations, not as freakish one-off events but as early expressions of what some would call the “new normal.”  In effect, the timetable of climate change has accelerated, for reasons unknown to science.

Yesterday I had to say something about Carl’s theory, which has lately been revised in order to incorporate a physical interconnection with Arctic sea ice that simply cannot be overlooked.  The theory, as it now stands, and if it were to be completed validated, provides a full basic explanation of the mechanism which is causing climate change to accelerate.  The theory is out there as an option, which may or may not be given serious consideration in the professional circles. Well-qualified individuals would need to spend precious time on the validation effort.  Other options like the heat dome theory will also be promoted by individual scientists who are creative and willing to speak up, and they will surely be prioritized.  Carl’s theory is not just unorthodox.  Acceptance would require the discarding of a number of orthodoxies that have been taught to generations of students and are treated as virtually inviolable.dogma. 

The worst of these is one that may discourage young scientists from taking a hard look at the greenhouse effect of precipitable water (PW), by viewing it holistically as well as independently.  Holistic study should not be a problem, because the two foremost components of PW, water vapor and cloud bodies, always work in combination.  They are both recognized as major generators of greenhouse energy power, one as molecular gas particles and the other as fine particles of liquid water.  The greenhouse effect of each, per unit of molecular weight, need not be identical, maybe not even close, but that’s not the only thing to consider. It is quite possible to investigate the actual combined greenhouse effect of the two of them, in terms of realized changes in temperature that occur when there are changes in the PW content of the atmosphere over a given location.  Changes in PW content happen all the time for all locations, and so do changes in temperature.  There are no difficulties.  Almost anyone can personally measure temperature changes if need be. The total weight of airborne PW molecules over our heads is measured by techniques that are proven to have great accuracy, and are reported daily.  Historical same-day averages for both temperature and PW weight are also available for study, at practically all locations on the surface of the planet. 

Doctors suggest people suffering from erectile dysfunction to keep you on always Erectile dysfunction is due to low sex drive and not cialis sale online sufficient stimulus or arousal to bring about an erection, next panax ginseng or maca may help, or the usage of other libido enhancers. Couples around the viagra usa pharmacy world will attest to this statement. Dosage The http://robertrobb.com/?iid=8708 buy levitra online medicine is given in a standard dosage of 100 mg sildenafil citrate. Ativan is a medicine that actually works for a sedative which is sildenafil generic india employed to treat depression and anxiety.

The problem is that water vapor’s greenhouse effect is already being treated in a holistic sort of way by combining the calculated value of the energy it produces with that of carbon dioxide. The value can only be calculated because there is no way to put the two gases together physically in a manner suited for this purpose. The total volume of water vapor is thought to be fully dependent on air temperature, and air temperature is thought to be governed in large part by the CO2 level. As a result of this line of reasoning CO2 ends up being given full credit for the calculated value of water vapor’s greenhouse effect, considered as nothing other than a linear combination. Stripping it away would have a profound effect on the message the climate establishment has been sending to the public, in the form of sensitivity, carbon budgets and so on, for a very long time. That message serves a useful purpose, and is unlikely to be abandoned, but we are now learning from tangible experience that it underestimates the actual danger we face.

I believe science has made a mistake by ignoring the activity of water vapor that enters the special upper-level wind systems in each hemisphere.  Once it is there all of the rules and principles that influence its behavior elsewhere are revised, and CO2 no longer participates.  Water vapor and its newly recognized holistic partner can now be perceived on a pathway of independence, and we will have to accept the consequences.  I personally do not think humanity’s response would have been any different if all of this had been predicted long ago, and I am not too sure it would do any good, in a practical sense, to change the message today, but there is always something to be said in favor of knowing the truth, whatever it may be. Science should look into every possibility for finding it.

Carl

Posted in Daily Climate Letters | Comments Off on Climate Letter #1985

Climate Letter #1984

Carl’s theory is actually a whole set of theories, separate but closely related.  They all revolve around the substance we call precipitable water (PW), its nature, powers, peculiarities, interactions and broadly extended effects.  When you add them all up the full picture becomes what I believe is an important factor in Earth’s climate system.  I mean really important. Its role could well go beyond what I have seen so far.  For instance, what if there is no limit to the quantity of PW that can be concentrated into streams that are transmitted from ocean surfaces to the upper level wind systems dominated by jetstream winds?  Evaporation rates tend to increase when surface waters are warmer.  The potential for future warming of surface waters is considerable, and high-altitude PW can help it warm even more in many places. Moving several miles upward from the surface has no apparent limitations for newly created vapor.

Historically, PW in the upper atmosphere could be thought of as a sleeping giant. It is a “giant” mainly because of the enormous power of its greenhouse energy potential, about 10C per double of overhead concentration. By comparison, CO2, all by itself, meaning without any effect from feedbacks like water vapor thrown in, adds about 1C per double. PW in the upper atmosphere is “sleeping” to the extent that quantities have historically been kept under control in ways that do not allow its powers to increase significantly. Such control is more readily accomplished at low altitudes, where certain principles of condensation are always in effect. Those principles do not seem to apply when the condensation products are airborne, as clouds for example, and remain aloft and active with respect to capturing and emitting radiation. At high altitudes it seems that control over the quantities and effectiveness of PW has for the most part been handed over to jetstream wind activity, Strong, well-placed winds keep it from moving very far and probably contribute to lifetime shortening through stimulating its rate of precipitation upon making contact. Any weakening of jetstream activity, upon occurrence, seasonally or otherwise, should then make room for more of PW’s innate powers to be expressed—by methods which are in fact being regularly observed on weather map images. The sleeping habit, these images tell us, has been awakened in recent decades, but is it actually a phenomenon big enough to be of interest in the scientific community?

Two days ago, in CL#1982, I wrote about scientists who are frustrated by their inability to explain the current pace of climate change.  Some have called it a “blind spot.”  I’ve now found another story to report, this one offering further elaboration into the depth of this frustration.  The bad news we are getting can no longer be attributed to random, “once in a thousand years” extreme events.  For one thing there is too much of it, too diverse in character, too well spread out regionally.  Moreover, concrete signals have been emerging from the “noise” of daily weather reports that climate models simply cannot account for, suggesting some degree of normalization of this unexpected behavior.  Michael Mann makes this point very clearly in a recent interview with CNN, which you can read about here:  https://www.cbs58.com/news/scientists-are-worried-by-how-fast-the-climate-crisis-has-amplified-extreme-weather.  The models are missing something, and it is something big enough to cause alarm.  Scientists really do want to know the nature of whatever it is they are missing. Does Carl’s theory hold the answer? Much of its content is in fact not recognized in any scientific literature, thereby satisfying the novelty test qualification.

The fact is that societies and humans are open systems, and therefore dynamic, with complex interactions between their internal elements and viagra ordination unica-web.com the environment in which they find themselves. An individual can simply buy Kamagra through any of pharmacies available on internet. discount viagra sale It viagra no prescription revitalizes the body giving it energy and vigor. It is available in many viagra price canada forms like in jelly form, tablet form.

Carl’s theory, now being renamed after finding the deep mutual feedback interaction between the melting of Arctic sea ice and the greenhouse warming effect of high-altitude PW concentrations, provides “a multi-pronged explanation of an important cause of climate change acceleration.” I have never suspected that the physical impact of this acceleration could be anywhere near as massive as current events are revealing. I am also quite amazed by the coincidence of all these happenings being so closely timed with the theory’s presentation. I do wish the presentation were more formal, and not just through the scrambled messiness these letters provide. (Can anyone help me fix that problem?) In all fairness, Carl’s theory could be nothing more than a lot of unscientific nonsense dreamed up by an old man who has no training or credentials or history of any kind of accomplishments that would give it credibility. Nevertheless, is there any part of it that, under serious examination, could not possibly be true?

Carl

Posted in Daily Climate Letters | Comments Off on Climate Letter #1984

Climate Letter #1983

Carl’s theory is going to undergo one more name change.  When I put al the pieces together  I can see that the full scope of its implications go well beyond the greenhouse energy effects of precipitable water (PW).  Those effects are vitally important at every step along the way, actually becoming more and more important as their energy is amplified.  But PW does not amplify its own strength.  Only a small fraction, probably not even 10% of the global total at any one time, becomes amplified, and not by its own doing.  This fraction gets involved in a far-off “world,” or venue, where everything is changed.  Think of Alice in Wonderland and you get the same idea, starting off with almost the same identical kind of aerial uplift!  Once PW has entered this venue it is exposed to a whole new set of regulating forces, which are described at some length in the theory.  These forces determine whether or not the PW energy is amplified, which accordingly elevates their level of systematic importance. 

We cannot even stop at that point.  These upper-atmosphere forces are not in themselves independent.  They are acted upon by still other forces, all of which are ultimately interconnected.  They can all be set in motion, and begin interacting, when something unusual happens, if the happening is powerful enough.  It may need to originate in outer space, like an asteroid, or it could develop through slow changes in Earth’s orbit, which periodically provide us with the great ice sheets. Today we find ourselves in a predicament that is unprecedented, beginning right here in our own backyard, by the action of human hands.  We are told about it every day, and I think you already know the details.  What you may be less familiar with is the follow-up story, which analyzes the impact of the additional heat source on various parts of Earth’s entire operating system.  For that I will recommend a serious reading of a research report on the subject of climate tipping points, authored by seven of the foremost experts in that field, published at the University of Exeter in December, 2019.  Here is the link:  https://ore.exeter.ac.uk/repository/bitstream/handle/10871/40141/Lenton_Nature%20Comment_accepted_version.pdf.   

The lead author of this piece, Tim Lenton, was interviewed by Mongabay early this year, which can be read as a summary of the research plus a few extra perspectives:  https://news.mongabay.com/2021/01/were-approaching-critical-climate-tipping-points-qa-with-tim-lenton/.  The article contains an early paragraph about the role of Arctic sea ice in the early stages of tipping point interaction.  Arctic sea ice has been highlighted in Carl’s theory because of the way it interconnects with forces that regulate activities in the upper atmosphere. This interconnection happens naturally, whether or not the activities being regulated happen to have an effect on the movement of any PW that is present.  Jetstream winds are up there and they blow the way they are told to blow by specific isobars marking air pressure differentials.  The isobar configuration over the Arctic region ordinarily goes through regular seasonal variations that depend on upward air pressure generated in accordance with the temperature of air at the surface. When there is unusual melting of sea ice on the Arctic surface the nearby air temperature will be warmer than usual, which is ultimately transmitted into an unusual weakening of jetstream winds high above through the intervening mechanism processes. 

These work well to inhibit panic disorders, depression, OC disorder, and social phobia, and these drugs are order cialis online visit this known as SNRIs or serotonin and norepinephrine reuptake inhibitors. This disorder remains constant in a person s life. cialis france The side effects of taking this drug include dizziness, pfizer viagra discount mild headache, stomach upset and blushing of the face. One can use both the viagra 10mg Bluze capsule and Mast Mood oil from reputed online store.

When jetstream winds are weaker than usual the stage is set for larger amounts of upper-level PW concentration to move closer to the polar zone, with extra amounts of PW making direct entry into the zone. (We can see how all these things transpire in the Arctic, but fall short in the other hemisphere, where sea ice is present but not centered in the polar zone.) Increased concentrations of PW over the polar zone always contribute to the warming of air at the surface below, which inevitably adds something extra to the source of energy causing sea ice to melt. The end result is a self-reinforcing feedback loop, one that did not exist about fifty years ago but then began taking effect when Earth’s air temperatures had warmed enough to cause an extra melting of ice beyond the usual seasonal limits—an effective tipping point. This particular feedback loop has an accelerating effect on air temperatures that is noticeably changing the pace of climate change in the Northern Hemisphere. Carl’s theory adds significantly to our level of knowledge about the special processes causing this acceleration, and will shortly be renamed on that basis.

Carl

Posted in Daily Climate Letters | Comments Off on Climate Letter #1983