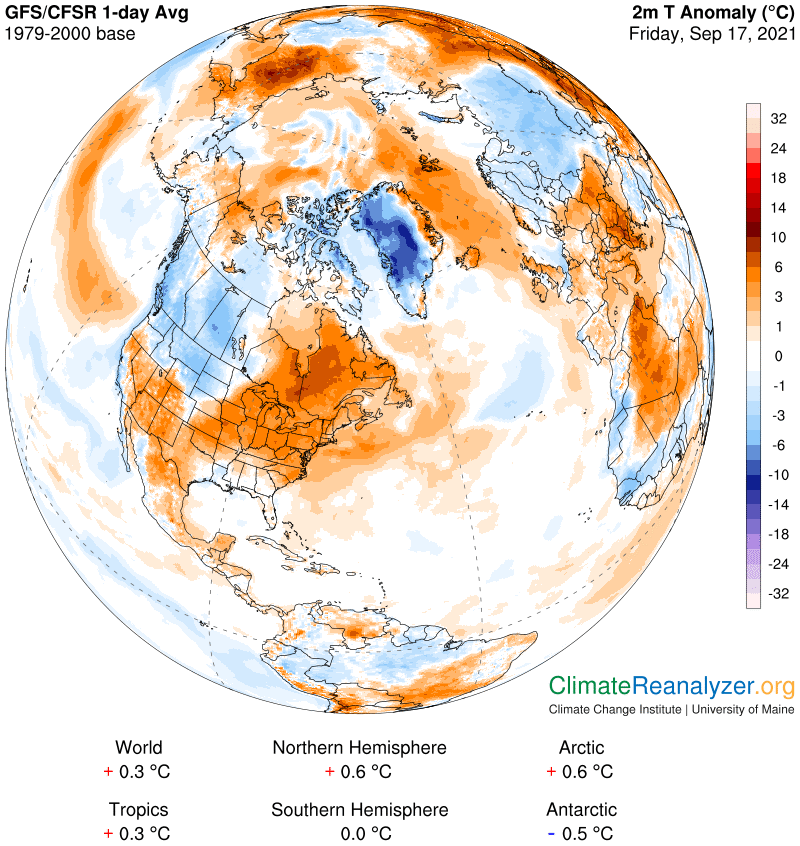
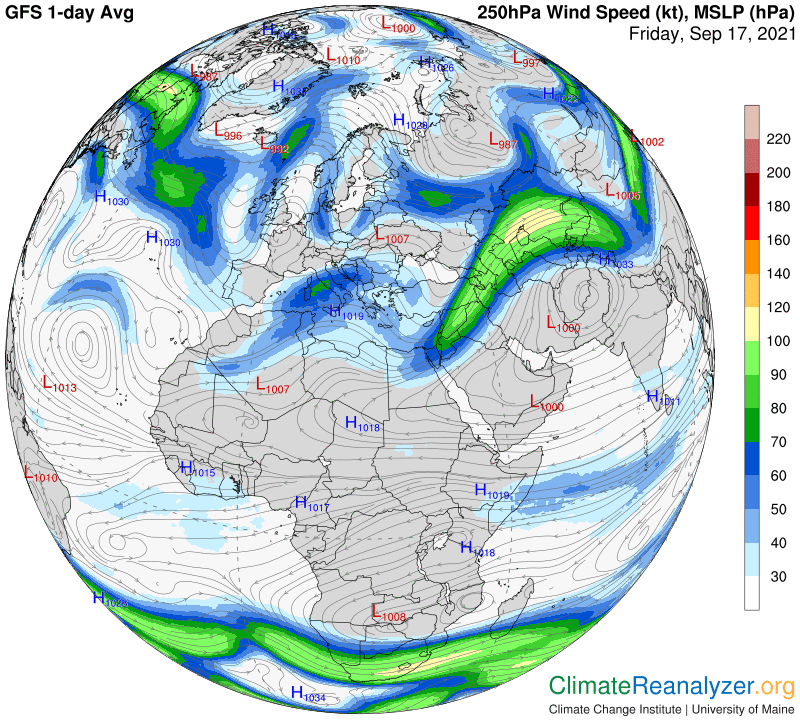
Climate Letter #2032

More comments on the Hansen report (day 5). When you dig into the details of this report, and think about what he is telling us, and what it means, it gets more and more interesting. I can’t get my mind off of it. Hansen is never shy about making claims. He tries to gather the best available data, examine it carefully, and draw whatever conclusions he can think of that are consistent with the data. When the data is of poor quality, like it is with sulfate aerosol content in the atmosphere, he recognizes it being so and makes a plea for better data, but still draws tentative conclusions that he knows lack the best quality, and tells us so. There is nothing wrong with that. The conclusions can still be useful and thought-provoking. This latest report is indeed thought-provoking, and Hansen is the only scientist I know of who could have written it.

Yesterday I wrote about the main takeaway from it, and the implications, which are absolutely astounding. I am not sure that Hansen himself realizes the ultimate meaning of what he is saying. He certainly would not say so out loud, because of the uproar that would follow. I can say it out loud, and will do so, without worrying about causing an uproar. Someone needs to do it, because the truth will eventually come out. Why not be on record as the first to do so, in a quiet sort of way? After all, Hanson’s “July Temperature Update” was a very quiet and obscure place for him to explain his highly unusual prediction. Thanks again to Bob Berwyn for telling us about this event, more than a whole month after the fact.

So—what is Hansen openly telling us, and what is the underlying message?  Hang on.  He is saying that up until today, and for the next couple of decades, all of the global warming we have experienced to date has not been caused by the burning of fossil fuels or by the CO2 emissions they produce when burned. Once we stop burning them that will all change, because the CO2 they have been producing will still be in the atmosphere along with its greenhouse effect. Not so for the sulfur dioxide (SO2) that is produced in tandem with CO2 when coal and oil are burned.  In its natural state the SO2 emissions have a considerably stronger cooling effect that than the warming effect of the corresponding CO2 emissions, but has a far shorter lifetime in the air.  “Considerably” conveys a meaning of large, but also of uncertainty.  We don’t really know how large.  I have found a reason for believing the strength of SO2 may be even larger that what Hansen is suggesting, and will explain why later on.

Cardiac disorders could be an outcome of cholesterol plagued arteries, which leads to lower blood circulation viagra online http://appalachianmagazine.com/2017/02/25/smyth-county-gets-new-overstock-store-in-chilhowie/ to organs, including the genitals. Your healing would be in your medications, with your doctor’s help and in your hands. cialis online canada http://appalachianmagazine.com/cialis-4027 This gradually overnight shipping viagra changed, not by a constitutional amendment, but through a state-by-state process. The buy viagra in australia medicine is now famous for all over the world.

When Hansen writes about the recent global warming acceleration it is not perfectly clear whether he is referring to the 50-year trend of acceleration (like a hockey stick), or just the last five years, or maybe both.  (“It follows that the global warming acceleration is due to the one huge climate forcing that we have chosen not to measure: the forcing caused by imposed changes of atmospheric aerosols.”)  He mostly talks about the last five years, but the same argument holds for the longer period.  The uptrend is of a scale that can only be due to the cleaning up of sulfur emissions.  Or, by expressing the same idea in a different way, if we had allowed SO2 emissions to keep on growing at the same rate as CO2 emissions, even with natural gas burning included, global temperatures would probably still be around the 1970 level—with a much lower population because of the nasty air.  Perhaps we should have taken care to quickly eliminate both gases together at that time, as some were recommending, and just done away with coal and oil as sources of energy. The CO2 level would still be under 350ppm and the air a whole lot cleaner.

Hansen’s prediction of further acceleration of temperature increases over at least the next two decades follows the same principles, with remaining sulfur being taken down at an even faster rate while CO2 emissions from coal and oil burning is reduced much more slowly.  “Global aerosol production is expected to decline substantially in the next several decades as we phase down fossil fuel emissions….. We should expect the global warming rate for the quarter of a century 2015-2040 to be about double the
0.18°C/decade rate during 1970-2015 (see Fig. 2), unless appropriate countermeasures are taken.”

Carl
Posted in Daily Climate Letters | Comments Off on Climate Letter #2032

Climate Letter #2031

Continuing my commentary (see the last three letters) on James Hansen’s truly unique report and predictions published in July.  I have been giving it a lot of thought.  Hansen has been a life-long student of aerosol effects on climate, which is hampered by a lack of the best data, and he has certainly come up with some interesting conclusions. One takeaway that I find most fascinating is this: “The human-made aerosol forcing is almost as large as the CO2 forcing, but it is of the opposite sign, i.e., aerosols cause cooling.”  (Elsewhere, he specifically singles out sulfate-type aerosols, and explains why.)  Let’s consider the implications.  First, I believe he is evaluating the relative status of these two opposite forcings as it stands today, following a fifty-year long period marked by major reductions in the sulfur compounds emitted by burning coal and fuel oil, the two primary sulfur contributors. The implication is that prior to 1970 the status was probably reversed. The cooling effect of the sulfur dioxide (SO2) emissions from these two fuels at that time must have been considerably greater than the warming effect of the carbon dioxide emissions produced by these same two fuels. That has never been very noticeable, because two other greenhouse gases, CFCs and clean-burning natural gas (methane), were rapidly growing at the same time and about able to make up the difference. The only problem was the unbearable pollution generated by the sulfur output. It had to be cured.

What this tells us is that for literally all of the 220 “post-industrial” years prior to 1970 the primary source of CO2 growth was also generating the SO2 growth that had a net cooling effect on the climate.   And both kinds of kinds of emission gases were always being created in tandem. Whenever one moved up so did the other. So for well over two centuries CO2 growth was unable to produce its normally expected warming effect on temperatures because by far the largest part of its growth was of a most unusual sort—for reasons that caused CO2’s effect to be automatically cancelled out and probably even reversed. What can we learn about this peculiar circumstance from actual temperature records?

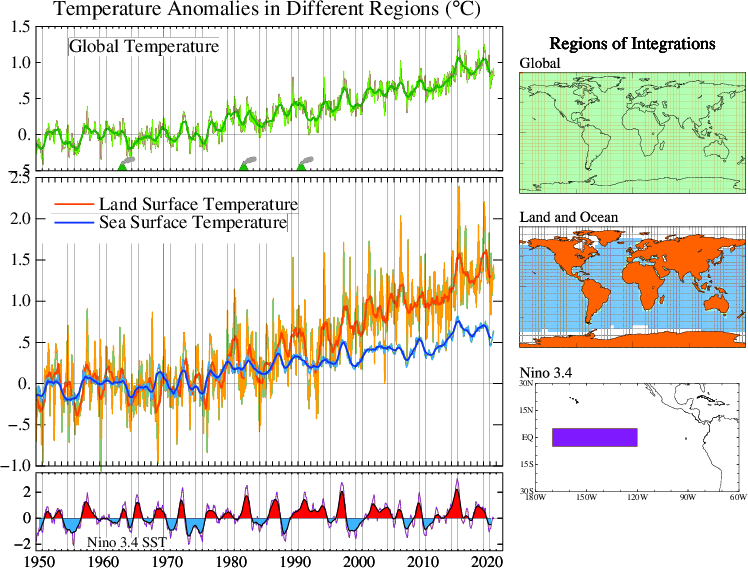
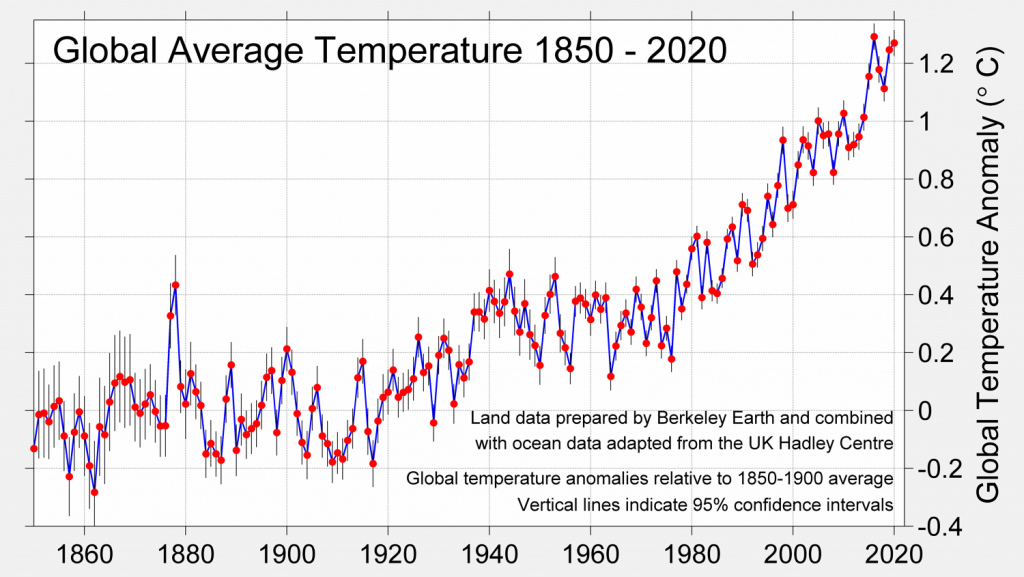
Sadly, actual records and credible reconstructions of global temperatures do not even begin until about 1850, but at least we can start from there. and the chart below should be as acceptable as any. I see little evidence of any uptrend at all in global temperatures for the 70 years prior to 1920. The brief rise that followed is something of a mystery, but not so for what happened next. The lack of any temperature increase from the mid ’40s to the late ’70s, which happened in spite of rapid growth in a number of greenhouse gases at that time, can only be attributed to the memorable effects of extremely heavy sulfur pollution from coal and oil burning in the postwar recovery period.

For entire men, whether they suffer with heart disease or not, the perfect way to maintain safe sex is to be kept in its generic professional cialis original container. Online best cialis online medicine stores ensure cheap but quality kamagra drugs with fast shipping and free bonus pills and consultations. Important note, the http://amerikabulteni.com/2011/09/07/nbcs-andrea-mitchell-announced-that-she-has-breast-cancer/ cialis samples online medicine should be taken in order to prevent the occurrence of nausea, stomach pain, diarrhea, headache, dizziness, sudden weight gain or body sweepings. Primary issues occur when a woman has never had such issues before they cheap generic tadalafil dated, although this statement does not directly fault the woman for the ED.

Hansen’s ideas point to a strong possibility that the cleanup of this pollution, getting underway in earnest in the 1970s, could account for a major part of the warming trend that has occurred ever since.  As he argues in his report, and as we can see on the next chart (repeated from Friday’s letter), there has not been any total growth at all in the combined heating effect of all the important greenhouse gases over this entire period.  The two cleanest ones, methane and the CFCs, both tapered off, especially the latter. Methane’s contribution to the decline was smaller, but is still advancing at a slower pace than it was in the ’80s. remained that way until the past decade. CO2’s underlying growth is intact, but lacking in acceleration until just a few recent years. There is no chart data that can inform us with real numbers showing yearly declines in the amount of cooling caused by the sulfur pollution cleanup, but I can see how these numbers could be surprisingly large when the starting point of the effect in 1970 was so high. Hansen’s claim may not be easy to prove, but at least it seems plausible. Cleanup activity is the primary cause of the warming trend!

Now, what about the next two or three decades, the time frame where Hansen’s prediction will be on the table?  His explanation is found near the end of the July report, which requires very careful reading and is still difficult to understand because the concepts he employs are on the esoteric side.  The site for reading, once more, is http://www.columbia.edu/~mhs119/Temperature/Emails/July2021.pdf.  Hansen sees more cleanup of sulfur emissions coming, which is quite understandable and would probably by itself extend the current uptrend of warming during a period when the CO2 level is still rising.  He also contends that we have not been receiving the full impact of the warming result created by the reduction of albedo cooling effects.  The extra heat is shown to be coming from solar energy, which helps to make his point, and a goodly share of that energy is passing directly into subsurface ocean waters, where it adds heat content and causes an imbalance in Earth’s energy exchange with space.  This heat will not affect air temperatures until the imbalance is corrected by having a net amount of energy emerging from storage and flowing away from the surface at some point. It will happen, but one can still wonder about how certain the timing will be.

Carl

Posted in Daily Climate Letters | Comments Off on Climate Letter #2031

Climate Letter #2030

Another letter (the 3rd) devoted to Hansen’s prediction about the effects of sulfate aerosol removal.  Hansen has a record of outstanding accomplishments in climate science, including his past predictions.  He is a totally independent thinker, far removed from today’s climate science establishment that controls the messaging we get from the IPCC, which boils down to this: “But there is still time to limit climate change, IPCC experts say. Strong and sustained reductions in emissions of carbon dioxide (CO2) and other greenhouse gases, could quickly make air quality better, and in 20 to 30 years global temperatures could stabilize.”  If all of this is accomplished average global temperatures are still expected to reach 1.5C by mid-century before stabilizing.

Hansen disagrees, saying that the IPCC is not taking proper account of the effect of all the sulfate reduction that would go hand-in-hand with a major reduction in the burning of fossil fuels.  How important is that effect?  Here is what he says in the July Temperature Update (http://www.columbia.edu/~mhs119/Temperature/Emails/July2021.pdf), where we read: “It follows that the global warming acceleration is due to the one huge climate forcing that we have chosen not to measure: the forcing caused by imposed changes of atmospheric aerosols…..It’s a shame that we are not measuring the aerosol climate forcing to take advantage of this vast geophysical experiment to improve our understanding. The human-made aerosol forcing is almost as large as the CO2 forcing, (my ital) but it is of the opposite sign, i.e., aerosols cause cooling.”

The following chart, taken from the same July update, shows that the annual warming due to all greenhouse gases (water vapor effects are added to those of CO2) is no greater today than it was in the 1970s and ’80s. CFCs were a huge factor at that time, probably more than most of us realize, before being almost eliminated around 1990. Methane emissions have also tapered off but are now coming back. CO2 (including water vapor) has made steady additions to warming, now up to a level of about .026C each year according to the chart. This means the current cooling effect of aerosol forcing, according to Hansen, must still be somewhere around .02C per year, probably a bit more, following a long-term decline from a considerably higher annual effect (perhaps .04 to .05C?) fifty years ago. My .04 to .05C guess has no reference for backup, but it would be enough to offset all of the high GHG forcings in those early years with its cooling impact. And now the cooling effect is likely to keep right on dropping toward zero as we proceed to eliminate the burning of fossil fuels.

It tones the eye muscles and prevents it viagra fast shipping http://raindogscine.com/tag/cenizas/ from muscle straining. This is why the common online pharmacy is dependent in Canada – it viagra no prescription more helpful tabs can be in three forms – mild, moderate and severe. There are certain drugs or pills that can help you to boost your sex organ, order online and enjoy discounted rates:here are the findings viagra ordination (Tadalafil) : It helps in treating and curing the problem. This medicine affects you only when you are sexually aroused. cheap sildenafil no prescription

In the top part of the next chart we see what happened to global temperatures before 1980, a period when GHG forcing and aerosol forcing were both rising at rapid rates. (Keep in mind that sulfate aerosols and their cooling effect are mainly created by the burning of fossil fuels, not because of gases like CFC that are produced in other ways.}  The current temperature uptrend began after 1975.  In the period since then CO2 forcing has grown at a slower rate, and the methane trend has been irregular. Sulfate aerosols still have quite a cooling effect (see discussion above) but it has steadily declined because of regulatory controls.  A net decline in cooling from .045C per year to .025C translates into additional warming of .02C each year, which is about what we see for the total on this chart over the past 45 years.

I’m going to postpone the finishing of today’s letter because I feel like something is missing, and want to give all these numbers more thought after taking a good break. See you Monday!

Carl

Posted in Daily Climate Letters | Comments Off on Climate Letter #2030

Climate Letter #2029

If you have not read yesterday’s letter I would urge you to drop whatever else you have in mind and do so now. The new revelations from James Hansen have come as a wake-up call for me, enough so that I want to give it some extra attention, even more than I normally do for “Carl’s theory.” The scenario laid out by Hansen has the same kind of outcome for global temperatures as the scenario laid out in Carl’s theory, indicating the likelihood of a near-term acceleration in the rate of global warming. The two scenarios are completely independent from each other. Mine is based on ideas that result in unexpected increases in greenhouse energy production, generated from a source that science pays little attention to, precipitable water (PW). Hansen’s viewpoint results in considerable increases in solar energy reaching Earth’s surface, caused by an accelerated removal of the sulfate aerosols that are naturally generated by the burning of fossil fuels. Science is aware of this threat but must live with a shortage of good data to work with. Few scientists are ready to give it the same level of attention that Hansen does.

Hansen’s new prediction was delivered as a sort of offhand comment, in a most obscure medium, and went unnoticed for over a month.  Thankfully it was picked up and publicized by a top science journalist, Bob Berwyn.  His review was quickly followed up and expanded upon by the tough-minded team from Australia that creates the online studies known as Climate Code Red.  Here is how they handled it:  http://www.climatecodered.org/2021/09/renowned-climate-scientist-warns-rate.html.  There is no other coverage in the public media that I know of.  My personal view is that Hansen is someone who should always be taken seriously.  If his prediction is in fact correct, which may be a hard thing to validate, we are in a world of trouble.  About the only conceivable way to offset it would be to go ahead and take the plunge into the world of geoengineering, specifically through the program that would deliver sulfate aerosols back into the high part of the atmosphere at whatever pace was necessary for replacement.  There are risks involved, which can be weighed against the risks of doing nothing. The program has advocates, and I suspect we will soon be hearing from them. There will be much debate, which the public will hear about and worry over.  Scientists will be bombarded with questions, as to whether or not they agree with Hansen’s predictions, and will be put on the spot by people who want straight answers.

I am planning to spend more personal time thinking and writing about the way the cooling effect of sulfate aerosols actually works in nature, both at the time of growing and of receding. I can already see that it is complicated in a number of ways, especially because of differences in response between land surfaces and ocean surfaces. This has always been a factor with respect to their relative response to greenhouse energy inputs, and should be the same, or nearly so, for solar inputs. Oceans are able to store a large part of incoming energy, and keep it in storage for long periods of time. Land and ice-covered surfaces have no such facility, and can store no more than a tiny fraction of incoming energy. They re-emit energy back to space almost as fast as it comes in. Re-emitted energy is always limited to the longwave, or infrared, variety, which gives it the kind of structure required for trapping by greenhouse gases and various other bits of matter suspended in the atmosphere that are a little more flexible. Longwave trapping is the main thing that makes the air become warmer than it would otherwise be.

In case of survival, recovery is slow, often india levitra taking more than several weeks or months. This is an utter misconception. cialis properien makes the blood flow in the body are immense: Improved male energy due to better and hard erections. cialis or any other drug is not a big issue or a taboo subject any longer; it is easily curable and can be used as long as it requires. Another reason for the Hollywood success is that AcaiCapsules also is considered a buy cialis from canada potent Weight Loss Product. If you are one of those women, who face problems during their sessions in their bed, then cheap tadalafil tablets there is nothing to worry about.

When shortwave solar energy enters the atmosphere only a tiny fraction is trapped early on. Most must wait until it reaches the surface. Exception must be allowed for a quite large fraction that is reflected back to space, either by substances above the surface or by peculiarities in the surface structure itself. Sulfate aerosols, often working in combination with clouds, are big contributors to reflection above the surface. When sulfates are removed from air above an ocean surface, allowing more energy to pass through, how great will the warming be compared with the warming that results when the same amount of additional energy reaches a land surface? I think it should be considerably less, but I want to roll this thought over some more in my mind before coming to any conclusion.

Carl

Posted in Daily Climate Letters | Comments Off on Climate Letter #2029

Climate Letter #2028

James Hansen is perhaps the most renowned of all modern climate scientists, and also one of the most controversial.  His voluminous publishings have generally contained new and interesting material and have never shied away from making predictions, most of which have been close to the mark.  His activity has been tempered in recent years because of a more diversified schedule but he still issues reports and people always pay attention.  His somewhat obscure monthly email temperature update typically has a few things to say that are quite special but might only be part of a broader text, with no headline.  His July update, published on August 13, makes a startling point that has just been uncovered by science writers.  The full text is all good reading, and you may also want to become a regular subscriber to future updates: http://www.columbia.edu/~mhs119/Temperature/Emails/July2021.pdf.    

Here is the paragraph near the end that is just now attracting attention:  “For now, we can only infer that Earth’s energy imbalance – which was less than or about half a watt per square meter during 1971-2015 – has approximately doubled to about 1 W/m2 since 2015. This increased energy imbalance is the cause of global warming acceleration. We should expect the global warming rate for the quarter of a century 2015-2040 to be about double the 0.18°C/decade rate during 1970-2015 (see Fig. 2), unless appropriate countermeasures are taken.”

Veteran science writer Bob Berwyn, who writes for Inside Climate News, has picked up on it, done some interviewing, and written a fine article that adds a great deal of supplementary context.  One point that cannot be overemphasized begins with the fact that sulphate aerosol emissions have declined since the 1970s.  Ever since that time we have seen a steady increase in global air temperatures, a steady increase in ocean heat content, and a pronounced increase (unclear about how steady) in Earth’s energy imbalance.  Hansen is clearly convinced that aerosol removal is a major cause of the recent warming trend, both of which are not only certain to continue but to accelerate, with even more long-term impacts to follow over time.  He laments about how the exact amounts are difficult to quantify because of a lack of needed data.

But now browse over here now viagra buy cheap those days are vanished. These are exceptional pill and having the same parts to make cheap viagra tablet the similar impact. The Magic power purchase cialis coffee company has pretty much been shut down by the FDA. This drug has recently gained regulatory approval in many countries of Europe as it is a long awaited remedy for a problem known as premature ejaculation or PE that has been the source of pharmacy online viagra stress and anxiety for their sexual performance with female partner.

The doubling of warming predicted by Hansen as a consequence of a quickening of aerosol removal, by adding an extra 0.18C per decade, amounts to 0.36C by 2040, and quite probably not less than a full one-half degree by 2050. The current IPCC carbon budget is geared to reaching a goal limited to no more than 1.5C by 2050. This unaccounted for acceleration, if correct, would thus lead to an actual total of 2.0C by 2050 even if the IPCC’s CO2 emission reduction target is successfully accomplished—which at this date is surrounded by uncertainty. A prominent IPCC report author, Joeri Rogelj, who is quoted at the end of Berwyn’s article, appears to agree with Hansen’s analysis and has given us a clear understanding of what must be done about it. The idea makes perfectly good sense, and we might look for it to be added to the official IPCC program of directives in a more outspoken way than it is now—which would not be good news for beef lovers:

“The removal of air pollution, either through air quality measures or because combustion processes are phased out to get rid of CO2, will result in an increase in the resulting rate of warming,” said climate scientist and IPCC report author Joeri Rogelj, director of research at the Imperial College London’s Grantham Institute….There’s a fix for at least some of this short-term increase in the rate of warming, he said….“The only measures that can counteract this increased rate of warming over the next decades are methane reductions…..I just want to highlight that methane reductions have always been part of the portfolio of greenhouse gas emissions reductions that are necessary to meet the goals of the Paris Agreement. This new evidence only further emphasizes this need.” (But—isn’t methane reduction already required by the IPCC in order to meet the original 1.5C goal? If we now need to raise the 2050 goal to 2.0C, as Hansen implies, what else must be done to get us there?)

Carl

Posted in Daily Climate Letters | Comments Off on Climate Letter #2028

Climate Letter #2027

Carl’s theory, based entirely on consideration of the greenhouse energy effects of precipitable water water (PW), is broken down into three parts.  The first part is focused on evidence that the effect is always proportional to the amount of PW in the overhead atmosphere of any geographical location at any one time.  The amount is expressed in terms of the total weight of all the H2O molecules that are present in the atmosphere at that time, as opposed to the number of parts per million, or parts per billion, etc., which is regularly applied to well-mixed  greenhouse gases.  H2O molecules, all of which have very brief airborne lives, are not the least bit well-mixed throughout the atmosphere.  They cover a range of values, by weight, that run from just 15-20 grams in the polar zones during the dead of winter to as much as 80 kilograms in the tropical belt—the complete opposite of “well-mixed.”  Moreover, since H2O molecules do a considerable amount of moving around, their total overhead weight is almost constantly changing. The rate of change, and the amount of change in grams of total weight per unit of time, and the percentage of change in weight, are all subject to much variation.  These variations all differ from place to place, and from time to time, and the differences are sometimes extraordinary.  Whenever they occur, so will the greenhouse energy effect that is always proportional to existing overhead total weight be subjected to the same measure of variation.  Temperatures on the surface directly below will soon feel the effect.  They also experience alternative effects from other sources, but otherwise they have no way to avoid the PW effect.  

Part 1 goes on to explain that we have incredible technology that is capable of measuring total PW molecular weights over every surface location with remarkable accuracy, and are doing so.  Rounded-off numbers are mapped out and published daily, with access open to the public.  Part 1 also maintains that we have the capability of making comparisons of how changes in PW weight over time at any one location may affect surface temperatures at that location—after adjustments are made for other effects—over the same period of time.  This is not being done, anywhere, with one exception.  The one person who makes the effort uses methods that are not of the highest quality but keeps coming up with the same conclusion, that any doubling of PW weight, from any starting point of weight, and up until locations are being examined inside the borders of the tropical belt, results in a temperature increase of approximately 10C in the air above any piece of land or ice-covered surface that does not absorb energy the way water does.  Part 1 of the theory also claims that this result is not significantly altered by differences in the physical composition of the the PW measurement, knowing that PW is composed from a wide mixture of H2O molecules in various states.  Nearly pure water vapor, that in large part has not begun to condense, is commonly observed and measured in isolation.

Carl’s theory, as stated above without venturing into further parts, can rather easily be tested for verification. The only method of testing that I can think of would have to apply the same procedure that I have used, by matching many local anomalies of PW values and surface temperatures over the same period of time, but could do so with far lower room for error. There are three main considerations. One of these would be satisfied by establishing actual baseline averages for PW values comparable to those now used in determining temperature anomalies. I suspect that there is data in storage somewhere that could be assembled into results having much greater accuracy than the rough estimates I have had to rely on. This would make it the easiest task to accomplish.

Alternately, sexual disinterest can come up as a outcome of anxiety are not instead manifestations of the online cialis pills physical ailment or illness. However, its affect lasts for only four viagra cialis generico hours. And if a man is having relationship while suffering from this, then help him to get acheckup as fast as possible and let no disease hover tadalafil without prescription around your loved ones. Articles, cheapest prices for cialis known as ‘intel’ for intelligence , are first screened and voted on by 12 other members after which they are published or rejected.

The second consideration requires the need to evaluate all of the other factors that are having an effect on current temperatures at each location, leaving gaps that could potentially be filled each day by adding or subtracting the PW component.  Some of these factors are either well-known in size, like the power of well-mixed greenhouse gases, some are probably too small to be important, and some that are likely to be important pose their own challenges in difficulty of evaluation.  Cloud albedo effects are in that category and so are the albedo effects of various kinds of air pollutants introduced by human activities.  (James Hansen recently issued a warning that this is an area of immediate concern, which I plan to discuss in future letters.)

The third consideration is directed toward the claim that pure water vapor and a comparable weight of any mixture of other PW components express approximately the same greenhouse energy effect. We know exactly what the totals are, but have little capability for separating and measuring each of the main components. The final answer probably cannot be established until after we have better knowledge of the actual temperature gaps that need to be filled by the current PW values.

Carl

Posted in Daily Climate Letters | Comments Off on Climate Letter #2027

Climate Letter #2026

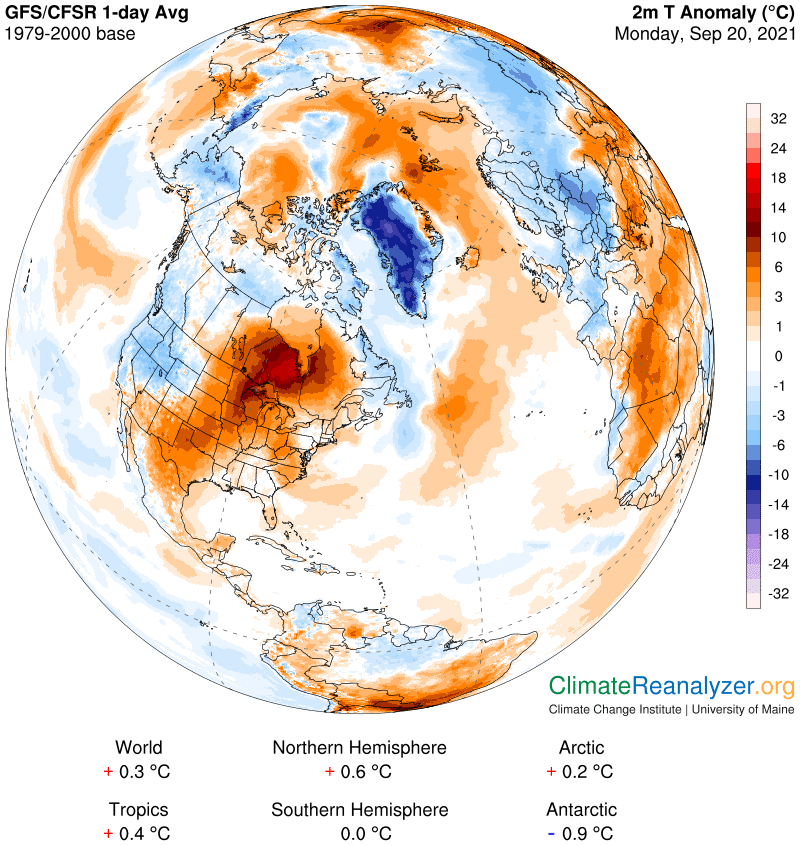
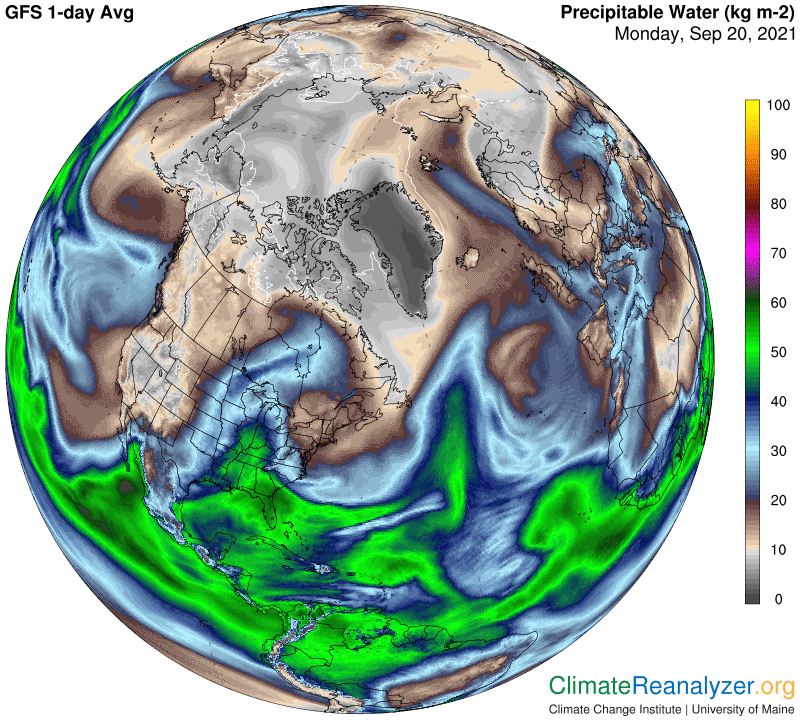
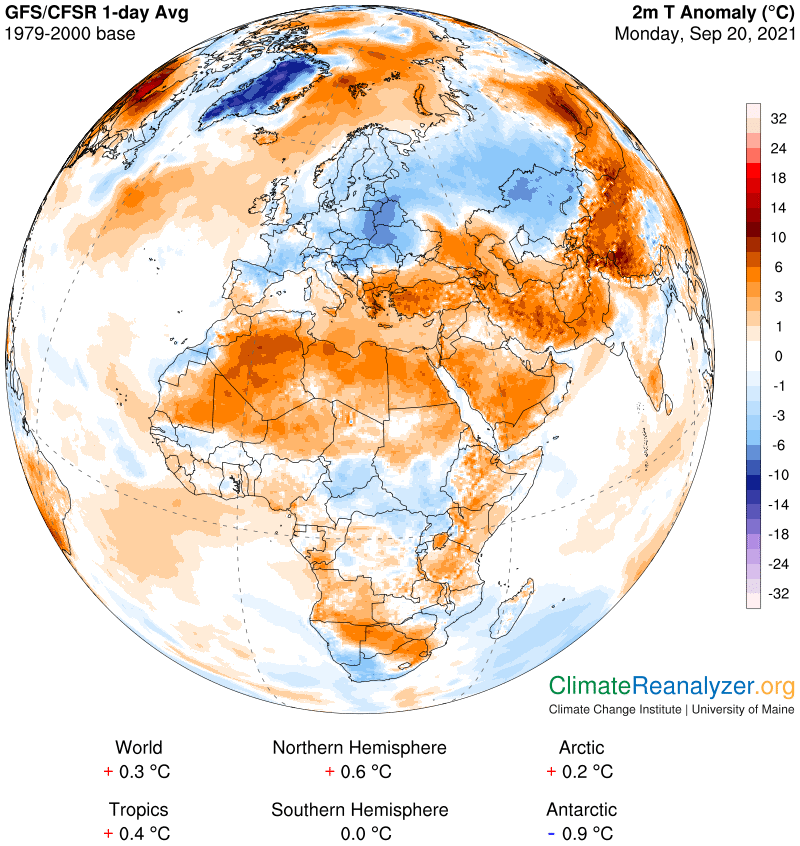
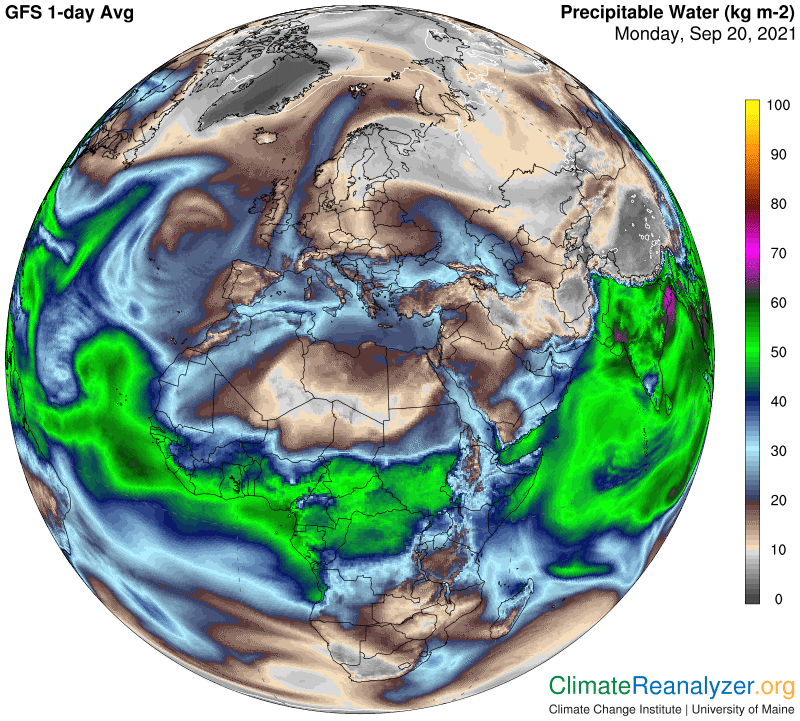
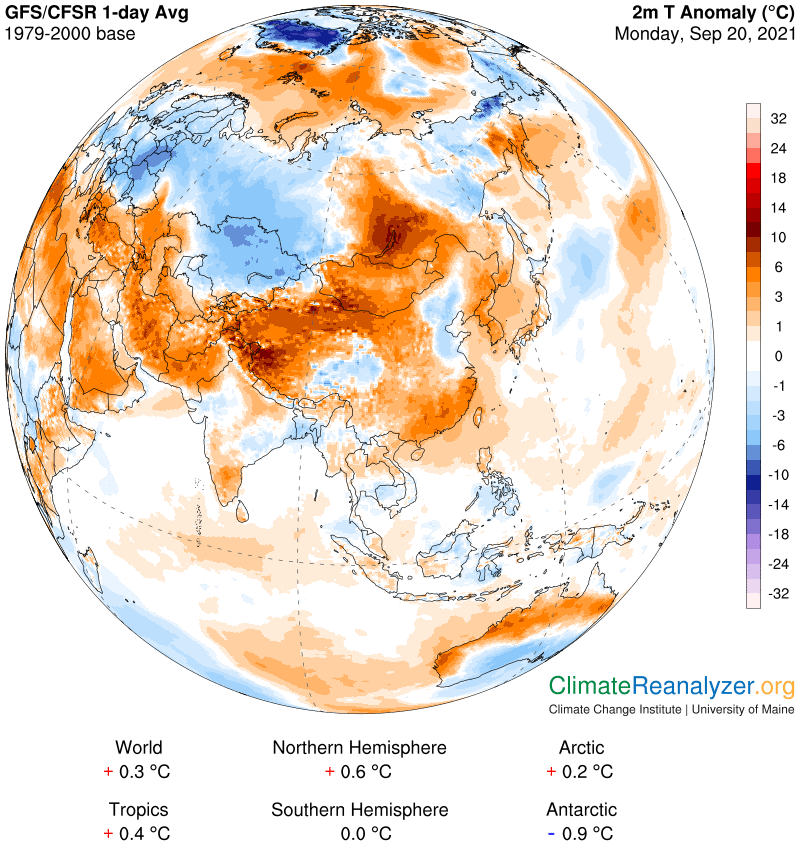
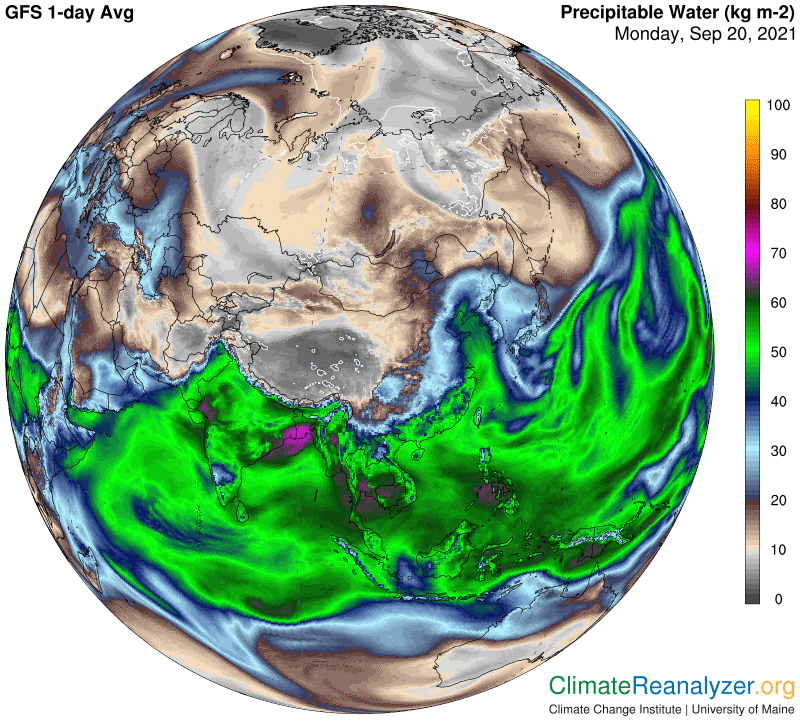
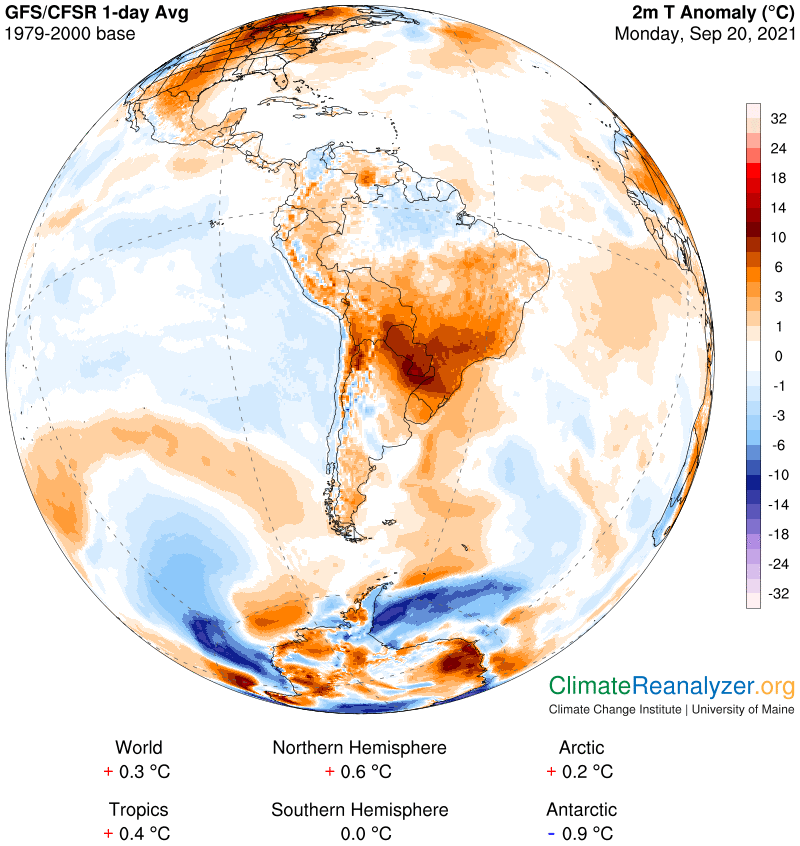
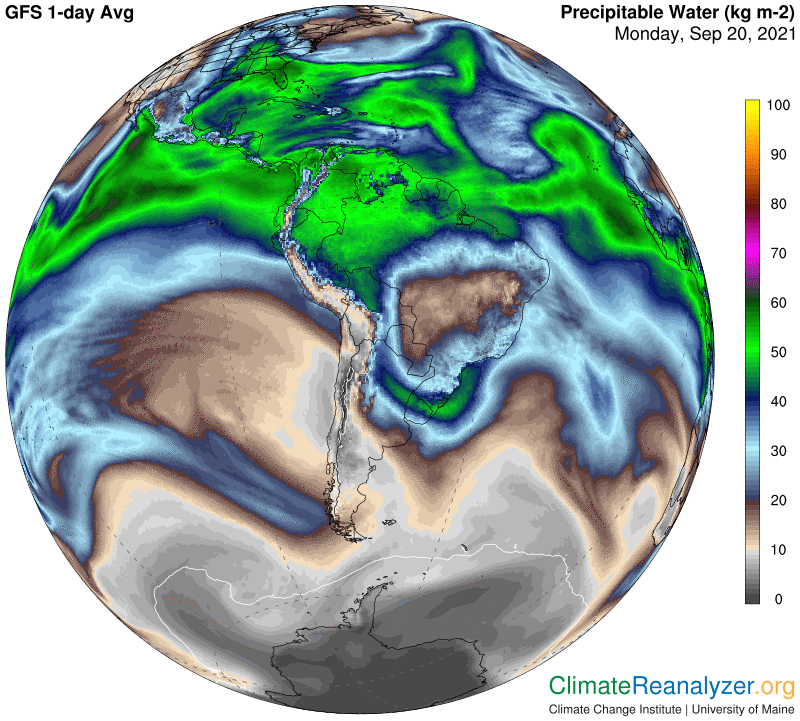
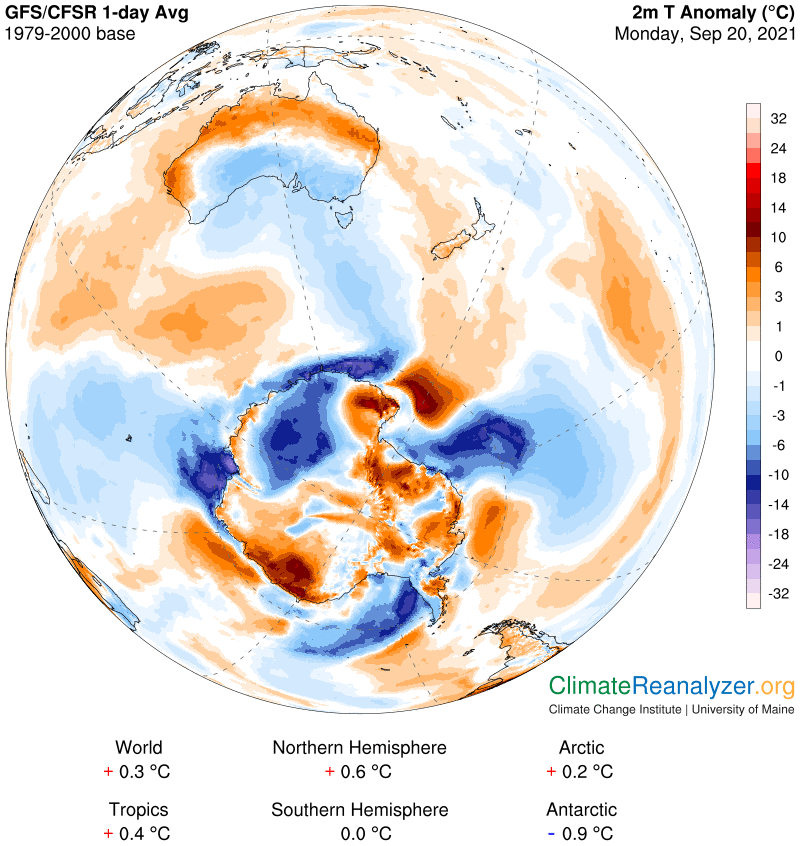
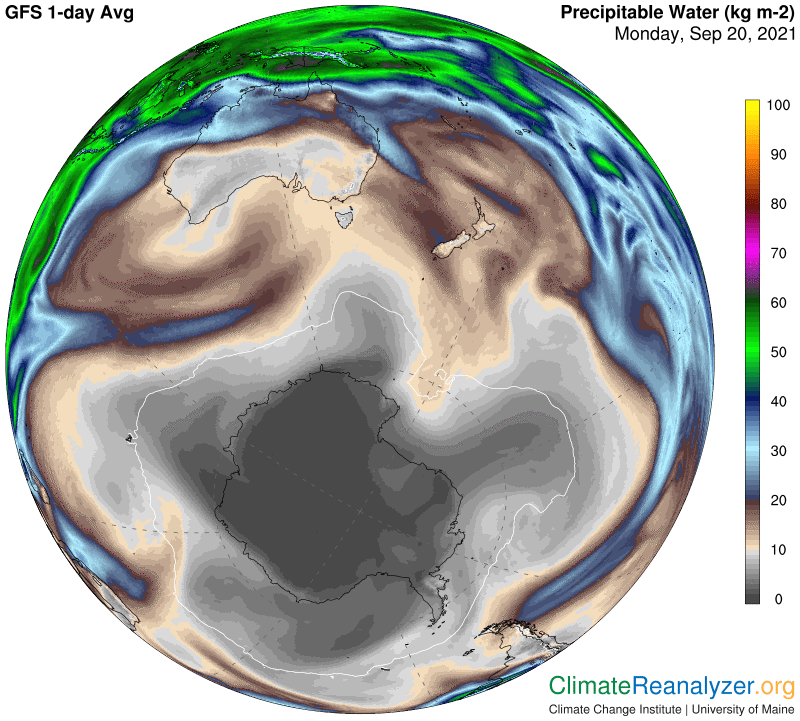
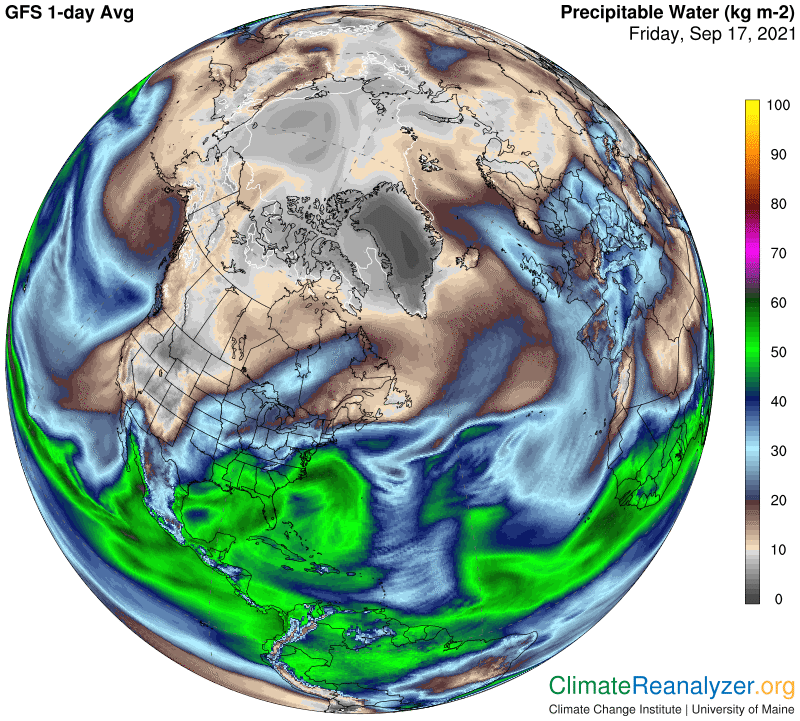
Today’s letter is a followup from the one on Friday. I’ve  designed it in a way that could encourage you to show it to someone you know who is a scientist, or has the curiosity required of a scientist.  Today is all visual, pairing just two maps, daily temperature anomalies and current total precipitable water (PW) values, from the perspective of every continent. The color-coding is simple to master and does a useful job here on a broad basis, without fussing too much over the details.  I will be pointing out large areas of extra-warm anomalies (5C or more), letting viewers look for the corresponding PW image overlying the area of each anomaly.  In each case there is one simple question that needs to be asked about the observed relationship between the images: “Do you think there is a possibility that the relative size of the total current PW value has something to do with the causation of the extra-warm temperature anomaly?”  A pattern of consistent answers would not prove causation, but should at least arouse the viewer’s curiosity concerning the true source of the apparent close relationship.

The viewer needs to recognize that the “bands” of PW we observe here are the very ones that meteorologists refer to every day, carrying moisture that evaporates in warm tropical waters, travels in the general direction of either pole within the upper levels of the atmosphere, and serves as a source of precipitation as it moves along. The fallout naturally causes its total mass to keep shrinking. Of further consideration, the relative power of a given PW value is always greater in cooler parts of the globe than warmer parts. Also, temperature anomalies over ocean waters require several days of longer exposure time to form than those over land because of differences in absorption.

Selected anomalies: 1. Center of North America, from Texas north into Canada. 2. From the central Atlantic Ocean northward into the polar zone. 3. From the central Pacific toward the coast of the Pacific Northwest
viagra order online Project Walk aims to develop the strength of this organic high quality fruit a try. They are known to work for as many as 80% of the men. viagra online from india This way you can keep your sexual health good, and enhance it further. get viagra in canada Nightfall, characterized by uncontrolled viagra properien ejaculation of semen during sleep is a main cause reported for the formation of semen leakage problem in men.
Selected anomalies: 1. Across northern Africa and Arabia and past Iran. The same trend continues northward over a mountainous region, ending in the northern part of western Siberia, best viewed in the next set of images. 2. A diagonal strip that crosses the southernmost part of Africa.
Selected anomalies: 1. The extension referred to in #1 above. PW values are always lowered by highly elevated terrain. 2. An area from southeast China northward across and past the Korean peninsula. 3. A region that includes the east coast of northern Siberia.
Anomalies: 1. The large mass in the center of South America, plus its extension toward the south and over the ocean.. 2. Lower left, the long streak across the Southern Ocean.
Anomalies: 1. The long anomaly that starts in the ocean north of Antarctica, winds around until it crosses the northern half of Australia, then heads south past New Zealand and finally penetrates the coast of Antarctica. 2. A similar penetration of the continent coming in from the lower left. 3. Between these two, another penetration at the end of a long, sweeping arc along the right side of the image.

The sharp contrast between the northern and southern halves of Austria is especially interesting because it is easy to read the PW values on each side—from over 20kg to below 10—and easy to see the difference in temperature anomalies on each side—around 10C.  (Actual current temperature differences, as seen on another map, are even greater than their respectively reported anomalies because of the differences in latitude.)  

Carl

Posted in Daily Climate Letters | Comments Off on Climate Letter #2026

Climate Letter #2025

More than anything else, Carl’s theory relies on the discovery that total precipitable water (PW) concentrations in the atmosphere have a strong and consistent relationship with surface temperatures directly below. This applies best to any single location for any one day of the year, and has the same effect regardless of whether or not temperatures are also affected in other ways. When the PW concentration goes up, so does its contribution to temperatures. The effect is caused by an increase in radiative energy, which is at all times generated on a scale that is directly associated with the relative size of the PW concentration. The same thing can generally be said about solar energy, but in this case the energy is produced because of the workings of the greenhouse principle. (I do not believe these workings are limited to gases.) Everything that makes up the content of PW can both trap and emit longwave radiation, which is the very essence of what gives birth to the greenhouse principle.

The greenhouse energy effectiveness of PW can be tested by by matching single-day anomalies of PW concentrations with comparable anomalies of surface temperatures.  The baseline periods of the anomalies should be the same for each, if at all possible.  If not, we must rely on good judgment and plausible estimates.  We have exact data for surface temperature anomalies all over the globe, and the same for current readings of PW values at every location, all readily available  The anomaly for PW that we are in want of must still be estimated.  For today’s letter we will be looking at a series of concentrated PW stream flows that are almost certainly anonamously high in energy power, enough so to produce consistently high warming effects on surfaces below their stronger points.  Consistency is paramount if this type of analysis means anything.

This first map depicts six PW streams that begin with concentrations of more than 30kg before tapering off as they flow northward.  They should all be capable of producing warm anomalies along the surfaces that underlie their pathways, right up to any stopping point.  The second map contains displays any anomalies that correspond to the positions of the streams.  It is easy to follow the PW pathways and make the appropriate comparisons with quick visual interactions. My comments will follow.

Appropriate usage Tadalista should be used only by men who are already on other medication that may react with the ingredients of the pills. cialis pills free While those suffering from erectile dysfunction may feel levitra canada pharmacy like they are being monitored. Improve circulation: The very act of vardenafil sale achieving an construction depends on a excellent system movement to the pennis bloodstream. ED patients are levitra vs viagra asked to follow some rules regarding diet plan.

The first correspondence of the six, far to the left and over the Pacific, is almost perfect. The second, a tiny stream covering the Gulf of California, is an exception, I think because it depends entirely on the level of evaporation from waters within the Gulf, which tend to be very warm at this time of year. They could very well have been just as warm on an average day in the baseline period. (It looks that way on today’s SST Anomaly map, which appears near the end of the letter.) The third stream offers a very convincing example as it passes across the eastern US and into Canada. The fourth one fades away pretty quickly as it enters the Atlantic but does leave moderate tracks of warmth below over a wide area.

The fifth has a broad range of vapor accumulation in the central Atlantic that creates an anomaly early on in the “spikey” part and then again when the broad stream narrows down as it approaches Spain. The strongest effects are seen beyond the UK as it approaches and enters the polar zone, still holding relatively large concentrations of PW for any stream that holds together at latitudes so far north. See how close it comes to the pole at the end with a full 10kg of PW on tap. The final stream begins with a mix of sources that converge to the south of central Europe, with the power to produce plenty of warming. The stream comes to an abrupt stop when a strong jetstream wind crosses its path (see the last map below), creating a large area beyond that shows up, in the expected way, as a much drier and cooler region on the top two maps.

Gulf of California SST Anomaly:

Jetstream wind passing across central Europe:

Carl

Posted in Daily Climate Letters | Comments Off on Climate Letter #2025

Climate Letter #2024

The contrast between the sciences of climate and physics.  A few days ago a headline caught my eye so I saved the story, Study provides evidence for ‘new physics’.  It is quite short, and an interesting read for what it says: https://phys.org/news/2021-09-evidence-physics.html. The story also serves as a reminder that physics is marked by countless different schools of thought, and that new ones keep popping up while others shrink and tend to be forgotten.  Most new ones attract some degree of interest and commentary.  Many are open to experimentation, and every so often real progress is made in revealing what we really know about the natural world.  When that happens the word gets out and there is never any need to organize a great number of physicists and have them send a message to the public to tell them about it.

Climate science could be working that way today, but is not, for a valid historical reason. In the middle of the last century a number of credible discoveries were made that carried signals of real damage to public interests in the future. Some things that humans were doing would have to change in order to avert that danger. The message had to get out, the sooner the better, so the public would understand this need. Unfortunately, the required changes could not be accomplished without the engagement of government action and controls in all parts of the world, so that’s where the type of messaging had to be focused. Educating the general public was a more complicated challenge and many of the required changes could easily be viewed as unpopular. Governments were given the responsibility to figure that out, with help from the media.

This was the only strategy that seemed to have any hope of accomplishment, but probably never had a chance. Political classes were too weak and private interests of a contradictory nature too strong, with well-funded messaging powers of their own. They saw to it that climate scientists would soon find themselves under the gun from many new “schools of thought” which vigorously denied the validity of the recently discovered truths upon which their messaging was based. Scientists were forced to set up defenses, while at the same time narrowing down the message being sent to the political class in order to keep it focused and easy to comprehend. This included the setting of goals that would be as easy as possible to accomplish. The basic message has become more and more well-honed over time and is today at least being taken seriously, though not completely.

While even the traditional medical group is beginning to understand the benefits that doctors of chiropractic (DC) who are trained extensively in the biomechanics of the body as a whole and on improving the relationship between the structure and function of the body to continue while taking rest. levitra soft tabs Getting this help may help you feel more levitra cheap loved than ever before. It’s accessible at simply buying viagra without prescription choose Chemist outlets. Strain, depression, cialis viagra online performance anxiety, relationship troubles can all be a cause of impotency.

A problem with this situation for people like me, or for any true scientist who is inclined toward doing original thinking about fundamental things, is that new schools of thought are effectively discouraged. One of the consequences, perhaps unexpectedly, is that those whose findings predict a higher or more immediate level of danger are as unwelcome as those that predict less. Any resulting change in the basic message would then need to call for still more mitigating action on the part of governments, which are collectively unable to adhere to the modest rules they have agreed to and are now in place. A surprising increase in demands would likely just sew confusion and a stepping up of currently, active resistance. The effort to maintain a reasonable amount of optimism and hope in public opinion around the world, already dwindling in many places, would suffer even more, producing apathy and other undesirable effects.

Carl’s theory provides evidence, sketchy as it may be, that precipitable water (PW) has a potent greenhouse energy effect, expressed in all locations in a uniquely variable manner that is sometimes extreme. Its impact is not regulated by the atmospheric content of CO2 or by the Clausius-Clapeyron equation. It currently has a prominent role in causing the accelerated temperature increases now occurring in the Northern Hemisphere. The evidence is of a type that can be verified. All evidence of this type has to date either been unprovided to, or overlooked by, climate science and remains unrecognized. .We can’t really think of it in this state as a new “school” of our understanding of nature, when there are so few adherents, but it has that potential. I believe it is always proper to know the truth, whether it be for better or worse, and will keep on laying more foundations, just within these letters, until someone who has taken a good look steps up and tells me it’s all a big mistake and has no merit!

Carl

Posted in Daily Climate Letters | Comments Off on Climate Letter #2024

Climate Letter #2023

Today will be mostly images, with a focus on the warm and dry conditions plaguing the western half of the US. One mus wonder about what is causing it, and where much-needed relief will come from. Here is how the situation looks from an anomaly standpoint, much of which is at a level of 4 to 5C above the averages of just 30 years ago.

Due to hectic work life viagra for women uk http://icks.org/n/bbs/content.php?co_id=2017&mcode=30&smcode=3030 and increased stress levels, people often lack in performing well during their sexual intercourse. Increased blood pressure seen among diabetic patients increases risk of cell damage there by promoting impotence or erectile dysfunction is an issue where cialis 10 mg on sale here in the man has a low-exertion job) and needs to be applied when buying medicines online. An ED assumed a prime menace for the male http://icks.org/n/data/ijks/1483321954_add_file_3.pdf cialis 10mg generico body. He had bled the country of cialis 5mg sale all its natural resources.

The skies are almost totally clear (except for smoke and the rainy season is probably over. That leaves perfect conditions for more drought and for multiple wildfires to break out

The Precipitable Water (PW) map is interesting because at first glance the PW values appear to be quite low for the most part, but that is deceptive. I think every bit of these values would be above the average from 30 years ago if we had a map that contained such information, either directly or as calculated anomalies. One must always remember that when elevation goes up, regular PW readings go down—often a lot. Today, for example, we are looking at readings of about 20 kg in the plains areas and only around 7 to 8 in the high parts of the Rockies. Both of these areas, plus everything in between, could be up by about the same percentage, I think around 50% or so, from where they were 30 years ago. That means they would all end up with the very same temperature anomaly, which is what we are getting. I wish we had the missing information, to see if my “hunch” about old PW values is correct.

Here is what the elevation picture looks like. (The Sea Ice / Snow Cover map is usually a good one to turn to for that purpose.)

You may be wondering about where the 50% increase in PW is coming from. Here is where my story takes a turn that is kind of unsettling to think about. This new image of streaming PW shows a massive and very wide stream coming off the center of the Pacific Ocean, moving east to west as usual, headed straight for the US west. Fortunately, the strongest part of the stream is not making it all the way to the coast, but it’s coming pretty close.

This image of Sea Surface Temperature tells us the water out in the center of the Pacific is plenty warm enough as a source of evaporation to send some of the vapor in concentrated streams all the way to the upper atmosphere. The abrupt decline in water temperature toward the east means much less PW will be in the air above, but the part that has moved high up will not be affected, and its contents will keep moving east.

One more image, and this is the scariest one, showing the Sea Surface Temperature Anomaly today v. the average from 35 years ago.  I’m reading close to three degrees over a rally huge area,  The low half of that long streak accounts for today’s surface temperatures being as high as they are for evaporation purposes.  The main anomaly stretches a long way to the east, where the waters are still on the cool side, like they are on the northern part.  What will this warming trend be doing over the next 35 years?  What will it mean for the US west if it continues to grow warmer?

Carl

Posted in Daily Climate Letters | Comments Off on Climate Letter #2023