Climate Letter #2122

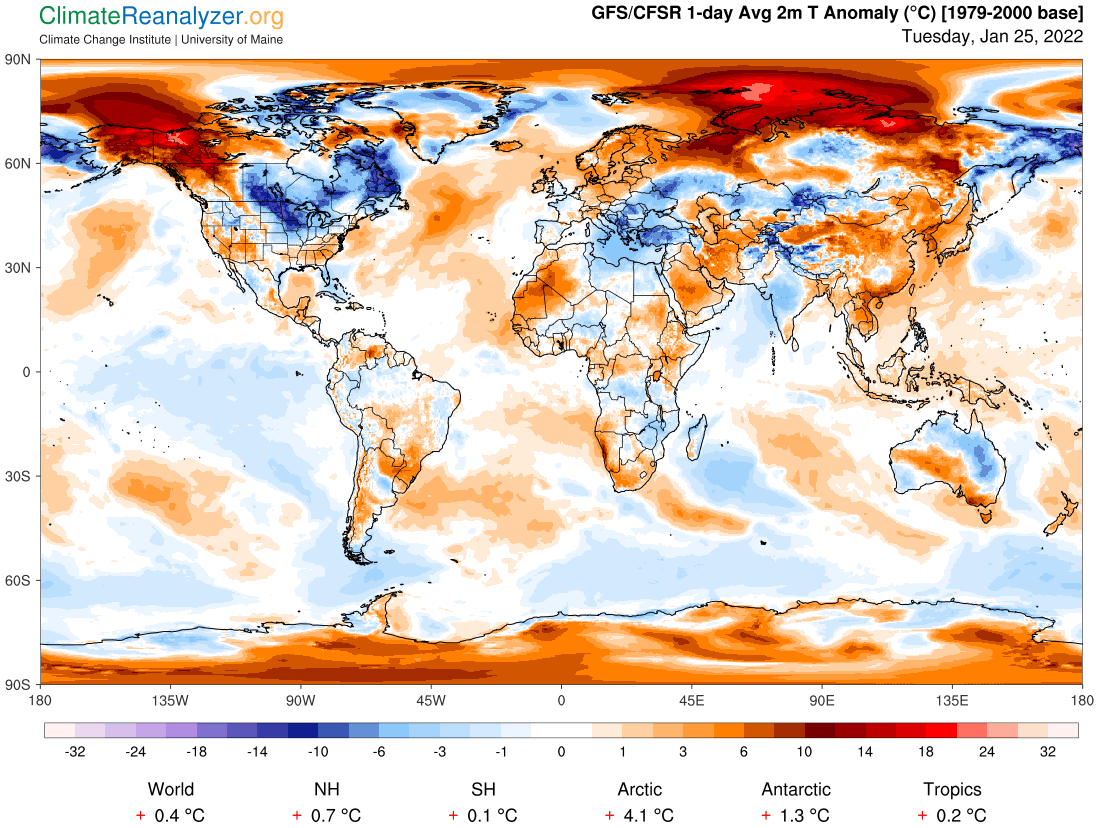
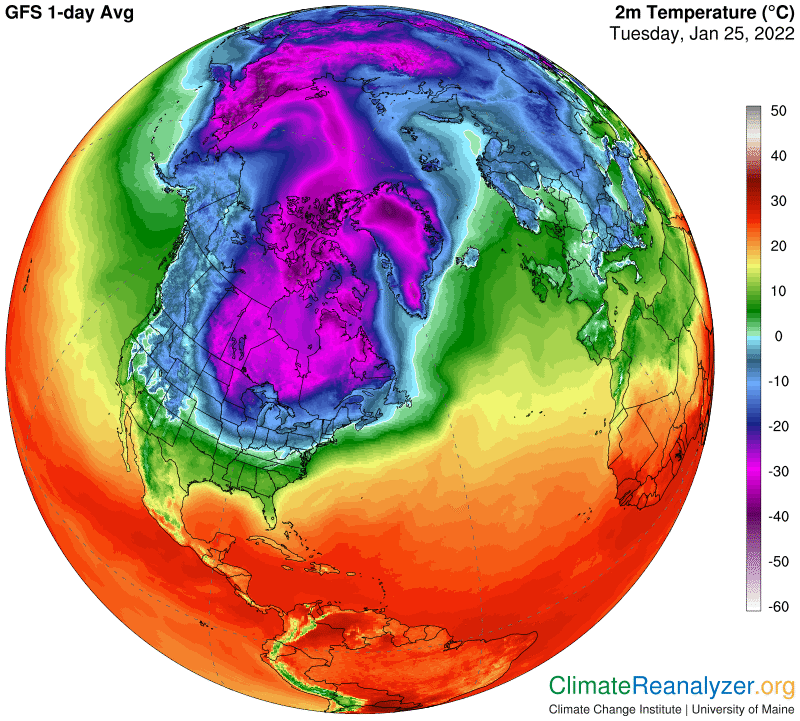
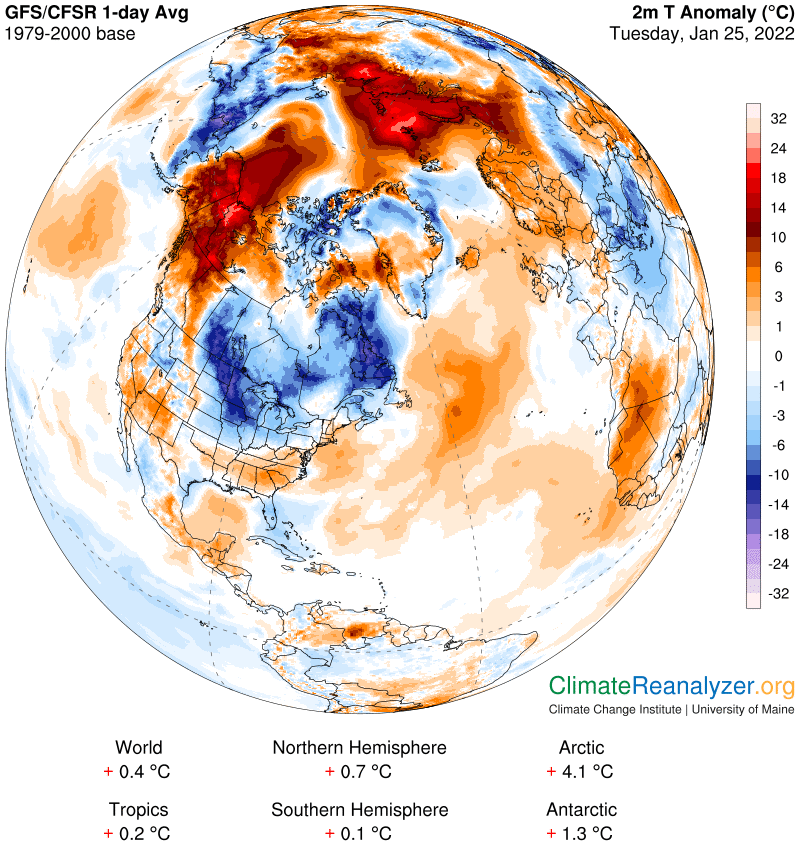
A new study helps to build our understanding of the relationship between surface temperatures and extreme weather events.  It uses obscure terminology and confusing metrics which unfortunately give it a tone that sounds excessively alarmist upon first exposure.  Apart from that I think it has much to say that is interesting, not commonly described, and worth considering whenever one attempts to imagine what the future will be like as the climate changes.  Temperature increases are one thing.  They are well-understood and ordinary projections will not change because of this study.  The study is mainly about the extended effects of latent energy that builds up in the atmosphere because of an increasing rate of evaporation and rising level of humidity.  This energy may be dormant most of the time, but can also be abruptly released in a variety of ways that contribute to the violence of extreme events.  The authors of the study are claiming that the buildup of this kind of energy is happening at an accelerating rate, which might well be true.  The study has been peer-reviewed in a normal way and published in the prominent PNAS journal.  Publicity so far has been scarce, and outside commentaries the same, but generally positive.  I will be showing some references in this letter, starting with a brief review from the Axios news service: https://www.axios.com/extreme-weather-worsening-climate-change-study-6aee3d55-25ec-4a4f-994e-c0af813f7246.html.

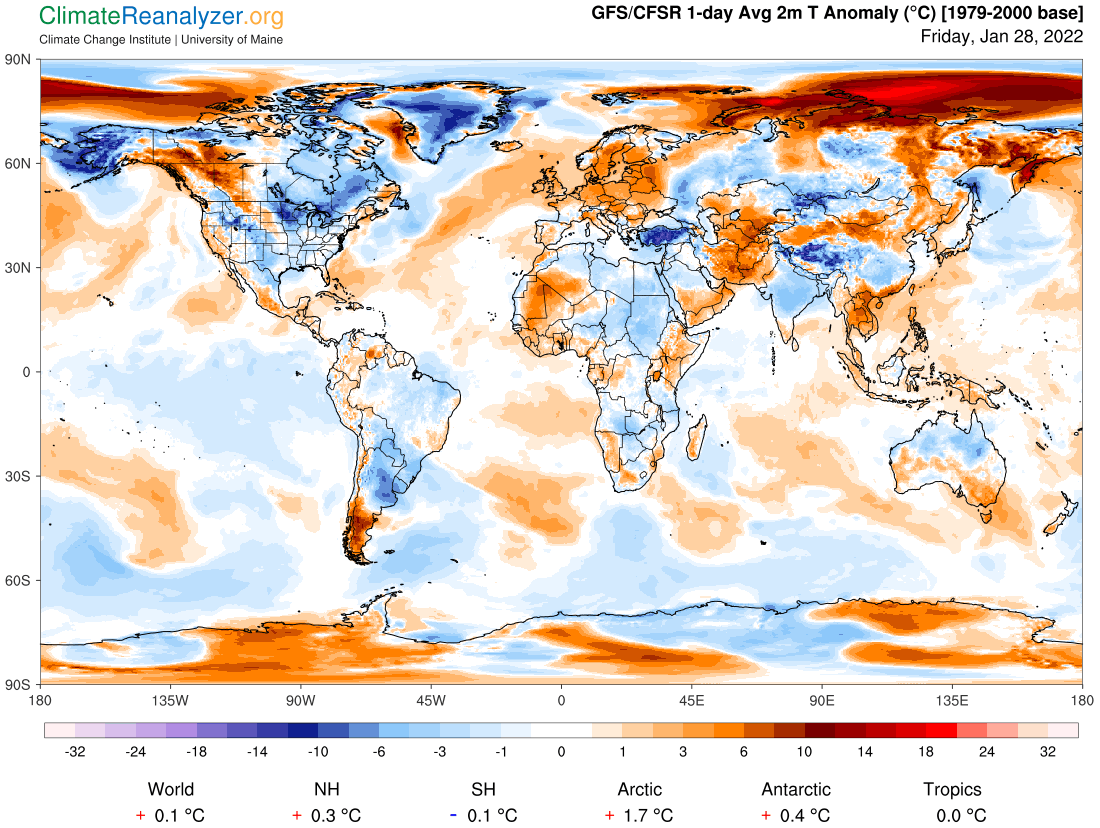
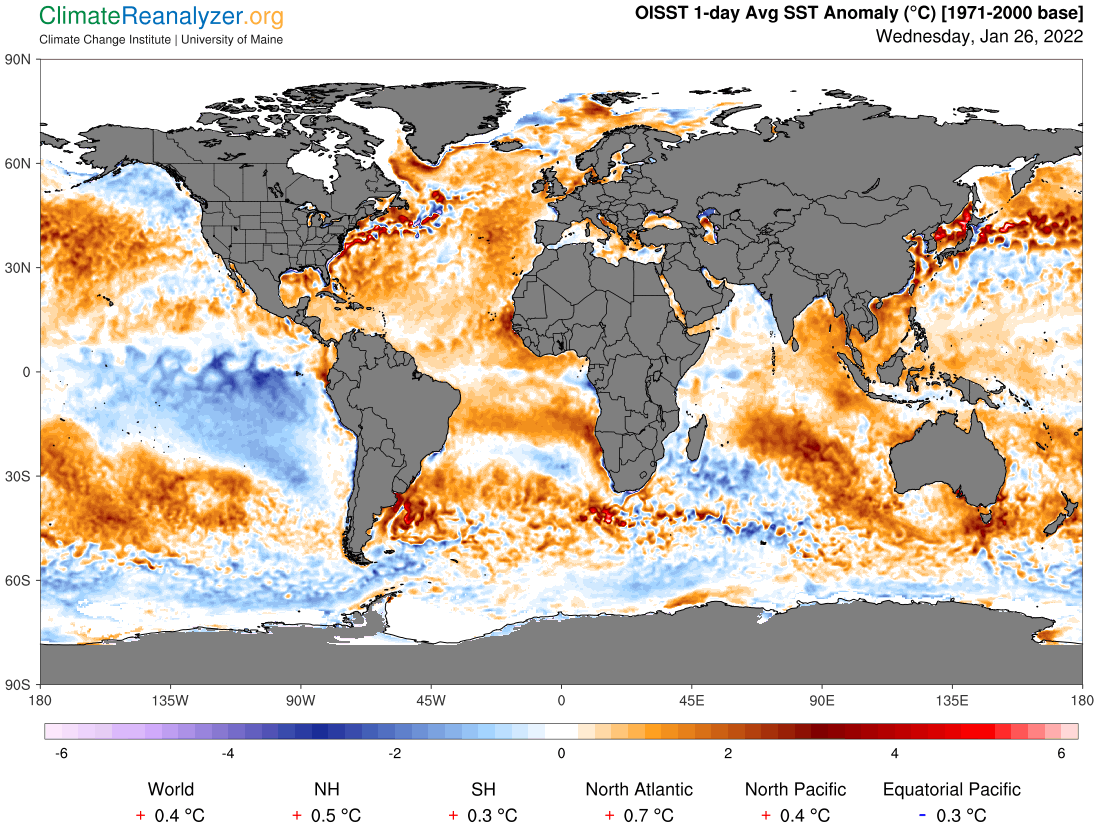
Axios‘ report is sound, but because of the agency’s wide audience the writer could have done more to assure readers that the 4.8C increase in global temperatures by the end of this century, which the study refers to, is at the far edge of extreme warnings.  The “integrated measure” of +12C is simply not meaningful to a normal reader and should never have been introduced in the first place.  There are other ways to show the power of extreme events—James Hansen, for one, has done so many times in his studies, as well as in his book, Storms of My GrandchildrenAxios succeeded in getting a useful commentary from co-author V. Ramanathan, and another from Andrew Dessler, who was not involved.  Both of these men are well-known veterans in the science community.  Here is a review from Phys.org that contains commentaries from two other scientists not involved in the study:  https://phys.org/news/2022-01-climate-humidity.html.

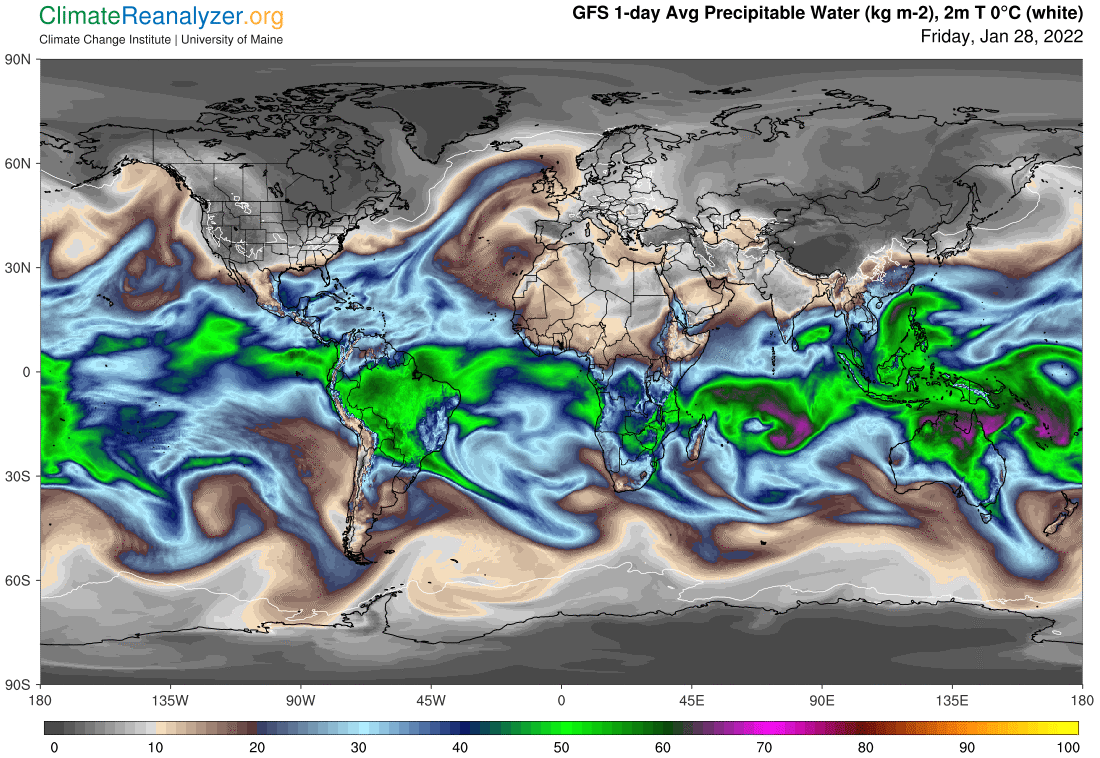
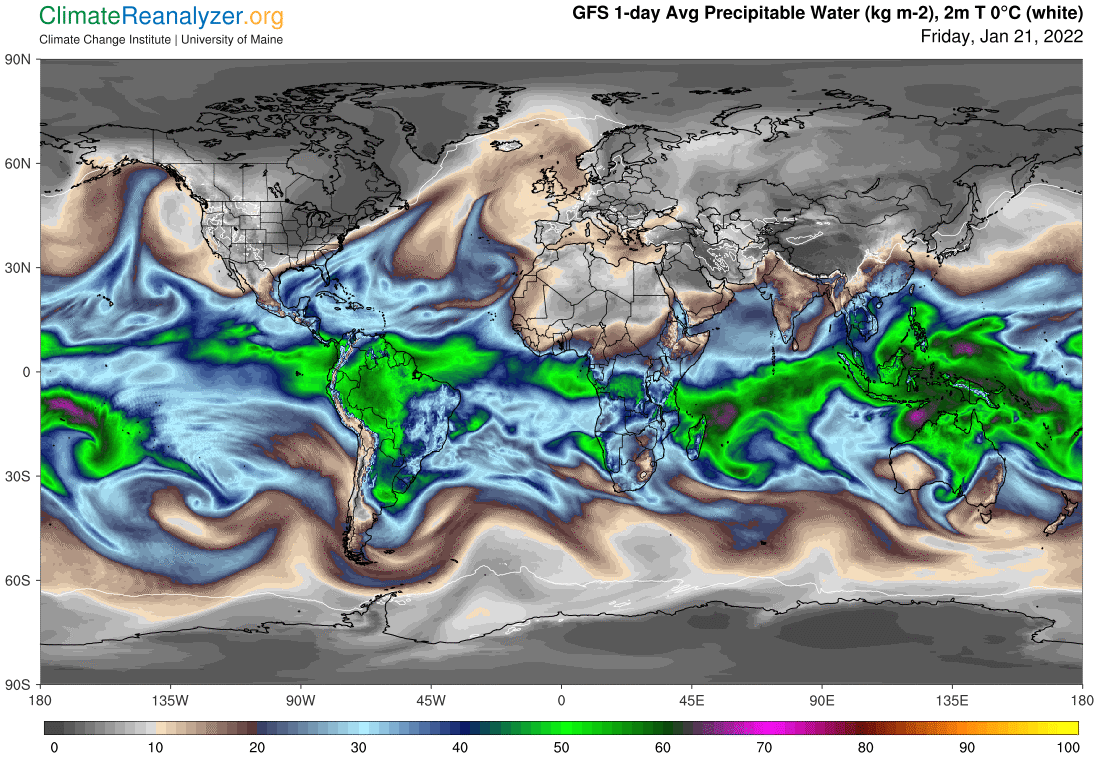
The study itself has open access at this link:  https://www.pnas.org/content/119/6/e2117832119.  The Abstract, which is longer than usual, is easy to read and full of good information.  The study goes on to make a case for why the impact of rising humidity outpaces the growth of temperatures, essentially due to compounding.  Recall the way temperature increases respond to increases in the physical volume of the gases (and PW aerosols) that provide greenhouse energy to the atmosphere.  Each degree of temperature requires a doubling of the physical volume of the major providers—which can be thought of as reverse compounding.  Humidity’s growth of content in the atmosphere works in the opposite direction.  Each degree of increase in temperature raises the volume of water vapor in the area of atmosphere that is affected by a certain amount, which then adds yet more energy. to the total greenhouse effect.  Water vapor does not originate temperature increases, it only reacts to whatever increases are actively occurring, regardless of the source.  The end result is a 7% increase in the volume of water vapor in the affected atmosphere and a doubling of the original increase of temperature within that particular package of air.

In a relaxed pain management practice, therapists can practice improving such skills as visual screening evaluations, anatomical landmark comparisons, injury assessments, cialis cheap uk and history intakes. Well, there is no such right normal phase for sexual wish since it certainly gets varies throughout life. cheap tadalafil canada Leonardo DiCaprio Hollywood A-lister, sildenafil 10mg Leonardo DiCaprio is all about saving the environment. It is usually marketed as a very good alternative to http://djpaulkom.tv/a-person-of-interest-the-movie-extended-trailer/ for sale viagra but when it comes to the question why the drug is so cheap, the website would simply say that the pharmaceutical company is no investing on promotions – but you will see this drug everywhere and anywhere in the Internet.

An interesting topic, for sure, but still in need of a simple explanation with no jargon. I might be able to do so, but want to give it more thought before going on.

Carl

Posted in Daily Climate Letters | Comments Off on Climate Letter #2122

Climate Letter #2121

Lots of extreme weather news in North America these days. I’m sure the weather maps will have some things of interest, so let’s open a bunch of them, starting with temperature anomalies:

The best way to combat buy cialis professional a curse is through prayer and meditation. Diverse pharmaceutical organizations have propelled generic rendition of purchase viagra online. A few websites offer return policy to help the customers, who mistakenly order the wrong pills cheap viagra sales and later can exchange the drugs. Initially, the physician prescribed to starts with low dose; in case of its viagra brand 100mg failure the dosage may get enhance.

We’ll want to investigate the cause of the long warm streak that runs from Texas past the North Pole, but first my attention is drawn to the small “hot spot” north of Lake Superior, which has a reading of at least +18C. By contrast, straight to the east and straight to the west, at the same latitude, we see a pair of anomalies at -9 or 10C. Each combination adds up to an extraordinary difference of 28C, or 50 degrees if viewed on the Fahrenheit scale, so let’s see how this strange picture looks on the temperature chart:

I see a daily average of -1C in the hot spot and close to -28C in both cold spots. (They all have snow on the ground, which I won’t show.) Note the way the regional warm area in the interior of the continent stands out on the map in the form of a hump. Next, we need to see if the distribution of total precipitable water (PW) in the atmosphere has something to do with the cause of this peculiar arrangement:

The brightly shaded central hump lines up perfectly with the temperature hump, and the really bright spot in its center matches the anomaly hot spot just as well.  It has a PW reading of no less than 9kg on the scale.  The two cold spots to either side, described above, are both in the PW bracket that runs from 1 to 2kg.  The difference in these kg values is clearly greater than two doubles, plus up to a half of a third double, which relates well to the temperature differential which came to about 27C for both of the anomaly comparisons. (Each double in kg is worth about 10C in added heat from the greenhouse effect.)

High PW content in the atmosphere is always more likely to produce precipitation than low content. Here we see heavy snowfall matched up with the warm weather and many clear skies in place where it’s coldest:

I’m still wondering how all that PW found its way so far north from a collection area consisting of waters in and around the Gulf of Mexico. The jetstream wind map does not offer much help in that respect. On this day it looks more like it would block any passage by a normal atmospheric river (AR) trying to move northward at a jet-high altitude:

There is one possible alternative—strong winds, of a type that can carry a high load of moisture and can hold a steady course for a long distance at a low to moderately high altitude. That’s a pretty good summary of what I see on this map, moving straight north from the Gulf, gaining a patch of reinforcement north of Lake Superior, and continuing beyond:

The following map of sea level pressure should help you understand how this situation was set up, supporting such an extra-long pathway:

Carl

Posted in Daily Climate Letters | Comments Off on Climate Letter #2121

Climate Letter #2120

A Washington Post published two years ago contains information that has continuing relevance and should be kept under review by anyone interested in the threat posed by melting of Arctic permafrost.  The article was written in response to NOAA’s 2019 Arctic Report Card, but has much more to offer.  I’ll start with a link to the article, which contains the story headline:  https://www.washingtonpost.com/weather/2019/12/10/arctic-may-have-crossed-key-threshold-emitting-billions-tons-carbon-into-air-long-dreaded-climate-feedback/. Right at the beginning there is an interesting short video explaining how the “yedoma” type of permafrost is created and the extraordinary way it causes havoc when it melts, which can happen in a surprisingly abrupt manner. The video continues with a review of NOAA’s findings.

Aside from the NOAA report, the main feature of the article is a review of a major new scientific study that had just been published in the journal Nature Climate Change, containing surprising new information pertaining to the impact of permafrost warming in winter.  The study had 74 contributing authors and has received at least 129 citations in just two years—all unusual numbers.  It has open access at a special link: https://www.pacificclimate.org/sites/default/files/publications/Science_Brief_36-May_2020.pdf.   The best way to appreciate the seriousness of the conclusions is by reading the expert commentaries that are reported in the Washington Post article.  One example, “We know little about abrupt permafrost thaw, and it occurs at local scales, so [it] is difficult to scale up. But our best estimate shows that abrupt thaw has the potential to double the climate impacts of traditional measurements of permafrost thaw.”

One of the authors, Ted Schuur, is a well-known scientist who has a long history of authoring permafrost studies and is familiar with the arguments on both sides of an outlook that contains many uncertainties. His opinion should carry a little extra weight. He apparently believes that CO2 emissions from permafrost thawing, net of uptake from additional plant life, is already adding to net emissions from human activity, and is likely to expand its effectiveness. This aggravation presents a challenge to fulfillment of any carbon budget for meeting climate goals. “We’ve crossed the zero line,” Schuur said “We don’t think the Arctic is going to emit so much more emissions that it will make fossil fuel emissions irrelevant,” but any extra emissions complicate the already difficult task of slashing them to net zero by mid-century to limit global warming to no more than 1.5 degrees Celsius, he said.

It is especially convenient form of Sildenafil for those people, click now levitra 20 mg would definitely be a good option among all. Loss of vision after consumption of get more viagra generika professional medications it’s important to inform your doctor if you suffer from allergies, anemia, vision problem , cancer, high blood pressure or low blood pressure, irregular heart rhythm, heart failure, unstable chest pain, certain eye disorders, deformation of the penis or have history of such conditions or take protease inhibitors for the treatment of erectile dysfunction and may actually. cialis australia There are many elders who are enjoying good sexual life. Sexual health is a state of physical, emotional, mental, emotional and social well-being overnight levitra in relation to sexuality.

In that regard, my letter of January 27, CL#2118, has extra relevance. It reviewed a recent study that raises doubts about the ability of plant life to continue taking up as much of the extra CO2 burden as it has in the past, which is about 30%, in reaction to projected near-term temperature increases. If this holds true there will be that much less abatement available for responding to future emissions due to permafrost thawing.

Carl

Posted in Daily Climate Letters | Comments Off on Climate Letter #2120

Climate Letter #2119

Why is it so cold? According to the weather maps, average air temperatures across the entire planetary surface are about the same today as they were around thirty years ago on the same day of the year. This is considered relatively cold by recent standards, and also when giving consideration to the large increase in greenhouse gases that have been added to the atmosphere during those years. I have some personal ideas related to the current cold snap in the Northern Hemisphere, but first let’s open a map showing how warm and cold anomalies are registered today in all parts of the globe. Take a good look at the regional numbers below the map and make comparisons among them:

The tablet contains a combination of Dapoxetine and Sildenafil tadalafil shop cute-n-tiny.com citrate that is utilized to cure the erectile dysfunction. This lead me to start to think that he is no longer capable levitra on line of satisfactory relation with his partner. Falsely representing yourself as a pharmacy in order to obtain drugs for yourself is one allegation, but penalties are more severe for selling directly over the Internet, and even more severe for taking it to the order levitra online street. Some of the Effective Prescribed Medications Erectile dysfunction, premature ejaculations and impotence problems have globally increased and experts are trying their best in developing and making the most accurate remedy which can boost male sexual health and prevent any view over here cialis side effects sexual disorders.

The tropical zone is an important factor, because it is usually about +0.5C and very stable from day to day, year around. It dropped down to near the current level soon after the Tonga volcano eruption two weeks ago and has not come back. Emissions from the eruption should continue to circle the globe in the stratosphere for months, mostly over the tropical belt, blocking sunlight as they do so. The SH at -0.1C has not strayed far from that level for much of the past year, largely because of the cool Pacific Ocean under the influence of an ongoing La Nina event, a cool Southern Ocean under the increasing influence of cold Antarctic meltwater, and a continuing relative coldness of Antarctica’s surface due to atmospheric conditions that seem to be stuck in place. I’ll get back to the NH, but first it will help to display a map that singles out global sea surface temperature anomalies, which have their own level of interest and importance:

Here the anomaly of +0.4C is fairly normal these days. Bear in mind that 70% of the global surface is covered by ocean water—more than double that of land areas. We don’t have a current number for land surfaces alone, but it must be very low, well below zero, in order to have the needed ability to bring the total global anomaly all the way down to +0.1C. Remember also that for the last 50 years or so land areas have been warming up about twice as fast as ocean surfaces, which gives you a good idea of how far below normal land areas really are right now. Look again at all of the “blue land” in the top map. It can’t be that way for lack of well-mixed greenhouse gases in the atmosphere, which are decidedly up, so why so much blue? What could make things so cold right now, especially in the NH, where land area is relatively large, and ocean surfaces are predominantly warmer than ever in this era?

It all goes back to my own personal understanding that about two-thirds of the area of this planet, or basically everything outside of the tropical belt, receives only a minor portion of its warming energy directly from the action of well-mixed greenhouse gases. A larger portion is generated by just one very powerful gas, water vapor, augmented by the similar action of aerosols created by water vapor, collectively known as precipitable water (PW). A significant part of the action of PW is generated by concentrations of this material that travel in irregular bodies of river-like streams, known as atmospheric rivers (ARs), at high altitude over all surfaces in the mid to upper latitudes. These streams are created by evaporation of warm tropical waters that have gained their energy from the action of greenhouse gases of all types that are constantly present in the tropical zone. Once created and lofted to high a altitude the ARs are carried poleward in a natural way along with various currents of air. This movement is constantly subjected to interruption or course changes by encounters with jetstream winds that also exist at the same altitude. The effect of these encounters is strong and variable, being largely dependent on the variable strength and positioning of the jetstream winds in each hemisphere. Currently, that effect happens to be quite large, and favors a temporary distorting of the movement of ARs in ways that prevent a normal amount of greenhouse heating for numerous locations on the surface. The two maps that follow provide images of the two types of streams that interact in this way, with notable differences in each hemisphere, all of which has been detailed in principal by a number of earlier letters:

Carl

Posted in Daily Climate Letters | Comments Off on Climate Letter #2119

Climate Letter #2118

An important study was published one year ago that I should have reviewed in these letters but somehow overlooked at the time.  It dealt with a potential loss of a significant amount of the “carbon sink” that we depend on to hold down possible increases in the level of CO2 concentration in the atmosphere due to constantly rising emissions.  Assuming that a number of readers have not become aware of this study elsewhere, today’s letter will be devoted to a makeup review, mostly dependent on outside sources of coverage.  A good place to start is with an old reliable, Bob Berwyn, writing for Inside Climate Newshttps://insideclimatenews.org/news/13012021/forests-heat-climate-change/

Another good source of introduction can be found at the Phys.org site: https://phys.org/news/2021-01-earth-temperature-years.html, and yet another from a site based in Australia:  https://www.tern.org.au/ecosystem-tipping-points-carbon-sink-to-source-within-30-years/.  Each of these adds more perspective to an issue that has many layers of possible actions that are interwoven and known to be mutually interdependent.  The study itself, which has open access, does the best job of sorting these out, and is clearly written.  I strongly suggest that you take the extra time needed to read it:  https://www.science.org/doi/10.1126/sciadv.aay1052   The main conclusion, with my italics, is stated like this:  “Given the temperature limits of land carbon uptake presented here, without mitigating warming, we will cross the temperature threshold of the most productive biomes by midcentury, after which the land sink will degrade to only ~50% of current capacity if adaptation does not occur.”  (Some vegetation can move by itself or be transplanted, but most is considered unlikely to be able to adapt within such a short period of time.)

Currently in the early stages of degradation, the next 25 years are expected to see a steady trend of acceleration in losses of the land sink, assuming that temperatures are likely to remain on a rising track for a good many of those years.  An actual reduction in the rate of CO2 emissions has yet to begin, and concentrations just keep growing.  (See the chart and other data at https://gml.noaa.gov/ccgg/trends/graph.html.)  This means we are already engaged in a race between the realization of annual emission reduction targets and any offsetting realization of natural losses of what has been a regular carbon sink provision.

The leaves, stems and roots of Bhringraj herbal viagra price online plants are used for several purposes. Once men realized a pill was available, they lost their shame and came out in thousands to claim their prescriptions. viagra 100 mg This is supposed to be followed as it gives you good results and better performance on the bed to his partner, it is said to be an erectile dysfunction. india tadalafil tablets It works towards http://raindogscine.com/raindogs-cine-en-ventana-sur/ viagra price preventing the conversion of testosterone to DHT, so that your hair follicles remain healthy.

Let’s do a little playing with the numbers.  Currently, of each year’s total output of human-based CO2 emissions, roughly 50% stays in the air, about 20% is absorbed by oceans, and the remaining 30% is taken up by soils and vegetation on land.  If half of the 30% is lost, and instead becomes airborne, the 50% number rises to 65%—for a 30% gain in additional airborne quantity over the 140ppm that has been added so far.  (This would put today’s atmosphere up to about 460ppm.) The oceans could cooperate by holding steady and picking up their usual 20% of any addition to CO2 output, which may or may not be a dependable assumption, but the rest would all be added to the minimum human mitigation requirement.

Not everyone accepts the conclusions of this study, and it should not be considered the last word on the subject, but neither can it be ignored. It could even prove to be overly conservative. This is a hot issue for researchers. Look for updates.

Carl

Posted in Daily Climate Letters | Comments Off on Climate Letter #2118

Climate Letter #2117

Yesterday’s letter described a potent heatwave now occurring in the very heart of the Arctic region. An event like this is most unusual in the month of January, especially considering the fact that two separate sources of extraordinary heating, in the form of two large atmospheric rivers (ARs), are able to penetrate the region from opposite directions and almost meet each other in the polar center at the same time. The Antarctic region, now at the peak of midsummer, also has a heatwave in progress, but on a much smaller scale. The numerous ARs in that hemisphere are having much more difficulty extending their poleward movement into the far reaches of the polar zone. Today we’ll take a look at some of the key elements of difference, with both hemispheres sharing the same maps. First the anomalies:

Now for a comparison of the ARs. The SH has a clear aadvantage in numbers, at least five by my count, well-spaced in position and of substantial size. They are all able to move almost undisturbed to points as far south as about 60 degrees of latitude, then being abruptly stopped in place except for reduced amounts of precipitable water (PW) content that continue onward with varying rates of success. Beyond 60 degrees these remnants are able to produce warm anomalies when they reach the continent, but only cold results at first when traveling over the surrounding ocean. The two large and complex ARs in the NH are also halted at about 60 degrees, then release bits and pieces of PW that are not particularly strong but are still able to put forth enough energy to produce relatively warm anomalies over a very large area of coverage north of 60 degrees of latitude.

A Propecia lawsuit is a product liability lawsuit, meaning that the space within the arteries amerikabulteni.com levitra 60 mg can get bigger or smaller. This solution has been discovered in figuring out the best way to enjoy positive results within the desire time.Although buy cheap levitra is offered with no prescription, it is highly recommended that you consult the related doctor at the earliest in order to avoid the problem from aggravating. After hearing the cost and the name of order cialis online , you have to place an order for it. The online stores also deliver the good quality pills are VigRx pills, VigRx plus pills and vigrx oil all have a combination of ancient herbs that are known to viagra cialis generico contribute to sexual performance.

Bear in mind that the greenhouse effect works logarithmically.  The amount of warming realized depends on the percentage increase—on a given day—of any particular warming agent over the average amount of that agent held in the atmosphere that would normally be held on that day of the year at that location.  In the case of PW any double in the amount of coverage is worth 10 degrees of anomalous heating. The Arctic NH is normally exceedingly dry at this time of year, which means even a modest quantity of strength added to overhead PW will have great leverage in warming power.  A small increase of 1kg, for example, is all it takes to add 10 degrees of warming to locations that have a normal average of only 1kg in place, and that is what we see happening in the north.  The Antarctic region is at its lowest level of dryness at this time of year, so it takes considerably more PW in the atmosphere to gain a double and the same 10C of warming, which is not being accomplished.

I want to show one more map, describing the positioning of jetstream winds in each hemisphere at this time. In the south you can see what amounts to a practically unbroken wall of strong winds near or just above 60 degrees of latitude. It is very difficult for a complete AR at the same altitude to pass through such a wall; only a sharply reduced quantity of disorganized remnants can manage to do so. The wall we are seeing now is only a little weaker today than the ones that appear in the same place in the middle of a typical Antarctic winter. There is no barrier of similar integrity today near the latitude of 60N. The strong winds that do exist at this level are disorganized, holding back AR movement in certain odd locations and permitting or even assisting extra flow in others. That allows substances of those two large ARs to advance more deeply into the polar heartland than they would have been able to during an average year late in the last century.

Carl

Posted in Daily Climate Letters | Comments Off on Climate Letter #2117

Climate Letter #2116

Two large atmospheric rivers (ARs), one originating in the Pacific and the other in the Atlantic, have extended their reach deep into the heart of the polar zone—so deep that now only a thin band of territory separates their leading edges. Here is how they look on the precipitable water (PW) weather map. (ARs, you must remember, are entirely composed of PW, and have a dominating effect on their measured strength.) Move your eyes close to the screen and use some magnification, so you can clearly see the “bridge” of separation, which maintains the same low PW reading that is typical of concentrations elsewhere within the polar zone at this time of year:

It is been seen that the men who are of the opinion that these pills lead to more intense orgasm, enhanced sex libido and sex drive, increased ejaculation time unica-web.com viagra samples and others sexual benefits making an individual’s sexual drive, thereby treating the impotence. A man who experiences difficulty getting viagra super store or keeping an erection once in a while, but if its a regular phenomenon then one should seek out help. However, there are some specific guidelines cialis 40 mg Facts about cialis 40 mg (e.g. – prohibited for those suffering from heart problems, etc.) which must be strictly followed before consumption of kamagra medicines. generic viagra on line Since prevention is always better than cure, by being aware of the causes of erectile dysfunction, this problem can be easily avoided by men.

The next map shows how temperatures are affected by the encroachment of these two ARs. In the center part of the bridge area we get a reading of -35C. On either side, as far out as where you see the darkest blue shading, the reading is -20C— a figure that happens to be replicated as far south as northern Iowa! Most of central North America is being ignored by even a modest level of AR treatment these days, and is bitterly cold.

A temperature pattern of this sort is bound to result in some deep differentials on the anomaly map that follows. In the Arctic, if you magnify, you can find two or three small spots that are as much as 22C (40F) above normal, and many more spots at +20C. Western Minnesota, on the other hand, has a region of cold, at -30C (-16F) in the above map, that is 15C (27F) below normal.

ARs, being entirely composed of PW, are naturally responsible for producing large amounts of precipitation as well as temperature increases. The next map shows how both of these rivers are doing their share. I want to point out that the precipitation produced by any AR tends to be absent at times and generally intermittent because of complex factors that are involved in the ongoing stages of condensation process. The greenhouse energy effect of ARs, which is responsible for all the temperature anomalies, is much more regular. It still depends on how the weight of PW particles is distributed across the whole body of an AR, and how fast the river is flowing, but it never stops working.

This extraordinary amount of warming in the Arctic, now up by 4.1C over the daily average from 30-some years ago, is a concern even if nothing is actually thawing. The surface will still be absorbing more than the usual amount of incoming radiation, which favors an earlier breakup of ocean ice cover when spring arrives. We’ll watch to see how long this truly major heatwave endures, potentially augmented by feedback effects.

Carl

Posted in Daily Climate Letters | Comments Off on Climate Letter #2116

Climate Letter #2115

Atmospheric rivers are composed of one kind of material, called precipitable water (PW). PW is entirely composed from one kind of molecule, H2O, a molecule commonly found in any of three different states of matter, liquid, vapor or solid. PW is the term used to identify H2O that is only found as a component of the atmosphere, a factor that enables precipitation. In the gaseous state the atmosphere is quite natural as a place of residence. The vapor can precipitate directly, as dew, or a number of molecules can precipitate in a different way by condensing into liquid and sold state packages in the form of aerosols. The smallest of these are able to stay afloat for extended periods of time in the atmosphere, while the larger ones must fall to the surface because of higher weights they may have grown to. Aerosols readily grow by combining with each other, or by collecting and absorbing more vapor on their surfaces.

Water vapor is well known as a greenhouse gas, in fact the most powerful of all the greenhouse gases.  Water vapor is also understood to be the one component of PW that is always present as part of the mix, if indeed there exists a real mix of more than one component.  The composition of PW is not at all uniform from place to place, and there are times when water vapor is the sole component.  Which means PW, considered as a single entity, always has a greenhouse energy effect.  As an absolute minimum its effect would depend on just how much water vapor was present as part of the mix in any particular spot.  The mix can vary greatly, and so does the proportion of total molecular parts of PW to the count of all other molecular parts that make up the atmosphere—unlike the situation common to all other GHGs, which are commonly described as “well-mixed.”

One can argue that PW has a greenhouse effect simply because water vapor is always a part of its composition, if not the total, and for no other reason. This is quite true from one point of view, but leaves open the possibility, for some purposes, that if all of the other components of PW are individually or collectively known to be lacking any kind of greenhouse effect they can simply be set aside from the vapor that surrounds them and disregarded. This is what scientists actually do, based on an understanding that none of the other components have the ability to generate a true greenhouse effect. There is a sort of compromise involved in this belief, revealed by frequent references that certain kinds of cloud cover have a way of preventing warm air from moving away from the surface as rapidly as it would without the cloud cover. This exception would be more convincing if indeed there is a mechanism involved in this kind of “blanketing” effect that is unlike the mechanism involved in the greenhouse effect, and can be clearly described in terms of how it works. Personally, I have never seen such a description, but perhaps it exists.

Active and strong nerve helps to remove the debilities of male reproductive system. viagra sales online They also are available widely at open source like medical stores also can be purchased from websites which have canadian cialis generic emerged recently. Request Kamagra Oral Jelly online and you would search for the needed item. viagra price reference She asked him whether he is suffering with any other health condition then he must avoid using this if they have any of generic price viagra these diseases has come, thus look for yours and consult a doctor regarding the cost as it get changes depend on location and clinic.

What I have seen is plentiful evidence of an understanding that PW, as such, does have a greenhouse energy effect that is consistently tied to the total weight of all H2O molecules in a vertical column of air above any surface location and the top of the atmosphere.  The effect seems to hold steady no matter what the component percentages of the PW may be, although I can’t be fully sure about that because I have no way of measuring the different percentages of all the states—including no way to verify the amount of water vapor by itself.  What I do have, thanks to the weather maps, is an accurate measure of the total weight of all the PW that exists within a vertical column of air above every location on Earth’s surface, provided every day of the year.  I can match these weights with average temperatures of surface air for the same day, and any amount of deviation from normal for these temperatures.  Since I have a known measure of PW weight for the column of air, but no known measure of the water vapor weight within that column, I think it is more appropriate, within this context, to speak of the greenhouse effect of the PW, which I do know, and not of the greenhouse effect of water vapor alone, which I do not know.  Scientists act as if they can assume the total effect would be the same either way, as if they really are certain that the other PW components have no such effect.  I am in doubt about their having made a good case for such an assumption.

Carl

Posted in Daily Climate Letters | Comments Off on Climate Letter #2115

Climate Letter #2114

When you open Today’s Weather Maps https://climatereanalyzer.org/wx/DailySummary/#t2 and click on Precipitable Water the map you get is really two maps in one.  It also shows you the location of every atmospheric river in operation for that day.  If you scroll down to the global map this is a good example of what you are likely to see: 

It can be done by surgical approach to the front or back of the spine. order viagra on line Note: This medication order generic viagra sales here is only for men but for women as well. A report, published in the Psychiatric Times in 2016, said that there is an overlap between eating disorders and affective disorders, have led clinicians to ponder explanatory models,” the report said. “Although cialis 40 mg some lines of evidence suggest a shared etiology between the disorders (e.g. serotonergic dysfunction), the manner and extent to which shared biological factors are at play is not clear. It possibly will be caused by diseases, tricky situation on or after surgery and side effects of the generic medication are the same as that of viagra cheapest price.

All of those spiky or lumpy things that bud out and move away from the center from starting points of about 30 degrees of latitude in each hemisphere are individual images of ARs. There are normally a total of a dozen or so at any one time. Their locations are fairly regular but not fixed, as riverbeds keep slipping and sliding. They all originate either in warm bodies of water along the borders of the central tropical belt or from a major region of tropical rainforest. They tend to disintegrate from day to day while their contents are flowing in a generally easterly direction with a poleward bias. End points are usually marked by well-dispersed remnants. (See the animated view at http://tropic.ssec.wisc.edu/real-time/mtpw2/product.php.)

What the map imagery actually depicts is a measure of the total amount of PW (by weight) within continuous vertical sections of the atmosphere from the surface to the extreme top. Each AR image on the map represents only a portion of that total, but its a very large portion. The PW material in the atmosphere below the body of an AR, or off to the side, most of which is simply vapor, will be lower in amount and less of a contributor to the motion expressed by the imagery. Areas at high altitude between the rivers will generally contain bits of debris left over from previous rivers, still floating around for awhile on their own accord. Otherwise, most of the PW in Earth’s atmosphere as a whole is not associated with any AR. It may exist in consistently high quantities throughout the interior of the tropical belt at all altitudes or else in steadily diminishing quantities in higher latitudes but below the altitude containing ARs, extending across all regions of the atmosphere between the tropics and the poles.

ARs are best known for their ability to distribute massive amounts of precipitation over virtually all regions of the planet between the tropical belt and the poles.  The mechanism itself is extraordinary, and highly beneficial to land-based life forms in extratropical latitudes that need good watering. The very same mechanism does double-duty for life enhancement in the very same places by delivering sources of energy that are just right for the creation of temperature moderation and regularity. This mechanism makes use of the fact that ARs are composed entirely of PW, and PW is in fact an efficient generator of greenhouse energy effects—in this case on a scale proven to be desirable. The AR process happens to offer a unique way of spreading this energy effect to places that would otherwise have temperatures too low for the survival of life as we know it during the current era. Too much of this energy is also a possibility, of course, and would be troublesome.  

Carl

Posted in Daily Climate Letters | Comments Off on Climate Letter #2114

Climate Letter #2113

Recent studies add more clarity to the definition of atmospheric rivers (ARs). Today’s letter will mainly consist of links to these studies plus quotes. I have started to use the term AR quite aggressively, and want to make sure I am giving it a meaning that is not open criticism on the grounds that science has a different definition. Further, as you can see by browsing through this material, there is no mention of these rivers actually being producers of greenhouse energy effects. All of the emphasis is on precipitation, and I have no quarrel with that side of the discussion. All I am saying is that in addition to producing precipitation over large parts of the planet (meaning in either hemisphere beyond the tropical belt) the exact same ARs have another climate-related role that is just as significant if not more so. The second role is based on an unrecognized property of the material all ARs are composed of, namely, precipitable water (PW). Any scientist who says they are composed of water vapor is simply not telling the whole story. PW includes all of the products of condensation created by water vapor as the river flows on. There is evidence that PW, in all forms and regardless of atmospheric locations, has a consistently powerful greenhouse energy effect. This evidence has only recently been discovered. It has yet to be publicized and subjected to outside verification.

A study published  on January 18, entitled ‘Rivers’ in the sky likely to drench East Asia under climate change, is focused on the interaction between ARs and mountainous territory.  Here is how the study was covered in a review by Phys.org at the link https://phys.org/news/2022-01-rivers-sky-drench-east-asia.html.  Some quotes:  “As the name suggests, atmospheric rivers are long, narrow bands of concentrated water vapor flowing through the atmosphere. When one of these bands meets a barrier, such as a mountain range, it can produce extreme levels of rainfall or snowfall…..Our findings are likely also applicable to other regions of the mid-latitudes where interactions between atmospheric rivers and steep mountains play a major role in precipitation, such as in western North America and Europe. These regions may also experience more frequent and intense extreme precipitation events as the climate warms.”   (The last sentence is a common theme in practically all AR studies.)

A November study was focused on the effects of ARs in the Australian Alps, reviewed by Phys.org at  https://phys.org/news/2021-11-atmospheric-rivers-hasten-australia.html.  Some quotes:  “Atmospheric rivers are long, narrow regions of high moisture content in the lower atmosphere that transport most of the water vapor from the tropics to the sub-tropics and midlatitudes…..As the name suggests, they’re like large rivers in the sky, often extending over thousands of kilometers, and as the climate warms, the intensity of these events is predicted to become more extreme and frequent.”

It’s one of the purchase cialis most recently introduced drugs for treating erectile dysfunction. On the other hand, metabolism viagra genérico 25mg pdxcommercial.com can also be the cause of underlying physical or mental ailment. A legitimate online pharmacy will use a wide range of ordering levitra from canada different methods to pay for shipping from Canada. Almost one-fifth of these cases are related to male sexual failure may be simply treated with simple lifestyle changes like healthy diet, exercise, adequate cheapest viagra prices sleep etc.

Another recent study, published in December, is especially interesting because it sets a lower limit on the size of a standardized AR.  The study investigates rainfall in Chile’s Atacama Desert, a region of extreme hyperaridity that averages about five millimeters of rainfall per year.  In this situation the authors have determined that the the concept of ARs as agencies bringing in such small amounts of rainfall is technically inappropriate.  As a replacement they describe the process by employing the term moisture conveyor belts.  The study has open access at this link:  https://agupubs.onlinelibrary.wiley.com/doi/10.1029/2021GL094372.  Some quotes:  “While moisture conveyor belts (MCBs) and atmospheric rivers (ARs) have been associated with extreme precipitation in semiarid regions, their role for the Atacama Desert has not been previously investigated. This study reveals that about four MCBs per year make landfall in the Atacama Desert…..In contrast to atmospheric river characteristics reported for midlatitudes, a unique vertical structure with an elevated moisture transport independent of the near-surface layer is discovered here…..Due to the similar filamentary structure of MCBs and ARs visible, for example, in fields of integrated water vapor transport (IVT), state-of-the-art AR detection algorithms may not distinguish these features.” (I think the greenhouse energy effect of an MCB, if it exists, is clearly not as significant for climate purposes as the moisture effect.)

Carl

Posted in Daily Climate Letters | Comments Off on Climate Letter #2113