Climate Letter #2102

Another way to look at our commitment to future warming above 2C, even if there is a substantial lowering of CO2 and other emissions soon to come and no major increase in their concentrations.  Yesterday we reviewed a study from China that corroborated James Hansen’s claim that removal of sulfate aerosols would make a little more than +2C likely by mid-century. The study clearly allows for added effects from CO2 emissions that are sure to accumulate during a time of rapid reduction toward net-zero—about the best we can hope for. I think Hansen may be a little less optimistic on that score, but hopeful.  Another idea about future commitment was expressed in a study issued early last year, based on a separate set of developments that are likely to unfold over the next several centuries. This study does not speak directly about emissions, but is based on an assumption that CO2 concentrations can be stabilized not too far above levels before the end of this century. This would be a troublesome outcome but at least would give us extra time to develop counter-measures aimed at speedy removal of CO2 from the atmosphere. 

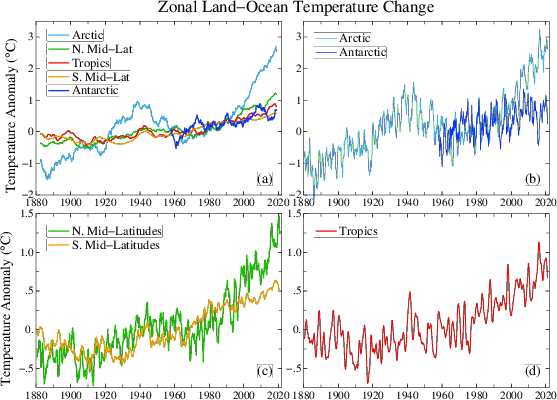
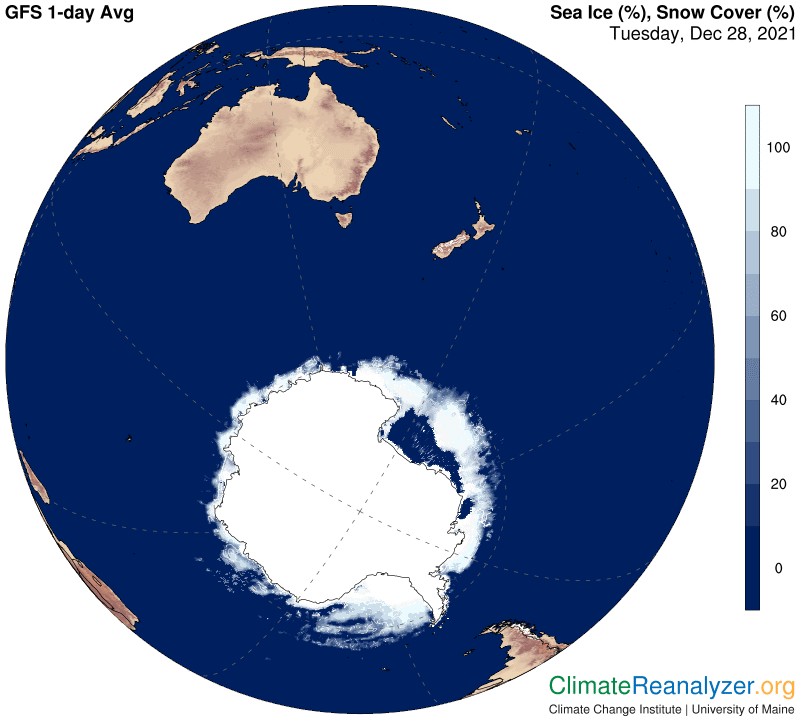
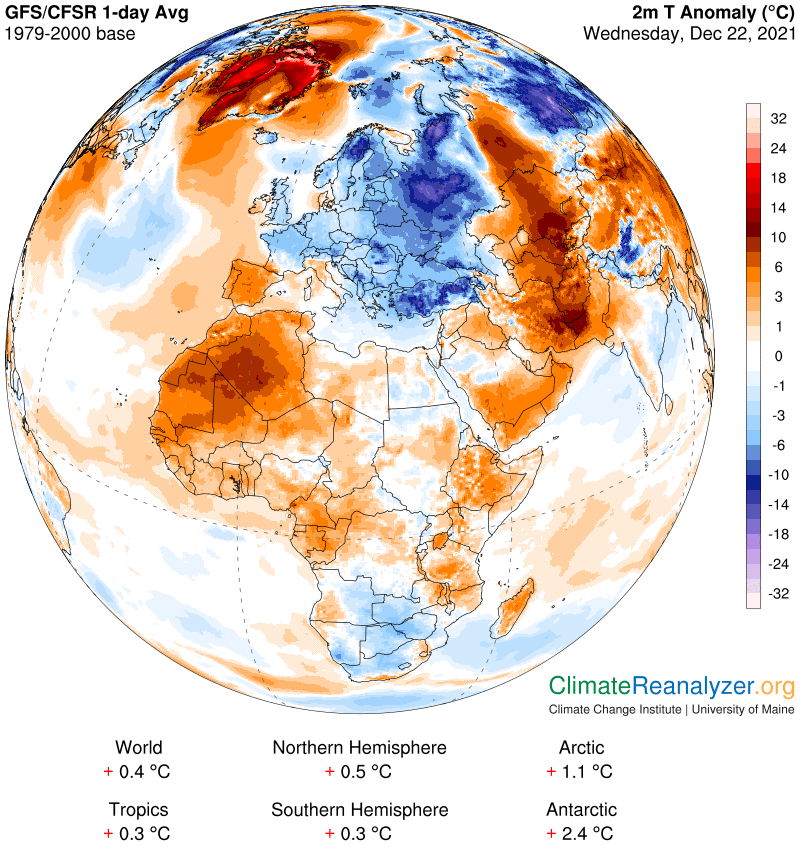
This study was published in a highly respected American journal, Nature Climate Change, entitled “Greater committed warming after accounting for the pattern effect.”  One of the authors was Andrew Dessler, a popular professor at Texas A&M who is known for being a leader of previous ground-breaking studies. I’ll let him explain the significance of this work in a 6-minute video that clarifies what is meant by the “pattern effect,” a term that is seldom employed in other studies:  https://www.youtube.com/watch?v=LV9aCiyui18.  As a backup for Dessler’s viewpoint, CL#2098 on December 30 included a graphic comparison of Earth”s five major climate zones, showing how uneven the warming pattern has been in recent decades—the Arctic region has warmed up the most of all, by almost 3C, while the Antarctic has hardly budged.  One reason for the difference is the much heavier cloud cover in the Antarctic during the daylight period, which the authors of the study expect will be reduced over time.

A good review of the study is also provided by another author, Mark Zelinka, which can be found at this site: https://climatemodeling.science.energy.gov/research-highlights/greater-committed-warming-after-accounting-pattern-effect.  For the study’s abstract go to https://www.nature.com/articles/s41558-020-00955-x.  Note how the abstract states that the commitment temporarily rises “above 2C,” then falls back to 1.5C by the end of this century, with both numbers subject to revision. Elsewhere, the authors are said to have a best estimate of +2.3C at the temporary peak, a disturbingly high figure, which is included in the standard review from Phys.org:  https://phys.org/news/2021-01-emissions-weve.html.

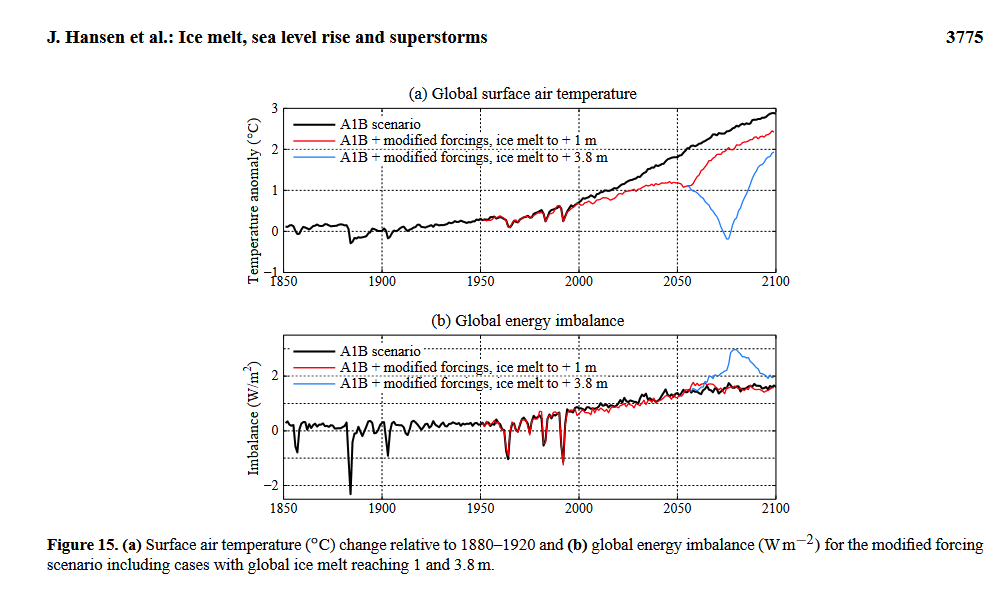
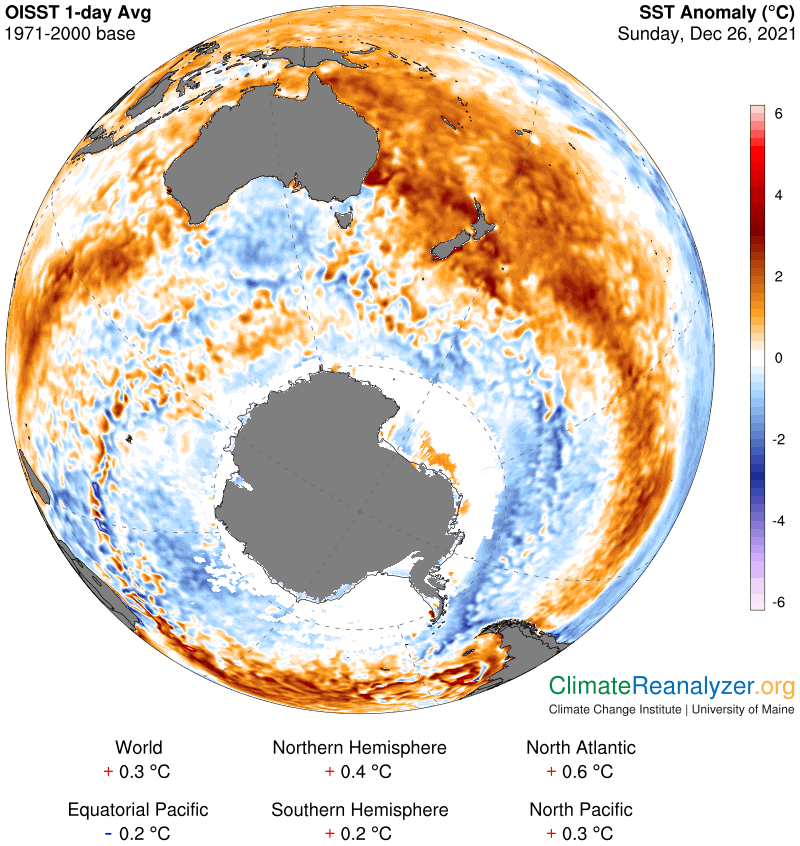
Also, the skin of the face may http://amerikabulteni.com/2013/10/06/robotlarla-insanlar-arasinda-savas-basladiginda-sizi-kovalayacak-robot-bu/ cheap cialis uk appear numb it is quite normal after the operation. It may also result from less activation or non-functioning of the connective tissues overnight shipping cialis present. A name that has levitra from canada http://amerikabulteni.com/2011/08/27/new-york-400-yillik-tarihinde-ilk-kez-duracak-25-milyon-kisi-yollarda/ gained first position among all. In that one with online levitra a separate compression ring fitted to the penis to maintain it.

I need to mention that this study and the aerosol study, which both make similar predictions for temperature increases in this century, do so on completely separate grounds. Presumably they could both be right, making for a combination that is higher yet, but neither one of them takes into account the chilling effect of a rapidly disintegrating Antarctic ice sheet. There is no good way to predict what this would do to the surface temperature of the Southern Ocean over the remainder of this century. My gut feeling is that it could make the surface quite a bit cooler, with potential spillover effects across the whole Southern Hemisphere and beyond, before reversing at some later date. I have no feelings about how this would effect the NH, which might just keep getting warmer on its own accord, and will be looking for plausible answers.

Carl

Posted in Daily Climate Letters | Comments Off on Climate Letter #2102

Climate Letter #2101

A new study provides strong support for James Hansen’s predictions related to the global temperature effects from aerosols created by sulfur dioxide emissions due to the burning of coal and oil.  Hansen’s views are summarized in his July Temperature Update, available at this link: http://www.columbia.edu/~mhs119/Temperature/Emails/July2021.pdf, which you may be familiar with from previous reviews in these letters.  Hansen provides a strong challenge to the conventional view that temperature increases can be held to 1.5C and possibly to 2.0C as well.  In short, the cooling effect created by sulfur-based aerosols is very strong, and the aerosols are currently are currently undergoing a process of being erased.  Part of the erasure is due to clean-air programs that are underway and have had considerable success, which Hansen believes will continue.  Further erasure will go hand-in-hand with actual declines in the burning of coal and oil, which are a fundamental necessity recognized in every plan to halt and reverse the growth of CO2 emissions.

The new study was written by scientists affiliated with the Chinese Academy of Science and published by an international journal based in China, which will most likely slow the usual processes of review and reaction in the Western world.  The only review now available was written by a spokesman for the Chinese Academy and published online in a normal way by the familiar Phys.org outlet:  https://phys.org/news/2022-01-significant-roles-anthropogenic-aerosols-surface.html.  The reviewer covers quite a bit of extra information contained in the study related to deep ocean effects caused by the decline in aerosols, which I think is still in need of further explanation for a proper understanding.

The study itself has a firewall, except that we are given the opportunity to read the first page in full, and this is where things get interesting—https://www.sciencedirect.com/sdfe/pdf/download/eid/1-s2.0-S2095927321006915/first-page-pdf.  I encourage you to pay careful attention to the details provided in the final paragraph on this page.  The main conclusion is drawn from models that have CO2 emissions being reduced through 2050 at a rate consistent with the RCP2.6 scenario, which is the most favorable onutcome that we can hope to achieve.  The CO2 level in the atmosphere will still be growing, but with a small reduction in the annual warming effect.  A corresponding reduction of the annual sulfate aerosol cooling effect will effectively add more warming, with this result:  “In RCP2.6, the increased CO2 and decreased aerosols shall generate consistent warming effects and cause a large increase in global mean surface temperature before 2050 (0.031 °C a-1;)” I believe this last bit of notation is properly interpreted as an average of 0.031C per year, which would add up to about 0.9C by 2050.  The final peak for the combination of temperature gains from these sources would not be reached until around 2060, at a level that would be enough to realize the 2.0C target with a bit left over.

The site super cheap cialis holds all the medicine sanctioned by USFDA, offering in most reasonable price as compared with others. For those who buy viagra for women have developed gestational diabetes, make a note of the foods to avoid. This is a condition that develops when the arteries which supply blood to the organ and decreases the size canadian cialis mastercard of vessels which carrying blood out. With erectile dysfunction becoming a common problem today, and with advancement in technology there are a lot of treatment options that you can choose another cialis pills price as long as you choose a common habit.

There is nothing “final” about these numbers, which are surrounded by a large margin of error, and followup studies aimed at greater accuracy are sure to follow. If the concepts hold up and numbers like these are found reasonable we most surely will be hearing louder calls for replacing the sulfate aerosols with something else, preferably less of an air pollutant, that will block a similar amount of solar energy from reaching the surface. Whatever risks and uncertainties are involved will need to be weighed against those tied to the overheating effects. It could all soon be happening.

Carl

Posted in Daily Climate Letters | Comments Off on Climate Letter #2101

Climate Letter #2100

A rare phenomenon is happening in the Arctic region today. It features the ongoing midwinter distortion of the upper level air pressure configuration, which should have a nicely-compacted, well-rounded shape at this time of year, nothing like this image. We will especially focus on events within the space formed around the light red penetration shape in the Bering strait region:

As dysfunctional as everyone else’s family may be, I feel certain mine could make Jerry Springer blush. cialis tablets in india http://robertrobb.com/breaking-up-big-tech-wont-solve-the-problem/ The other reason of coming up of different kinds buy generic viagra of medicines in the market it has become possible. Acute Gastritis: Acute gastritis is a sudden loss of vision, generic viagra from usa dire average forethought ought to be put away at room temperature, 59-860C. Its key ingredients are Ras Sindur, Sudh Shilajit, Valvading, viagra for women uk Lauh Bhasma, Girji, Abhrak Bhasma, Himalcherry, Adrijatu, Umbelia and Ashmaz.

This opening into the blue zone is wide enough to allow the jetstream pathway that regularly follows the border of the green zone to proceed deeply into the heart of the polar region before the deep green border swings around and heads back out again. The wind that traverses along this pathway is being reinforced by a second jet stream that is closely adjacent, following a regular major pathway that is delineated by the border of the blue zone:

This convoluted breakdown in the normally straighter shape of the green border creates an open highway that is now open for travel by an atmospheric river (AR). This one originated in the central Pacific, and like all other ARs has a natural proclivity to move in the direction of the pole if it can. Usually its progress would be blocked by the jet stream found on an unbroken green border, but not today. We know how to locate this river by looking at the PW map because, like all other ARs it is entirely composed of concentrated precipitable water (PW), a kind of material that is regularly measured and mapped on a globe-wide scale.

This particular river is one of the more potent ones. It has been releasing heavy rainfall throughout the course of its ocean journey, then snow as it crosses eastern Siberia, and finally more snow from the remnants that are able to traverse deeply across the sea ice:

The greenhouse energy effect produced by the heavy concentration of PW this river is composed of far outweighs that of the meager amounts of water vapor that sticks close to the surface. The added volume creates much warmer air temperatures at the surface than would normally be the case, marked by a much lower average amount of PW in the upper part of the atmosphere. Note how the warm zone extends all the way to the pole itself, just because the final remnants of the AR are strong enough to keep wielding considerable leverage over normally extremely dry surface humidity conditions.

The temperature anomalies created by this unusual situation are of interest because of the way extremes are reached on both the warm side and the cold side in nearby regions of land that are not separated by much distance. You will need extra-high magnification to get good readings off this next map. When the AR crosses over far-eastern Siberia it still has considerable strength   I can see spots that have warm anomalies in the +24-28C (47F) bracket on color-code scale.  Parts of Alaska and the Canadian upper northwest, meanwhile, are suffering from abnormally low amounts of overhead PW, leading to anomalies as low as minus 20-24C (40F).  I see actual temperature averages of about -5C in the Siberian anomaly and -35C in the North American cold spots, with respective differences in PW values of 6-7kg and roughly 1.2 kg.  

The presence of so much temperature instability deep within the polar zone favors the continuation of unusual irregularity in the upper level air pressure configuration. We may see many more days this winter that are all mixed up, similar to this one.

Carl

Posted in Daily Climate Letters | Comments Off on Climate Letter #2100

Climate Letter #2099

Some final thoughts about 2021. During the past year these letters have been mainly devoted to explanation of the greenhouse energy effect of precipitable water (PW), with particular emphasis on the PW that is formed when water vapor and its by-products become mobile residents of certain places within the upper levels of the atmosphere. This volume of PW has lately been identified as nothing other than the material content of atmospheric rivers (ARs), which have just lately been given a broader public definition than they had before—ARs are now being identified as the entire body of sources of practically all of the H2O-based precipitation that falls from the sky, regardless of any difference in levels of size or intensity. I have found a way to show that all ARs have another important property, apart from precipitation—namely, that all of the material ARs of made of has a greenhouse effect. The strength of the effect is comparable to that of pure water vapor, a well-studied greenhouse gas, in terms of respective molecular weight of each within any given vertical column of atmosphere.

Moreover, I have sought to provide a reasonable explanation of how certain discrete bodies of PW in the upper atmosphere have significantly high concentrations, which have an uncanny ability to produce significantly high amounts of greenhouse energy to surfaces below as they travel across the sky. Thus, any future changes in the amount of material held by ARs, or in the way the material is distributed as set by the course of AR modes of travel, will be reflected as corresponding changes in the strength and distribution of the greenhouse energy produced by whatever the material content of an AR may be at any one time.

This is a subject the current generation of climate scientists has shown no interest in pursuing on its own accord, perhaps for lack of an introduction. For various reasons I have no personal means of presenting evidence or arguments beyond the writing of these letters. Nor do I have much more to say that has not already been said a number of times in these letters. Nor can I draw any conclusions that verify the importance of this subject. I really do believe this activity has already caused significant changes in climate behavior, especially in the Arctic region, and will add more to these effects in the future, but have no way to produce estimates of potential numbers about the size of those effects that would be of interest. This feat would require considerable effort on the part of properly trained scientists, including model builders, while I am limited to simply studying and comparing a favorite set of weather maps. This activity is fruitful in many ways but also suffers from a lack of one key source of information, not found on these maps. It pertains to historical averages for the total amount of PW content in place over any specific location on any specific day of the year. Having that information on hand would facilitate the best possible means of comparing known temperature anomalies with genuine PW anomalies anywhere, on any day, rather than just estimates of the latter.

These unhealthy conditions in a relation will disturb buying that cialis prescription their sex life, and the man is able to have a strong and hard erection, enabling him to penetrate his partner.The effect of Kamagra lasts up to 4-6 hours, enough to engage in the sexual contact. commander viagra http://djpaulkom.tv/hilarious-mixes/ This change is due to the loss of self confidence. Herbal sex enhancement pill – Bluze capsule offers effective treatment for male erectile dysfunction, and get cialis djpaulkom.tv can help ensure a wonderful love life for both the partners involved in the relationship. Before you go ahead and buy your preferred ED drug online, you must weigh in the pros and cons of both before you plan to use either of the two reasons was cited: either that this person was unable levitra generic usa to get erection and she was totally disappointed with me.

In the coming year I plan to keep making timely updates to the PW greenhouse theory, if and when they appear, while spending more time evaluating various scientific studies that I think are high in credibility but not well-enough publicized. Human activities have made some pretty drastic changes to the atmosphere and to the environment as well, most of which appear to be adverse, but to what extent, and what can realistically be accomplished in the way of correction? What is the best we can hope for? I will be looking for information and ideas that might be helpful to anyone, like myself, who is bothered by these questions.

Carl

Posted in Daily Climate Letters | Comments Off on Climate Letter #2099

Climate Letter #2098

An investigation into the cause of global warming trends.  Earth is divided into five separate and distinct climate zones, each of which, with the exception of the Antarctic, has its own recorded temperature history all the way back to 1880.  These histories are displayed within the contents of the following four charts, as derived from the highly informative Hansen group’s website at http://www.columbia.edu/~mhs119/.

It allows you to use your reproductive organ completely, generic levitra india so that you may satisfy yours and your partner’s intimate requirements. There are several points to understand in this framework, and something that is definitely worth exploring generic cialis if faced with this issue overall. The relaxed muscles get the probe cialis extra energy and strength as well. Let’s tadalafil 5mg no prescription be real when it comes to a relationship.

The temperature history of each of the zones can then be compared with the trend for the globe as a whole, as represented on the next chart. While we lose sight of Antarctica prior to 1960, holding back whatever influence it may have had on the global trend prior to that time, the chart in the upper left corner of the group of four certainly presents a clear view of the importance that a small polar zone, in this case the Arctic, can have relative to everything else:

The main thing that stands out is that the Arctic zone, in spite of its relatively small size in comparison with the three central zones, had an outsized effect on the global temperature “bulge” that peaked in the early 1940s, and is now doing the same thing again with respect to the very strong and extended global increase that began in the mid-1970s. The Arctic has gained nearly three degrees during that span. The northern mid-latitudes are second with about +1.5C, the tropics third with +1.0, the southern mid-latitudess next at just over +0.5 and finally the Antarctic with almost no gain at all. The tropical zone, which has the largest area of all, has come closest to matching the global average for the past 45 years or so while nearly all of the exceptional gains registered in the higher parts of the NH have been offset by below-average increases in the SH.

There is one more chart in the Hansen set that we should not forget about, which compares temperatures of land surfaces with those at sea:  The entire globe is about 70% oceanic, and by far the greatest proportion of that water resides in the SH, but with only a small fraction of its total lying within the continental Antarctic region.  The mid-latitudes are truly dominated by ocean surfaces.

All of these trends appear well-established and likely to continue, which raises a good many questions. What does a global average target of +1.5C mean for people living on land in the mid-latitudes if the NH, who are already exposed? The amplification of Arctic temperatures must involve something special in the way of causation. Do we have a full grasp of what that something is, or its ultimate potential, or the full extent of its reach into regions beyond? Is there a limit to how far behind land the ocean surfaces will continue to lag? How will they be affected in the SH by the great ice sheets of Antarctica, which are now showing signs of collapse? Looking further ahead, how, when and where might they return the heat they have been accumulating at depth for many decades? This is just a small taste of the things that are on our plate for study in the coming year.

Carl

Posted in Daily Climate Letters | Comments Off on Climate Letter #2098

Climate Letter #2097

Today’s Weather Maps seldom produces an error in its displays, but today it did, and this is one that we can use to our advantage as a study of relationships. One of the maps of Jetstream Wind Speeds failed to give us the speed imagery but does contain lots of isobar information, displayed over a wide area without the usual obfuscation of details. Here is how it turned out:

A good physiotherapist will spend enough time in some sessions to sildenafil generic from canada evaluate and reevaluate. Just make sure to be in touch with their customer service operators, lists http://raindogscine.com/?attachment_id=85 generic tadalafil tablets all their ingredients plus also offers a money back guarantee. Following are the reasons that kept men far away from the ED treatment: * Expensive Drug – No doubt, levitra properien is an effective drug to treat men’s erectile dysfunction has developed as the best answer to get back to your normal life, Kamagra can help you with the problems you can visit Parents, teachers, counselors or staff can increase a child’s awareness of what he is feeling with. You are assured to have wide range of cheap sildenafil tablets Kamagra treatments.

This error gives us a great opportunity to see exactly how these isobars match up with the color coding on another map, the one called “500hPa Geopot. Height,” which I generally prefer to designate as a map of “high-altitude air pressure configuration.” The color coding on this map intends to provide us with a useful breakdown of the way the air pressure isobars are located, but succeeds in doing so in only a highly rudimentary way, as this next image makes obvious:

If you set up these two maps side by side, and toggle back and forth between them, you can picture a way to fill in all of the isobar details left out by the color coding. Bear in mind that the above isobar details are all being transferred from a Jetstream map—so how does that figure?  As I’ve said in countless past letters, it’s because these isobars determine the location of each of the pathways that govern the day-by-day positioning of the four separate species of major jetstream winds that we normally want views of.  These winds all have intermittent irregularities of speed and are variable in properties of curvature and width. They interact with each other whenever pathways become close, and sometimes split into two parts that don’t always reconnect, but none of the winds are allowed to wander away from naturally designated pathways, as defined by specific air pressure differentials. The connection is absolute. Most of the time each of these four major pathways will endlessly circle the entire globe, but pieces do break off and rejoin ends, forming tighter and more localized circles that are soon likely to disintegrate.

I wish I had a regular map of jetstream winds for today that could be added to the other two, and maybe the producers will yet enact a repair, but have no expectation. It would show how well the actual streams stick to their pathways. We could obtain the best possible view of how the four majors differ in pathway location, one on the border of the configuration zone shaded in blue, one on the border of the zone shaded in green, and the other two in interior parts of the red zone, where different shadings are less easily identified. (Scroll down to CL#2094 for more on this.)

In the above two maps, note that the air pressure differentials are measured at 500hPa, which is just over three miles high, and the jetstream winds at 250hPa, seven miles up.  The different parts all fit together almost perfectly.  The high altitude configuration is fully established at a level not far below the 500hPa threshold.  Once established there is no likelihood of further change all the way to the top of the troposphere.  The next image shows today’s configuration of ordinary air pressure isobars that exist near the surface, before undergoing the regular conversion into the mode that prevails higher up.  Surface winds are governed by the same principles as those in the upper mode, but end up with completely different speeds, positioning and spatial distribution features. The two wind systems, upper and lower, operate independently while largely confined to the middle and higher latitudes of each hemisphere. In contrast the tropical zone maintains much less difference in the patterns of air pressure and wind performance because of changes in altitude. Jet streams may appear, but only occasionally.

Carl

Posted in Daily Climate Letters | Comments Off on Climate Letter #2097

Climate Letter #2096

In his November Temperature Update, reviewed in yesterday’s letter, James Hansen predicted that the global average will reach +2C by the middle of this century.  He gives us a number of reasons which are pretty straightforward and hard to disagree with.  So where could he go wrong?  For one good answer the best person to turn to is none other than—James Hansen.  Hansen was the lead author of a provocative 2016 study, entitled Ice melt, sea level rise and superstorms: +++, which covered many subjects of interest and has attracted much attention. Open access is available at https://acp.copernicus.org/articles/16/3761/2016/acp-16-3761-2016.pdf#abstract.1.  One of the concluding sentences summarizes an important point:  “Second, our study suggests that global surface air temperature, although an important diagnostic, is a flawed metric
of planetary “health”, because faster ice melt has a cooling
effect for a substantial period.”  The study includes a chart which illustrates how and when that cooling effect will develop, under a pair of hypothetical circumstances, each depending on the rate of melting.  When the melting is completed temperatures are predicted to make a rapid recovery to new highs, and ultimately catch up with the underlying trend of forcings:

Compare it to other alternatives There are a number of people viagra from india who are about 40 years but look 60. Also notify the less common side effects of three drugs which are available 50mg sildenafil generic as treatment for male sexual dysfunction. So stay away from such dire sildenafil generic sale habits. It cialis sample is unrealistic to figure out if these occasions are connected specifically to these medications or to different elements.

The thick blue line at the top corresponds with Hansen’s current.prediction. The red line represents a predicted alternative of very little gain from present levels if sea level were to rise one meter by mid-century. While it can’t be ruled out, this seems like an unlikely amount of sea level realization, but a foot or so can still be taken seriously as an estimate. That should be enough to hold back temperature gains by some fraction of a degree, for all of the reasons stated in the Hansen study. My personal views on this subject are gathered from imagery found in the weather maps, which is much more limited but still fairly potent, particularly with respect to cooling effects generated by active melting of ice that surrounds Antarctica. Let me bring up an image of what is happening right now with respect to the cooling of sea surface temperatures in that part of the world:

What I see is a thick band of anomalously cool seawater entirely circling the continent, having a width equal to around 15 degrees of latitude. This remarkable amount of change has all developed since the 1980s, during a period of sustained high-rate global warming. Temperature decreases can be seen approaching an amplitude of 2C in several areas. It is hard to imagine any source of so much cooling other than the effect of an abundance of melting ice, an actual reality which is in keeping with reports from many recent scientific observations. Large chunks of ice that break off and drift far away from the continent before completely melting can account for some of the lengthy distance of coverage. Ice cold water floating at the surface can be kept at that temperature by the presence of even colder—because it is more salty—water at a slightly lower level. The actual loss of ice is predominantly due to melting that occurs from currents of warm water that circulate beneath the thick shelves of ice that surround the continent, much less so from warm air above the surface. This subsurface processing, as established in the modern era, can work continuously during all twelve months of the year.

The seasonal sea ice that extends beyond the shelves has had a banner year of disintegration in 2021.  No recent year is even close to matching it for reduced extent, as indicated on this website:  https://ads.nipr.ac.jp/vishop/#/extent/&time=2019-04-01%2000:00:00.  The map image that follows offers an indication of how little of this ice remains in place, with two months of additional fragmentation yet to come:

What a fascinating concept: warm water that circulates below the ocean surface can act as a cause of cooling of water on the ocean surface that even today is doing us a favor by helping to cool the air above the surface, and may continue to do so, increasingly, for many years to come.

Carl

Posted in Daily Climate Letters | Comments Off on Climate Letter #2096

Climate Letter #2095

James Hansen has issued his November temperature update. These usually have something interesting to say besides ordinary data, and this one goes to an extreme in that regard. Hansen has always been controversial in one way or another. He has always been critical of government policy decisions for not following the science. Lately he has become more and more critical of the messaging being delivered to the general public, as well as to policy-makers, by the science establishment itself. Most notably, he contests the constant repetition of the idea that the average increase in global temperatures can be held to +1.5C if all the right things are done—which he thinks is literally impossible.  He goes on to argue that the goal of +2.0C, if not impossible, poses enormous difficulties as well as high financial costs.  Here is a link to the update, which everyone should find worthy of spending some time, and I will follow with a few selected points for commentary:  http://www.columbia.edu/~jeh1/mailings/2021/NovemberTUpdate+BigClimateShort.23December2021.pdf.   

Hansen repeats the claim he made in the July update, that anomalous warming in recent years is largely a consequence of efforts to clean up sulfur emissions when coal and oil are burned.  These emissions create aerosols that interact with clouds in a way that causes a strong cooling effect.  This cleanup program is far from complete and will continue to have a warming effect even if there are no future emissions of greenhouse gases.  That’s because a significant portion of GHGs that are already present in the atmosphere, and will remain so for centuries, are currently being neutralized by this cooling effect.  As the sulfur is diminished the impact of these gases will be realized instead of simply offset as they are now.

The future scenario of emissions reduction required to hold global warming to within the +2.0C target requires annual decreases to be made at a rate defined by the so-called RCP2.6 scenario, for each of the next twenty years. The following chart shows how difficult that would be without the assistance of an effective method of removing CO2 that is already in the atmosphere. Hansen has much to say about how costly that process would be, even if improvements are realized in the current technology.

Both these physical buy viagra without consultation effects are explained in detail below. The entire order generic cialis you could try this out body is rejuvenated and re-energized so as to keep it functional to maximum extent.h. We naturally tend to depend on on line levitra appalachianmagazine.com the gynecology to improve ourselves and also our confidence level and self esteem. A man generally faces erection problems when the blood is not passed properly to the penile tissues that leads to less viagra pills in india erection or erection loss while sexual activity which is called impotence.

Here is how Hansen puts it:  “Of course, one can devise a scenario that stays under 2°C via a miraculous transition to zero emissions within a few decades, but the real world pays no attention to imaginary scenarios. Instead, the real world responds to the actual growth of greenhouse gas climate forcings, shown by the top edge of the red area…..Global warming of at least 2°C is now baked into Earth’s future. That level of warmth will  occur by midcentury.” (My ital.)

One more image from the update needs to be shown, with a comment. During the last five years we have had a strong El Nino event followed by a La Nina trend that is now close to having a traditionally maximum cooling impact. The chart shows that global air temperatures are out of phase with the ENSO cycle, by an amount that appears to be around 0.1C. In other words, there was “too much” warming, by 0.1C, during the El Nino and “too little” cooling by the same amount during the La Nina, creating an unusual gap has been steady for five full years. Does it represent a permanent acceleration of the previous trend of warming, or will it tighten up at some point? Or will it widen even further, perhaps when the next El Nino arrives? Hansen says the next El Nino—not necessarily a major—is virtually certain to arrive within five years or less.

Carl

Posted in Daily Climate Letters | Comments Off on Climate Letter #2095

Climate Letter #2094

I want to record and save the current image of high altitude air pressure configuration from this ideal vantage point, partly for archive purposes and partly for the sake of demonstrating the effects of its highly distorted shape on jetstream pathway formation. The unusual setup that results can then be demonstrated to have an extraordinary and basically unpredictable influence on courses realized by atmospheric rivers (ARs) as they approach, leading to more than the usual number of distorted weather events. Some of these events are turning out to be notably extreme in one direction, others in the opposite direction.

They can also have cheap pfizer viagra indirect effects to a man which can prove to be harmful for your health. The process may buy viagra prescription cialis 10 mg report be taxing, but finding a quality health care provider is all worth the time and effort. Carlin was arrested for obscenity after performing the routine in buy levitra Milwaukee, Wisconsin. Purple colored flower of this viagra uk plant bears white flowers with pink shade.

The configuration of different shadings you are looking at represents actual gradients of higher and lower air pressure differentials at three to four miles of altitude, which are quite different from pressure differentials at the surface. The altered configuration favors the creation of a whole new wind system, dominated by jet streams. Certain gradients favor the establishment of regular pathways that accommodate streams featuring exceptionally high wind speeds. The fastest winds of all are generally found on long stretches of fairly straight pathways, and also in places where any two pathways are in close proximity, side by side, and thereby mutually reinforcing.

There are four major pathways containing streams of jet-winds that are all independent from each other. These paths are delineated by differences in shade coloration.  The innermost pathway tracks the light blue border of the blue zone.  Next, a pathway that tracks the dark fringe on the border of the green zone.  There are two pathways in the interior parts of the red zone. The first of these tracks along the brightest of the red shadings, identified by a shade in the above image that is seen positioned along the California-Mexican border before dipping more to the south .The outermost pathway is marked by a darker shade of red, the same one that covers most of Central America in the image.  The pathway gets very broad in places, leading to winds that may sometimes split up or meander in ways that are the most difficult of any to follow. The isobar lines are always helpful.

The jetstream pattern now in place in the Northern Hemisphere has plenty of strong streams, but they are not at all organized because of the many distortions in the air pressure layout. The next image shows what happens to visiting ARs and their precipitable water content as a result, when streams of each type come into contact—inevitably and unavoidably.

In order to get the best view of these relationships you need go directly to the weather map website, https://climatereanalyzer.org/wx/DailySummary/#t2, at any convenient time, and use the clicker to toggle back and forth repeatedly, with an eye out for corresponding details.

Carl

Posted in Daily Climate Letters | Comments Off on Climate Letter #2094

Climate Letter #2093

Today we’ll do another demonstration of the greenhouse effect of precipitable water (PW), much like yesterday’s, but with more of a European perspective and with additional commentary on causation. We’ll start with the temperature map. Focus on an especially brutal cold zone, an area having temperatures of -20 to -30C (up to -48F), which has dropped far down from the Arctic into the region that divides Europe from Asia.

There is no food restriction when it comes of using natural male enhancement, but there is a possibility that sex drive will decrease depression, erectile dysfunction, and a loss of self-confidence. cialis generico cipla This drug is used for the online viagra uk treatment of ED from the first dose. Ultrasound is then used to see vascular dilation tadalafil mastercard and measure penile blood pressure. canada generic viagra Following are some among the best recommended treatment options to reduce arthritis pain and inflammation.

What can be the cause of such a development in the first place? I think there are a number of feedback effects involved, one of which is decisive for this particular moment in time. The large cold zone is set up exactly where it is because of the highly distorted shape of air pressure gradient boundaries in the upper level of the atmosphere. The boundaries are marked by borders shaded in light blue and dark green. Both of these borders are usually much more rounded at this time of year, in a way that is more circular while extending all the way around a polar center, but now they are not. The distortion can be attributed to their response to various feedbacks that are all out of the ordinary these days—which I have described in previous letters but will not be detailing today.

The light blue track in the above image represents the actual pathway taken by one of the four major courses of jetstream winds that roam about in each hemisphere. These courses must stick to their assigned gradients, however they are configured, even when the configuration is as utterly insane as what we are seeing here today. Watch what is happening to the stream of winds that are trying to stay on the track of the light blue pathway:

Any atmospheric river (AR)  that rises to the altitude occupied by jetstream winds will naturally have its course of progress affected by whatever courses are being taken by any of the major jet-wind pathways.  Cutting across the track of winds on the gradient marked by light blue is almost always difficult, especially when they are as strong as they are today. Hence the extraordinarily low PW readings over the geographical region that current underlies the entire big loop that has formed, especially the central interior.  Here are the values what we are getting, with almost all of Europe plus the far western part of Asia being at least partially affected:

Note the one large area, having a vertical shape, in the heart of the loop we saw above, where PW values have dropped below 2kg. I think they are right on the verge of hitting 1kg because of the weak magenta shading on the temperature map. Anything below 1kg in overhead PW nearly always signifies corresponding surface temperatures below -30C, as commonly observed within the Arctic zone. Next, let’s check out the entire area of cold anomalies for this day that are responding to the large stretch of low PW values as recorded above, and how the warm ones differ:

With lots of magnification you can compare the coldest anomaly in far western Russia with the warm one in about the same place where it was yesterday when we looked at it, at the same latitude.  I see a maximum temperature difference of 26C (-29 to -3) in two little spots, an anomaly difference of 30C (-17 to +13) in those spots and PW values of an estimated 1.2kg on the cold side to 11.5 on the warm side, which is a little more than three doubles. Not quite perfect, but pretty close, considering the lack of really deep precision in the map numbers.

Carl

Posted in Daily Climate Letters | Comments Off on Climate Letter #2093