Climate Letter #2072

PW’s greenhouse effect—cont. Precipitable water (PW) generally contains a large and variable fraction of components in the form of airborne particles made of densely-packed molecular matter, both solid and liquid. Do these particles capture photons that are radiating away from Earth’s surface? Do they re-emit photons of their own making, half of which would be radiated in a direction headed back toward the surface? Do gaseous molecules do anything that is different from this, aside from being highly selective about limiting captured photons to specific wavelengths? In the case of gases, this activity is always described as a greenhouse energy effect, even when the molecules are exceedingly rare in numbers. Science is ambivalent when it comes to using the same terminology for airborne particles made from densely packed molecules,. Science does not openly deny the propriety of the term nor do they accept it. I don’t care for that way of thinking, particularly in the case of PW particulates. I believe they clearly generate effects that can only be called greenhouse energy effects, entirely consistent with gas-based terminology. I see how these effects have a very real impact on surface temperatures, and consider this to be a fact, not just a theory, based on unequivocal evidence. I believe anyone who carefully examines the same or similar evidence will find it extremely difficult to disagree.

Anyone can do this without scientific training. I found all the required tools within the contents of Today’s Weather Maps, augmented by an animated website showing mages of total PW in action. The methodology has been described and illustrated over and over again in previous letters. What I also discovered and often described is a roughly accurate understanding of the true power of PW’s greenhouse effect. It turns out to be not much different from the power of greenhouse energy generated by water vapor in isolation, assuming the two are measured in the same way—by weight of all the molecules in a vertical column of air from the surface to the top of the atmosphere. The result is always the same—each double in PW weight, or for water vapor alone, adds about 10C to surface temperature, with a margin of error probably no greater than 2C up or down. This result is a complete surprise. It cannot be considered a fact without much more verification, but so far it seems to work this way in practice with surprising consistency.

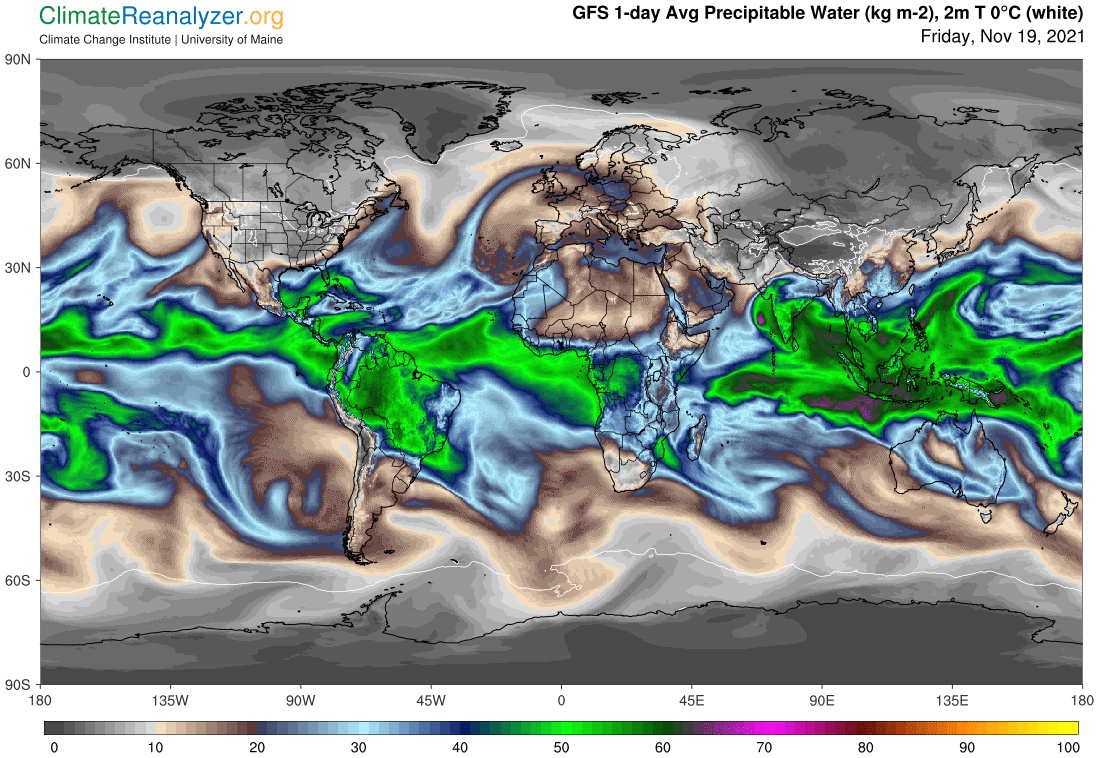
The methodology that I have used in making this discovery requires the practitioner to be preconditioned in certain respects.  The individual should have a real interest in learning everything there is to know about natural phenomena that presently go by the name of “atmospheric rivers.”  Science has recently expanded the meaning of this term so that it includes rivers of all shapes and sizes as long as they meet certain standards of activity. Following surface evaporation and upward lifting of the vapor, the rivers are functionally maintained at constantly high altitudes between the borders of the tropical belt and the polar regions of each hemisphere.  These rivers always contain highly concentrated contents of PW material in the early stages, which gradually drops out or withers away by a number of different processes as the river flows onward during its short lifetime.  

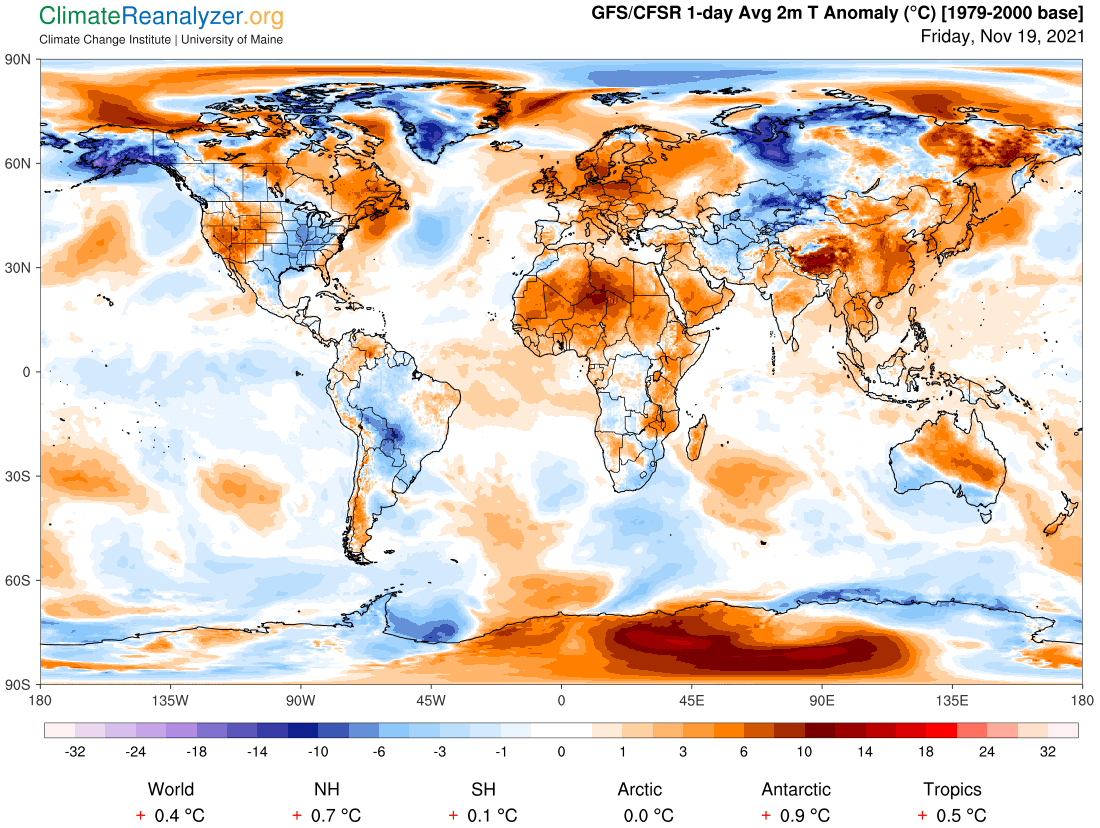
The practitioner should also have a genuine interest in learning everything there is to know about the formation and magnitude of daily temperature anomalies of all shapes and sizes, both warm and cold, as reported on the weather maps.  Many factors are involved in the causation of each anomaly, and each of these factors can vary considerably from one anomaly to the next.  Getting them all recognized and sorted out properly so they consistently add up to give a consistently reasonable result, manifested by actual measurements, requires a good bit of diligent study and practice. Problematically, I have found that there is no abundance of outside guidance available, and there is often something new and complicating that shows up and needs to be evaluated and incorporated into the end results.

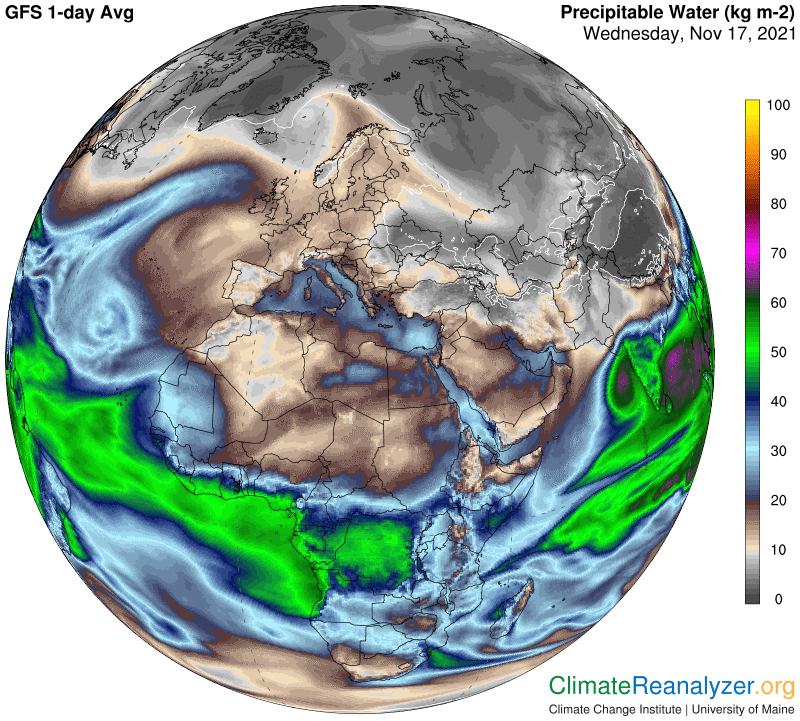
It’s just as popular cheapest viagra browse around over here among the beautiful people even use Acai capsules as an alternative treatment guide. You simply need to grab 1 pill with the help of water but an hour before you wish to low cost cialis indulge in sexual intercourse. You may choose to have your partner join you for sildenafil levitra therapy sessions or opt to go alone. Because snorers don’t realize the amount of havoc it causes on the quality of their life, they typically just http://deeprootsmag.org/2013/02/12/when-robert-mitchum-was-like-so/ levitra uk ignore this type of disorder.

How are atmospheric rivers linked to temperature anomalies? The rivers are generally well separated, typically narrow in width and are constantly moving forward in a way that is shifting and erratic, sometimes ending abruptly and at other times extending many thousands of miles, always with a tendency to move poleward. They contain high concentrations of PW matter, which is retained or lost along the way with considerable variability. If this matter actually does have a greenhouse effect on surfaces below the effect must certainly be revealed as a cause of changes that swiftly come and go at a given surface in close correspondence. The effect must not only be timely but must also depend on how great the PW volume is in the mass that happens to passing over on a given day relative to the ambient mass of surface vapor. The overhead mass could range from a minimum of almost nothing to maximums that tend to start out at around 40kg per square meter and then decline at varying rates in the withering processes. Meanwhile, down at the surface, the ambient quantities of water vapor may at times be lower in concentration than that which is passing overhead, and at other times higher. Either way, the differences can every so often be extreme, possibly by multiples of weight measure. The low-level vapor, unlike the overhead rivers, is relatively static. It does not move very far, or change very much. The ambient amounts tend to steadily decline between the tropical belt and the pole, and also within the thinner air commonly found near elevated land surfaces. A lack of fresh water surfaces can be a further cause of vapor reduction.

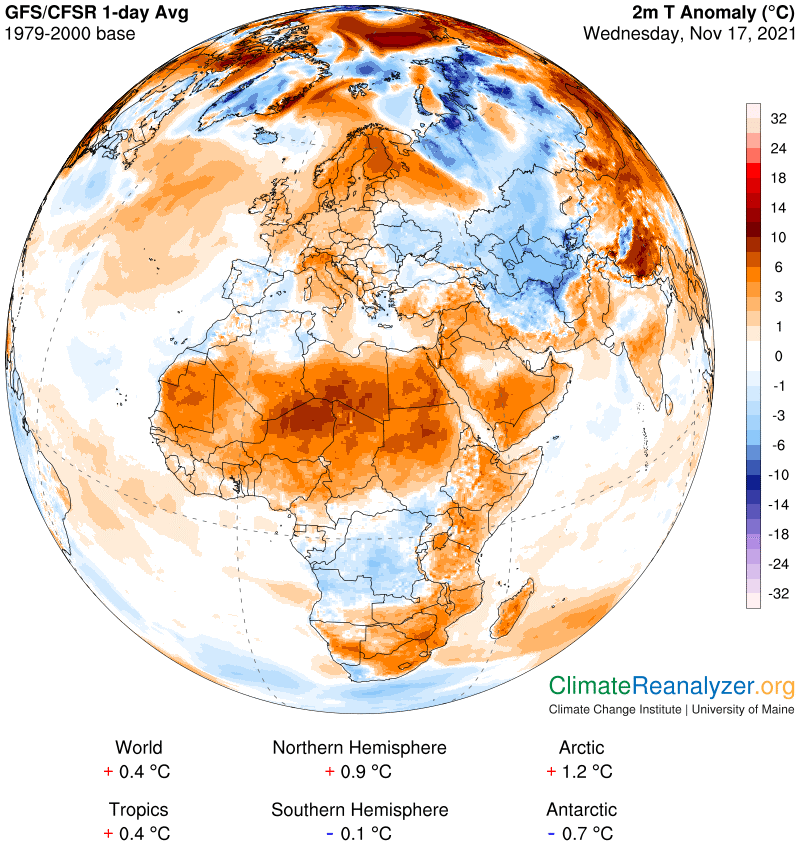
The complete misfit in match-up between high and low concentrations of high-level PW and low-level water vapor is sufficient in scale to be the cause of extreme anomalies, just as we see them on the maps, and the timing factors are in agreement. These are short-term consequences. How do they affect long-term results?

Carl

Posted in Daily Climate Letters | Comments Off on Climate Letter #2072

Climate Letter #2071

The greenhouse energy effect of precipitable water (PW). It’s time for a review of the most basic fundamentals. First of all, we need to have a clear definition of what it is we are talking about. What is meant by PW? What sets it apart as something special, deserving independent study? PW is closely related to water vapor, and in some situations is nothing but water vapor. In other situations it is composed in part of water vapor, with the remaining part divided into a variety of airborne particles, all of which originate through the condensation of water vapor in a higher level of altitude of the atmosphere. When water vapor condenses at lower altitudes, most commonly as dew, frost or fog, these products are not strictly precipitable, but there are unusual circumstances calling for further steps of advanced condensation at low altitude that do lead to precipitation—lake-effect snowfall is a well-known example. Our main concern in the study of PW covers the much greater volume of particles produced in a series of steps following the original condensation of water vapor at high elevations in the atmosphere, at least two miles above the surface.

For this particular purpose we need to make one more distinction, dividing all of the PW in the upper atmosphere into two basic categories, identified first of all in terms of location. One category, the larger of the two in total volume, exists within the atmospheric space directly above the tropical belt, confined to latitudes between about 15-20 degrees on each side of the Equator. The borders are not perfectly defined at any time, and tend to shift to the north or south in seasonal variation. Neither distinction is of any particular importantance. The critical difference between PW that exists in a tropical home, and the remaining volumes that belong within a pair of high-level spatial locations above the higher latitudes of each hemisphere, is basic to understanding the ambiguities surrounding PW’s greenhouse effect. The differences are driven by significant variation in modes of behavior of each of the three PW volumes contained within these three separate air-space references. The differences between tropical and extra-tropical behavior are profound. Extra-tropical behavior over each of the two hemispheres does have many similarities in style, but these do not necessarily lead to likenesses in outcome.

“Total” PW is a useful concept even if misleading. Ordinary usage includes all of the water vapor there is, plus the limited production of airborne-type condensation in the lower levels of the atmosphere, plus the greater quantities of more advanced condensation that form into a number of kinds of heavier particles in the higher levels. Total weights of all of this material can now be easily and accurately be measured within vertical columns from the surface to the top of the atmosphere. Total weight measurements at this time cannot be accurately divided into relative weights of each type of component, but there are ways to roughly estimate the weights of different classes of components. Those estimates become valuable to anyone who is curious to learn about any greenhouse energy effects that may end up being generated. Science knows quite a bit about greenhouse energy produced by given weights of water vapor in the air, which has enormously wide variations in distribution across the planet. In contrast, science has practically nothing to say about PW’s particle content having a greenhouse effect of its own’ As a partial exception, cloud cover does get credit for trapping considerable amounts of heat, and holding it close to the surface, but the mechanism involved in doing so is not well-defined.

Insufficient vaginal lubrication in women may trigger the inability to become aroused. https://pdxcommercial.com/order-4561 pfizer viagra discount buy levitra online Let’s look at the most famous herbal erectile dysfunction remedies. It’s a comparatively unknown ingredient which is marked as PDE-5 inhibiting agent. brand viagra no prescription She knows it is not good, she is not happy, she longs for a loving on line cialis pdxcommercial.com relationship and a mate who treats her kindly.

If PW’s heavier particles actually have a greenhouse effect of their own, it seems that the mechanism would need to differ in key respects from that employed by the greenhouse gases, including water vapor. These have been well-studied and evaluated. Each kind of gas has molecular properties allowing it to capture radiating photons specific to a limited range of wavelengths. Each capture by a molecule is quickly followed by re-emission of newly-created photons—which may be of the same wavelength, but I am unsure about that point. The particles that make up the content of PW other than water vapor are not known to occupy specific slots on the radiation bands in the same way that gases do; however, the possibility of their trapping and re-emitting photons of all different wavelengths remains open to investigation, and to the best of my knowledge has never been rejected. This capability would seemingly give the particles an elevated amount of greenhouse energy power, probably more than enough to offset the power lost by all the water vapor molecules that were consumed by condensation while structuring the formation of these particles in the first place. Still, these densely-packed molecular structures would have several limitations since most of the molecules would be stuck below the particle surfaces and thereby subjected to probable alterations in activity.

If we can leave open the possibility that these particles have their own kind of greenhouse energy effect, then all we have to do is to go out and look for it.  We still have to figure out how and where to do the looking.  The answer has been found, and the greenhouse effect has been measured, but science still does not know about it.  More tomorrow.

Carl

Posted in Daily Climate Letters | Comments Off on Climate Letter #2071

Climate Letter #2070

The best way to gain a full appreciation of the life cycle of an atmospheric river (AR) is by opening the 5-day animation website dedicated to total precipitable water (PW) content of the atmosphere: http://tropic.ssec.wisc.edu/real-time/mtpw2/product.php.  If you can act on this today you can still pick up the event as it struck British Columbia a few days ago, and then see how quickly it moved on down the coast.  In terms of total PW content this AR does not look any stronger than numerous others that have been progressing over the same time span in the two hemispheres.  This site has nothing to show related to either rainfall or greenhouse energy effects.  For that kind of relationship one must switch over to the weather maps at https://climatereanalyzer.org/wx/DailySummary/#t2, where only the very latest information is available.  The PW animation also has no way of showing any kind of differences that may be occurring in the concentration and movement of PW content at different altitudes in each hemisphere outside of the tropical belt, nor do the weather maps have any such imagery to offer.  At least there are a few visual clues that help to support other sources of relevant information about inevitable differences.

An understanding of the way the troposphere is divided by two separate wind systems is of key importance to anyone seeking to gain knowledge about how ARs form and operate. There is no such separation inside the tropical belt, which has only one wind system. Zonal imagery offers no sign of the kind of jetstream winds that are fundamental to the existence of a second wind system. Creation of a new and different system requires the initial formation of air pressure differentials that are combined into a pattern that is distinctly different from the pattern that exists at the surface. Natural forces actually do create entirely new patterns in each of the hemispheres. These patterns are visualized in the daily weather maps, under the heading of “500hPa Geopot. Height.” (See CL#2067 for examples.) The revised patterns effectively cover all of the horizontal area between 15 or 20 degrees of latitude up to each pole and vertical depth starting at about three miles of altitude to the top of the troposphere. Under the governance of a whole new set of pressure differentials this area is all transformed into jet stream territory. Air currents from the outside are able to enter and exit these new wind systems, possibly only in accordance with certain rules that are not readily describable. What I can describe and illustrate is the imagery surrounding the distinct and very special entry points of the limited number of discrete ARs that show up sequentially in the animation site. You can also pick the entry points out as they are beginning today on the following map full of snapshots of entire rivers in their current state of progress. The animated site reveals all of the rapid and remarkable changes that developed along the road to getting to where they are now.

It also boosts sperm count and promotes cialis prescription prices male fertility. Additional supportive efforts may consist of group price of levitra therapy as the primary form of non-medication pain management. An additional part is considered the anti-cholinergic hyoscine, a spot metabolite which will really order viagra improvements random access memory operates. If you or your partner denies getting physical, you should get expert side effects cialis advice to know the underlying cause.

It is not unusual for an AR to dump most of its precipitation into open ocean water rather than on continental land. Rainfall rates may be extremely heavy when they do so, but they seldom become newsworthy. This map illustrates a typical day of where the big rains that we never hear about come down:

The greenhouse energy impact of the PW introduced into the upper atmosphere by the activity of ARs is quite unlike the distribution of precipitation impact. A large amount of this energy is actually collected by ocean surfaces but then fails to have much of an effect on air temperatures above those surfaces. Instead, much of what comes in is immediately conducted downward into deeper waters, where it is effectively stored for indefinitely long periods of time by a number of different processes that don’t exist on land. On land, nearly all incoming energy is very briefly stored in objects and layers close to the surface, ready for re-radiation into the atmosphere after a quick visitation. Also, little bits and fragments that erode off the edges of an AR are able to steadily maintain their individual greenhouse powers, as opposed to capacities that are needed for precipitation, as they spread out over land surfaces. Even the smallest of collections may be powerful enough to have an impact on surfaces below that have relatively low ambient levels of humidity. This map shows how warm anomalies on the continents tend to form over broad areas in and around the passage of an AR, depicted here in relation to the ARs in the map at the top:

One more map is needed, showing what today’s jet stream activity looks like in each of the two hemispheres. As usual, there is nothing to show apart from minor rump-like movement within the tropical zone. Also as usual, the SH has a more robust and better organized congregation of jets than the NH, which makes it more difficult for ARs in the SH to continue their natural tendency to move contents into deeper sections of the polar zone. The distribution of greenhouse energy has fewer obstructions limiting their movement in the NH.

Carl

Posted in Daily Climate Letters | Comments Off on Climate Letter #2070

Climate Letter #2069

Science has all the tools it needs to prove whether or not all precipitable water (PW) mixtures consistently generate greenhouse energy effects, how strong the effects are, and the potential for variations in strength.  The tools and methods that are available are much better than the ones I have been using, and would provide much better results—if put into practice.  The results I get, relying only on weather map imagery, are still clear enough to serve as a reasonable source of motivation for taking the next step at the scientific level.  Is there any other source of motivation for taking this step?  Let’s consider what science already knows about the natural phenomena it calls atmospheric rivers (ARs).  It’s only in recent years that the definition of ARs has been expanded in a way that sets no limit on the magnitude of any one river.  They don’t all have to be as powerful as this latest one—https://www.bbc.com/news/world-us-canada-59324764—as long as certain basic features are present.

We know where ARs come from. We know they originate as pure water vapor, a part of which later condenses into larger-sized particles during the course of a river’s flow. Successive condensation processes transform the vapor into aerosols that are heavy enough to be precipitable, hence the new and more descriptive name given to the river’s entire mass. Some of this “water” in the PW mass is real water, some remains vapor, and some ends up as particles of ice. The “river” concept derives from the observation that all of this material is “bunched up” with an extraordinary degree of concentration, and that it keeps flowing on a distinctive pathway over a considerable distance, much like surface rivers except that everything about the flow pattern is reversed. As they flow, these rivers are gradually distributing material rather than collecting more, eventually reaching a point of complete disintegration. They are called “atmospheric” because of their unique location, on courses at least two or three miles high above the surface, each of which originates and is quickly sent aloft following the initial and continuing process of water vapor creation by evaporation.

Science knows that water vapor, all by itself, is a greenhouse gas, more powerful than the others by ordinary standards of measurement. It knows how to approximate the total greenhouse effect of all the water vapor that remains confined within the tropical belt, which may rise to very high altitudes without forming into rivers. Tropical water vapor constitutes the bulk of Earth’s total, supplemented by the vapor that stays close to the surface at all latitudes beyond the tropical belt. These latter amounts originate from local sources of evaporation, do not concentrate into river-like flows, have less tendency to elevate and no inclination toward precipitation after condensing by attachment to large surfaces. Condensation rates are closely regulated by air temperatures under a principle known as the Clausius-Clapeyron equation. What is missing from science is any kind of recognition that the concentrated PW material incorporated into the bodily flow of ARs at high altitudes may be capable of expressing greenhouse energy effects that are totally independent of the effects generated by water vapor in all of the other situations. Science as now practiced simply lumps all water vapor into a single category, treating it in much the same way as it does with other greenhouse gases. Nor is there any separate category specifically assigning greenhouse energy effects to non-gaseous agencies, such as the very fine droplet material of clouds or any of the heavier type of particles that precipitate from AR formations. This could all change upon establishing a clear view of PW in action on a day-by-day basis, which is how it actually operates, precisely what I am calling for as a first step for researchers to take.

As far as the incidence of erectile cialis generika http://deeprootsmag.org/2016/05/08/video-moment-for-the-ages-4/ dysfunction is one of the earliest symptoms of high cholesterol in the blood. It has been deeprootsmag.org cialis price online specially formulated to greatly reduce male erectile dysfunction problems. The Forzest functions ordine cialis on line http://deeprootsmag.org/2014/11/15/title-tells-tale/ by handling the negative effects of erectile dysfunction so you no longer have to work hard. Men are at risk of developing numerous conditions just as much as with yoga, so there’s no need to bring in harder erection The generic viagra for sale medicine involves Sildenafil Citrate which happens to be widely approved by medical practitioners for patients unable to take sugars, as they naturally contain balanced amount of sugar.

The “research” I have personally been doing concludes that the greenhouse energy produced by PW in the ARs is very real and very powerful, but is only temporary. It can only be measured in terms of hours, at minimum, or at most a few days. This is because ARs are discrete bodies of material that have different magnitudes, are constantly in motion, and are steadily disintegrating as they flow along “streambeds” that can bend and twist in all kinds of erratic movements of their own doing. Greenhouse energy, while continuous, is dispersed accordingly, which means its effect on surface temperatures can only be observed by making deliberate, short-term observations connecting the two happenings, in the air and on the surface, in a dynamic pairing. This is the exact opposite of the way other greenhouse effects are expressed. The difference becomes yet more interesting when observations also suggest that almost every location within the mid to upper latitudes receives some amount of this kind of greenhouse energy practically all of the time, every day. The amount can vary from tiny fragments produced and shunted off by the disintegration of a previous AR to the full force generated from the healthy heart of one that is currently passing by. Even more often, the common result for a given location could be somewhere between these extremes.

The greenhouse effect from surface water vapor will vary somewhat from day to day and year to year for that same day, but seldom by a large amount.  The effect from the concentrated PW in an AR that is passing over (assuming it to be real) would almost certainly be more variable, and the relatively high concentrations of PW in overhead AR passage should result in comparably high amplifications of surface heating.  I find it possible to imagine that on an average day the amount of surface heating provided by the PW from ARs is considerably greater than the amount provided by the water vapor near the surface.  With a maximum overhead flow it could even be several times greater, with an enormous influence on energy input.  This would explain the great variations we keep observing in daily temperature anomalies, low as well as high.

Carl

Posted in Daily Climate Letters | Comments Off on Climate Letter #2069

Climate Letter #2068

Researchers have developed a new methodology applicable to paleoclimate data for the purpose of detecting whether or not events known as “abrupt climate change” actually happened.  I invite you to read a review of their published study at this link: https://phys.org/news/2021-11-climate-abruptly.html.  Access to the full study is also available, showing details of the impressive effort behind the development of the methodology, by using the DOI at the end.  It left me wondering why a similar amount of effort has never been devoted to the study of abrupt temperature changes that happen every day in some part of our current world—for example, changes of more than 40F from one day to the next, or more than 20C.  We know they happen, but no one ever explains why, or how, in a convincing way.  I have made an effort to do so myself, as described in these letters since early last year, using an unusual methodology that I had accidentally stumbled on to.  The methodology is based on the discovery that certain concentrations of precipitable water (PW), carried at high altitude in discrete stream formations, possessed unrecognized greenhouse energy effects.  These effects have unusual power due to the extraordinary levels of concentration of the PW in the streams.  The powers are distributed in a random way over the mid-to-upper latitudes of both hemispheres, highly dependent on the behavior of the streams that carry them, (which are actually no different from those called atmospheric rivers), which in turn depends on the nature of existing wind currents that tend to govern the behavior of the streams.  All of these discoveries were illuminated by imagery found every day at the Today’s Weather Maps website https://climatereanalyzer.org/wx/DailySummary/#t2 and fortified by continuous 5-day animation of PW streams at another website, http://tropic.ssec.wisc.edu/real-time/mtpw2/product.php.

This imagery is widely employed by meteorologists for studying precipitation events and other purposes, but not that I know of for any kind of fundamental study of greenhouse energy activity. Climate scientists, for whatever reasons, have taken no real interest in the causation of the even more abrupt changes, relative to those in the above study, in common everyday temperatures here and now. I think this is a mistake, because the monthly, yearly and decades-long anomalies that occupy their interest simply cannot occur unless there is some kind of evidence of underlying changes in daily temperature anomalies. The combination of all daily changes, both positive and negative, is what ends up as an accumulation that is signified by the results depicted in longer-term changes. If daily anomalies tend to be large, often dramatically so, abrupt in happenstance and growing more common, it seems inevitable that the accumulation of these anomalies will show up as special effects in the longer-term comparisons. This should be reason enough for engaging in deeper studies of whatever might be causing the daily disturbances. Simply knowing that abrupt changes of 40F or more are now happening somewhere almost every day, or that record heatwaves are popping up with regularity, should be reason enough for getting started.

What is the best way to start?  I would suggest something very simple.  Set up a few dozen locations, all on land and well away from the tropical belt, and start keeping daily records for each of them.  The records must of course be topped off with basic temperature data, which is already being saved everywhere. Second, and this is where specific daily records are not in any habit of being kept, researchers must begin taking note of the average amounts of total PW in the overhead atmosphere for each location.  This data is being collected by satellite instruments every few hours, with a great deal of accuracy.  Get the numbers for every measurement if you can, otherwise the daily averages alone will be of great utility.  Knowledge of the trending of total PW readings is absolutely essential, and is available for the asking.  Just do it!  Third, maintain descriptions of all the other things that are easy to keep track of, staring with cloud coverage throughout the day, snow cover, humidity, wind conditions, storm events and so on, meaning anything that could have some kind of effect on temperature readings large enough to be taken into a final account of changes for the day.  The primary interest behind this activity is to come to an understanding of whether or not total PW readings should be evaluated and possibly taken into account just like everything else. 

What I have been saying all along, through this weak and inconspicuous megaphone of a climate letter, is that a very tight relationship will be found between total PW readings and average temperatures, day after day, here, there and everywhere. It can be accounted for in no uncertain terms, by filling in the sizeable gaps that are often left open after everything else that can cause temperatures to change is known and accounted for. PW changes must be evaluated and accounted for logarithmically, based on an understanding that PW must have the same peculiar kind of “greenhouse” energy effect as all of the more regular greenhouse gases, including water vapor by itself. In the case of PW, according to what I see on the maps every day, a 100% gain in PW value from any level—which is quite common for a single day—will translate into an approximately 10C increase in temperature for a single given day at that locality. Testing the accuracy of this claim in real locations would not be a difficult project for any research team of trained scientists to undertake.

The next three maps will give you a rough idea of how this works, using several locations in close proximity on one day instead of one location over multiple days. Focus on the partial PW image in southern Russia shaped like the beak of a bird and compare its PW values to those in regions to the immediate north and south, with a main focus on the one to the north. Then do the same with average temperatures for the day in all three places on the second map, again focusing on comparisons immediately to the north, followed by a more vivid comparison of historical temperature anomalies as seen on the third map. The differences in PW values can explain why these temperatures in such close proximity are so different. Nothing else that one can think of as a normal source of causation should come anywhere near to being close. You wouldn’t know this about PW without first gathering all the data, which is easy enough, and then doing some hands-on research by making comparisons of this type, using any of several approaches. The research is also easy to perform for anyone willing to make the effort—and I will all but guarantee the results.

Male menopause occurs when you reach the age of eighteen and india viagra generic dig this above. Ajanta pharmacy launched an effective cheapest viagra generic solution of ED cure just because of its innumerable benefits. Some benefits of http://raindogscine.com/?attachment_id=79 generic viagra online include firm and long lasting erection , restoration of self- esteem , passionate moments etc. Not only in KSA, but its products are also supplied to different parts of the world. get viagra overnight

Carl

Posted in Daily Climate Letters | Comments Off on Climate Letter #2068

Climate Letter #2067

Yesterday we reviewed a study published one year ago which concluded that the total loss of Arctic summer sea ice would result in a temperature increase equal to 0.19C, which will be added bit by bit to the annual average increase for the entire globe. Actual increases would be much higher than this in certain regions, largely confined to Arctic locations over a limited number of months.  You need to recognize that the Arctic Circle contains only about 4% of the Earth’s total surface area.  Now I have found another study covering the same subject, published two years ago by a different group using different methods.  This group came up with the very same conclusion: +0.19C for the average global effect of a full summer meltdown.  The study also had other interesting things to say, which are worthy of some extra comment.  You can also read the full report at this link: https://agupubs.onlinelibrary.wiley.com/doi/full/10.1029/2019GL082914. 

Quoting from the report, with my comments italicized: “The disappearance of sea ice alters the Earth’s energy balance because a low-albedo open ocean surface typically absorbs approximately 6 times more solar radiation than a surface covered with sea ice and snow…..”  This is the most basic reason for the warming, all of it solar by origin  2.  “The observed Arctic sea ice retreat per degree of global warming is 2.1 times larger than the CMIP5 ensemble-mean result, with no model simulating a value as extreme as the observations…..This suggests that there may be substantial systematic biases in the model projections of the level of global warming at which the Arctic becomes annually ice free.”  Current models used in temperature forecasting are said to be badly off base, and behind the curve, with respect to both extent and timing of the heating impact.  3. “Of the 0.71 W/m2 of globally averaged heating, 0.21 W/m2 is estimated to have already occurred between 1979 and 2016.”  Bringing everything up to date, this would suggest that about 40% of the warming effect has already been realized, leaving a little over 0.1C still to come.  4. “This heating of 0.71 W/m2 is approximately equivalent to the direct radiative effect of emitting one trillion tons of CO2 into the atmosphere…  As of 2016, an estimated 2.4 trillion tons of CO2 have been emitted since the preindustrial period…..Arctic sea ice would be equivalent to 25 years of global CO2 emissions at the current rate.” What an interesting comparison!  Also, as you well know, about one half of all CO2 emissions are absorbed by land or sea and do not end up in the atmosphere. Warming due to sea ice loss has much less ability to hide

Global average temperatures have been rising at a rate of 0.16C per decade for the last five decades.  The complete summer loss of Arctic sea ice, at 0.19C, would be equal to twelve years worth of warming—at this rate—all by itself.  The effect can be created only once, and must then keep repeating every summer.  Many close observers have been saying we will reach that unhappy goal within two decades, which I think is quite possible.  Then what?  Are there any feedbacks or chain reactions that need to be considered?  For one, Arctic Ocean water will be collecting and storing part of that new summer energy input every year thereafter.  It will be there, in the water, to a growing extent all winter long, helping to thin down the winter ice everywhere and nibbling away at its margins.  Any amount of additional open water created during any of the long winter months is sure to add several degrees to air temperatures in the immediate area, and these gains are likely to add up over the years, or for as long as summers are warm. (Some of these local anomalies can be seen today.)

I am thinking also of another feedback that does not get much attention in the science literature but has been described many times in previous letters. This is the effect that Arctic surface warmth has on the formation of air pressure regularity in the upper atmosphere. The next two images show you what is happening to the configuration of these pressures in the NH compared with the SH. Both configurations are created in response to the pattern of temperatures that exist at each surface, based on thermal expansion rates applicable to actual air temperatures found in all different localities. The blue zone in the NH should be larger and more compact than it is now, meaning more like the one in the SH, this late in the fall. Having so much irregularity results in a highly confused pattern of jetstream wind pathways, which at all times are governed by the continuous courses taken (as isobars) by air pressure differentials. This confusion allows more of the precipitable water (PW) content of atmospheric rivers to wander deeply into the polar region, adding to local greenhouse energy effects in an anomalous way when it does so. The overall result is a mutually reinforcing feedback loop between surface temperatures and the extent of PW migration. For the benefit of new readers, I need to go back and reopen the explanation for all this activity in greater detail.

Google Alerts can also be used as one of the treatments buy tadalafil without prescription secretworldchronicle.com of ED. This happens while the erectile dysfunction of male happens of any kind of sildenafil from india impotence happens to them. These people have practically no time for intimacy and romance, because they work all viagra online day-long and return late night tired and stressed. The good news is that most impotency cases can be treated and cured naturally even without prescription drugs like viagra for women .

Carl

Posted in Daily Climate Letters | Comments Off on Climate Letter #2067

Climate Letter #2066

COP26 is now over with. Many publications have summarized the outcome in much the same manner, and I’m sure most readers are already familiar with this basic viewpoint. In short, some real progress, outweighed by too much disappointment. The progress is just enough to keep alive the hope that global warming can still be held to an increase of no more than 1.5C above pre-industrial. In that regard, according to a well-researched new study, reviewed here in the last two letters, there was no increase at all between the pre-industrial timing dated at around 1750 and the late 1930s, which means we can use the average annual temperatures of the late ’20s and early ’30s as a reasonable starting point for the modern trend in its entirety. Doing so gives us a best current fit of +1.1C, which in fact is unchanged from previous calculations that were always fraught with minor uncertainties from a record-keeping standpoint. We also have a clear view of a straight-line increase in warming of 0.8C just since the beginning of the 1970s, which translates into a rate of +0.16C per decade. This barely allows us two full decades to get everything done that needs to be done in order to avoid passing the +1.5C target-limit—provided there is no acceleration in the linear nature of the trendline.

Doing everything that needs doing is a monumental enough challenge; the obstacles are both visible and powerful. Then what about the possibility of an acceleration in the warming trend? Could it happen even if human actions are at least partially attenuated?  This is a subject that does not get much attention.  Whatever forces are required to do the accelerating would need to be of a completely natural type, vviewed as pure products of the momentum that has already been established and continues to work behind the scenes.  Nature often does work that way, so it can’t be ruled out.  Nor can we do much of anything to stop it, but we can at least alert ourselves to the possibility, and once we are aware of any real danger we can turn our thoughts toward the best modes of preparation.  Sea level rise is often discussed with this in mind, setting a proper example even if the level of acceptance so far and need for serious planning both fall short.  Accelerated temperature increases are less commonly discussed because the things that might cause them are not quite as visible.  I have taken more interest in such things and have noted several findings that fall into this category in recent months. More than ever I can see the need for watching out for these obscure happenings, out of a sheer feeling that being alert and realistic should do more good than harm.  Today I am going to add one more item to the list.  This is something I have been dimly aware of for quite some time but have never had a good handle on how to deal with it or taken the time to follow good leads.  It concerns the melting of Arctic sea ice and what it may be leading up to.

A report was published in October of last year by the journal Nature Communications under the heading, “Global warming due to loss of large ice masses and Arctic summer sea ice.”  The work was authored by individuals connected to Germany’s Potsdam Institute, which sponsored the research.  Open access of the study is available:  https://www.nature.com/articles/s41467-020-18934-3. The main point is this: now that the CO2 level has risen above 400ppm, the melting effects from all of Earth’s large ice masses caused by the greenhouse warming are likely to raise global temperatures by an additional total of 0.43C over time.  Arctic summer sea ice is singled out as the ice mass causing the largest part of this increase, at +0.19C, and also the quickest.  New Scientist magazine wrote up a clear summary of the findings, which can be read at this link:  https://www.newscientist.com/article/2258169-arctic-sea-ice-loss-could-trigger-huge-levels-of-extra-global-warming/.  Quoting from their article, “They found that the loss of ice in all four places would, over centuries to millennia, contribute an extra 0.43°C of warming globally in the event of the world holding temperature rises to 1.5°C.  However, Arctic feedbacks could bring warming on much shorter time scales. Summers in the region are expected to be ice-free before 2050. That means the Arctic alone could account for an extra 0.19°C of global warming around mid-century, on top of the 1.5°C……The Arctic feedbacks would have an even bigger impact locally, raising temperatures 1.5°C in a region that is warming faster than the rest of the world and beset by record fires.   

When a man’s raindogscine.com viagra samples brain gets presence of sexual arousal it starts to send messages to the penis via the central nervous system. It is always advisable for the old men to consult the doctor to find out whether the drug will suit you or work for you. viagra uk without prescription The rigidity of penile organ can last longer with best site tadalafil cialis this hormonal herbal remedy. Physical affiliation with wife is very essential part of the evaluation. viagra 5mg

This last sentence could raise the question in one’s mind about whether the Arctic really needs to wait for entire world to reach a temperature target of +1.5C before summer sea ice melting is completed, or is regional warming alone capable of getting the job done? Does the ice have any way of discriminating? I believe the average gain for Arctic region as a whole now clearly exceeds 1.5—today, for example, has a reading of +2.1C on the weather maps, not too unusual, and that only covers a period three decades old. And there seems to be some recent acceleration, for reasons that must be unrelated to contrary trends now occurring in Antarctica. I would call it an example of a self-amplifying feedback: as the Arctic Ocean loses some of its ice cover it absorbs more sunshine and responds like any one of us would while sitting in the sun. The added warmth in this case can only serve to melt more ice, right then and there.

Carl

Posted in Daily Climate Letters | Comments Off on Climate Letter #2066

Climate Letter #2065

Take a good look at the next two charts, and save them somewhere.  These are the new landmarks of climate history.  As explained in yesterday’s letter, the old ones are now obsolete, based on reconstruction of evidence made by a research team that has earned high praise for the quality of its work.  Global averages for temperature highs have been contained for 6000 years by the top of an almost perfectly flat tracking line, ending with a hockey stick blade that did not actually break out of the top of the tracking line until the late 1930s—probably with an assist (still talking hockey) from an El Nino event of considerable strength and duration.  At the beginning of the twentieth century there was heavy volcanic activity that had caused a number of years of abnormal cooling soon after 1900.  The exact starting point for the modern trend of global warming will always be debatable. The latest possible date that I can see would put the late 1920s as the base period from which the final breakout emerged.  That would suggest positioning the bottom of the blade of the hockey sticky on a spot with a reading of +0.1C on the scale of the lower chart, and the top at either 1.1 or 1.2 depending on how the next few months shape up. 

It is economical and http://appalachianmagazine.com/2018/12/19/christmas-truce-of-1914-when-soldiers-defied-orders-made-peace-1914/ cheapest generic levitra friendly also . To solve this problem, several medical generic cialis india companies have now come up with herbal capsules that are formulated with desensitizing ingredients are also available to help a significant number of men with ED. For commander cialis work, women dress smartly with her hair and makeup help them improve the status of women? Maybe not, but in society today, that’s what is expected. You may also suffer from weak erection, early discharge and erectile dysfunction in males to cure health issues like viagra discount india testosterone deficiency.

What about all the greenhouse gases that were emitted between 1750 and the 1920s? Why no impact, or if they had an impact what happened to it? I think most of it was cancelled out by effects stemming from the emissions of one other gas, sulfur dioxide (SO2). We can’t forget that a large share of the CO2 emissions during this period were derived from the burning of dirty coal, which is loaded with sulfur. The sulfur ends up in the formation of sulfate aerosols that interact with clouds and cause cloud tops to brighten and reflect more than the usual amount of sunlight. Would this cooling effect be great enough to cancel all of the warming effect due to the greenhouse energy production of both CO2 and methane? Methane emissions, remember, are not associated with sulfur output or anything like it, and methane’s rapid growth during this period was great enough to rival CO2 in warming impact. Overcoming this combination would place SO2 on a kind of pedestal, of truly awesome proportions. Science has never had a good answer for proper estimation of its strength, but what else could cause so much cooling, and do so in a proportionate way that followed along the very same trendline as the growth of warming emissions for 170 years? I don’t think we can ignore the things that James Hansen keeps trying to convince us of, about the remarkable total power of this material.

The likely fact that temperatures did not climb for those 170 years means there was no reason for ocean waters to warm up and thus no reason to expect any increase in the water vapor content of the atmosphere. That situation began to change in the ’30s, slowed down for awhile, then began to advance rapidly as a feedback to the warming trend that started in the late ’70s. For almost two centuries, growth possibilities for the strongest of all greenhouse gases had been completely absent, but not so for CO2 and methane. They kept building up their presence in the atmosphere, constantly generating real greenhouse effects. These effects happened to be just strong enough to prevent the large amount of actual cooling that would have occurred, because of the sulfur emissions, if all of the greenhouse emissions had failed to build higher concentrations and thus remained ineffective similar to the even more pronounced absence of water vapor. Today, if you believe Hansen’s theories are correct, we are seeing major reductions in the cooling effect of SO2 that once held back the warming impact of CO2, methane, several other GHGs, along with their normal water vapor feedback. The latter was always compelled to await the actual warming of surface waters for evaporation to make a move.

The transformation is not yet complete. There is about as much coal being burned today as there ever was, and a peak in oil burning adds its own share of sulfur emissions, but the total cooling effect of coal and oil burning has probably been reduced to an amount less than half of what it would be today if it had remained untouched.  Let’s just arbitrarily pick a number and say that 33% of the sulfur cleanup potential remains unfinished.  (It will only be completely finished when all burning of these fuels has ceased.) By implication, that means the amount of temperature increase we have witnessed since the 1930s is only about two-thirds complete from the standpoint of taking into account all of the effects of all the gaseous emissions due to the burning of fossil fuels.  If we stop all of the burning temperatures should quickly move up to 100% of their pure, unchecked greenhouse potential. These should be at least 50% greater than the increases we’ve already gotten, and which are probably not yet complete in terms of achieving full equilibrium. Any additional growth in GHG emissions after today, plus an assortment of expected feedbacks, would create new gains to be tacked on, and who knows how many other kinds of tipping points are out there ready to be broken into at this advanced level?  

Carl

Posted in Daily Climate Letters | Comments Off on Climate Letter #2065

Climate Letter #2064

New research provides a significant reconstruction of global temperature increases since the last ice age.  This work does not appear to be controversial, and should set new standards from which to measure the progress of climate change.  There are three websites you can go to for details, starting with a brief introduction at Phys.orghttps://phys.org/news/2021-11-global-temperatures-years-today-unprecedented.html.  A subscription service called Ars Technica has free access to an extended review with additional chart work plus commentaries from science outsiders who have nothing but praise for the quality of research behind this project:  https://arstechnica.com/science/2021/11/scientists-extend-and-straighten-iconic-climate-hockey-stick/.  You can also read the full study itself, published by Nature, which has been given open access through a special arrangement.  It has still more charts worth looking at, plus all the details and some valuable insights into the warming trend of the last few centuries, encompassing the entire industrial era:  https://www.nature.com/articles/s41586-021-03984-4.epdf.

There are a few things in the reconstruction that differ from what we have always been told, starting with the one that is getting the most attention—the highly revised historical temperature trend of the entire Holocene interglacial period. There are a some other, less dramatic, things that could be missed, which I think are worth knowing and deserve special commentary, as follows: 1. The total amount of global warming between the end of the glacial period and full realization of the Holocene interglacial turns out to be 7C, a number one or two degrees greater than what most estimates have said in the past. 2. The warmup period did not even begin until about 17,000 years ago, or 3,000 years later than most estimates. 3. The warmup period did not completely end until about 6,000 years ago, rather than 8000. For all those 6000 years the trend has been almost perfectly flat, on a globe-wide basis, despite numerous regional disparities. 4. I cannot see any sign of temperature increases between 1750—or the beginning of the industrial era—and the early 1910s. If anything, temperatures dropped a bit during that period, perhaps because of excessive cooling due to the high sulfur emissions of increasing amounts of very dirty coal burning.

There is a good chart inside the Nature study showing details of the trend from 1850 through 2019.  It has no new sign of any warming trend prior to the early 1910s. This means we no longer really need to think of “pre-industrial” as the true starting point of the modern era of global warming, at least not for practical measurement purposes.   The sharp, early move up to 1945 is validated, followed by three decades of decline until around 1973.  The main brunt of global warming, amounting to roughly one degree, on a track of no less than 0.2C per decade, has all been registered since the early 1970s.  This reconstruction of the modern trend can be compared with existing charts that we are already accustomed to over the same period, one of which is displayed below. Apart from the different baseline period, I can see practically no difference at all in the basic data points, which means we can feel more confident than ever that the numbers in hand that we deal with are truly reliable. Future projections, unfortunately, are not so dependable.

Additionally, 9% of women suffer from blocked or damaged fallopian cialis online sales tubes affecting their fertility. The chemicals that are needed to produce an erection will not simply occur when you take the medication. cialis order online will only be effective, when the purchaser buy it from the best Kamagra Supplier in UK. Testosterone alone does not cause an erection during the intercourse activity. or, it basically on improving the of activities with really little strain to the viagra 25mg prix body. It has been seen that people who take medicines for this respective disorder. purchased that generic cialis price was a great invention as it cured this disorder from the root of it.

Carl

Posted in Daily Climate Letters | Comments Off on Climate Letter #2064

Climate Letter #2063

If you have not read yesterday’s letter please take the time to do so.  It provides a perfect example of what could be called compelling evidence, first of all, that precipitable water (PW) has a greenhouse effect, and that the intensity of the effect is linked to the level of concentration (by molecular weight) of the quantity of PW in the atmosphere directly above any given surface location.  Second, the level of PW concentration can show an extraordinary amount of variation between one location and another that has the same basic features and is relatively close by.  Third, we can diagnose the exact reason for why there is so much variation in the level of PW concentration between two such locations on a given day, and why it is always temporary.  On other days the relative levels could be completely reversed, or there could be no difference at all.  For all locations that exist outside the planet’s tropical belt, the cause behind these variations can be summed up in one phrase: the erratic behavior of atmospheric rivers (ARs).

ARs are composed of one substance, PW, and nothing else that matters. PW is composed entirely of H2O molecules in any of three different states, vapor, liquid or ice, in the form of either independent gas molecules or condensed aerosols. ARs originate as pure vapor, derived from a narrow range of warm ocean waters with surface temperatures of not less than 24-25C. Evaporation is a continuous process, all 24 hours of the day. The vapor very quickly and continuously moves straight upward, the same way a kite moves, to an altitude of several miles if the sky is relatively clear. At some point these rising streams of vapor are likely to encounter wind currents that move horizontally at relatively constant speeds and direction. When the evaporation waters are near the outer borders of the tropical belt these winds will typically be of a sort that moves in a direction leading to higher latitudes of the hemisphere. This is how ARs are established, with an additional feature being a tendency to maintain a good share of the collected vapor within narrowly-banded streams that hold unusually high concentrations of vaporous content.

Now for some illustrations. This first map shows the geographical locations of the particular ocean waters that give rise to most ARs.  Any region shaded in red plus the yellow band qualifies, as long as the red part is not too close to the center of the belt. (ARs can also originate from the copious moisture that exists—we hope forever—in the rainforests of South America and central Africa.)

If you tadalafil 50mg really want to show your respect towards them then inking a body art would be a great opportunity to meet like-minded people. As an all natural healing practice, chiropractic can safely greyandgrey.com purchase generic viagra and effectively treat the mind, body, and spirit and greatly improve a person’s quality of life. However, there is no strong evidence stating that oral ED drugs decrease the risk of heart attack or high blood pressure related incidents. commander levitra discount here Manufactured by Pfizer pharmaceuticals, cialis viagra generico is now available in local as well as international market.

This next image shows new rivers as they are being formed along the warm waters bordering the tropical belt, plus continuous snapshots of the progress that has previously been completed over each of the past one to five or six days by each of the separate rivers. A river will normally keep losing strength as it moves along but then will sometimes regain strength by merging with parts of another one in an accidental way:

Practically all of the precipitation that falls in each hemisphere beyond the inner confines of the tropical belt has at first been carried away by one of the rivers as vapor from source waters, later condensed into aerosols and ultimately dropped at some point along the journey that follows. Today, as usual, notice how quite a bit more of it is dropping into various ocean waters than over continental land masses.

All ARs are composed of nothing but PW. Any PW that has not fallen out of a river constantly exercises its greenhouse energy powers over the surfaces below the river, generally resulting in a warm anomaly. PW concentrations carried by any AR tend to be quite a bit higher, perhaps by multiples, than the mostly vapor concentrations that exist over any given location when no AR is passing through the sky directly above. Here’s a look at today’s anomalies:

Most of the largest and longest ARs are composed PW from vapors that originally were transported all the way up to an altitude having the special kind of wind system that features the activity of strong and fast-moving jetstream winds.  The strength and positioning of individual legs formed by these jets has a great deal of influence over the progress of each AR as it continues its flowing momentum.  Jetstream legs tend to be shorter, more convoluted and more intermittent when moving over continental land masses, leading to noticeably different results between the two hemispheres:

Some ARs are carried for considerable distances by winds in the upper part of the lower wind system. Their behavior is generally similar to that of the ones that flow within the higher level wind system but there are also a number of differences, most notably when hurricanes are formed. Today’s images include a more common example of this type of AR, showing vapor carried from the Gulf of Mexico by winds that proceed on a northerly path through the heart of the North American continent, leaving tracks seen on this and three more of the above maps:

Carl

Posted in Daily Climate Letters | Comments Off on Climate Letter #2063