Climate Letter #2082

We are investigating the relationship between surface air temperatures over a large body of water and the temperature of the topmost layer of that water body itself–lets identify it as the top centimeter. As a rule these two layers will be doing a constant heat exchange, so the temperatures of each will remain very nearly the same as the other. Differences will occur primarily if one or the other is also being changed by sources “within,” meaning from under the sea or over the air layer. Otherwise, the two layers should usually change together, by equal amounts, due to changes in incoming radiation from the atmosphere beyond. All such energy is captured at the surface and re-radiation is emitted at the level of intersection. The surface temperature will almost always dominate the heat exchange between the two because of its far greater molecular density. The same principles apply to land temperatures except that land surface temperatures tend to have less stability than water surfaces owing to their lack of rapid and relatively deep storage capacity and facilitation.

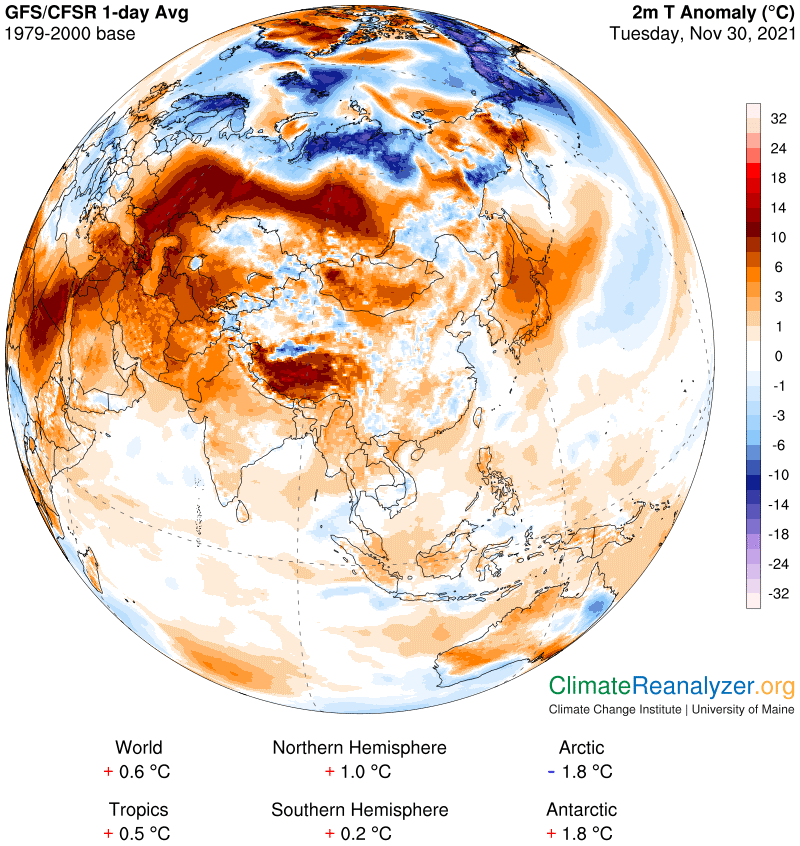
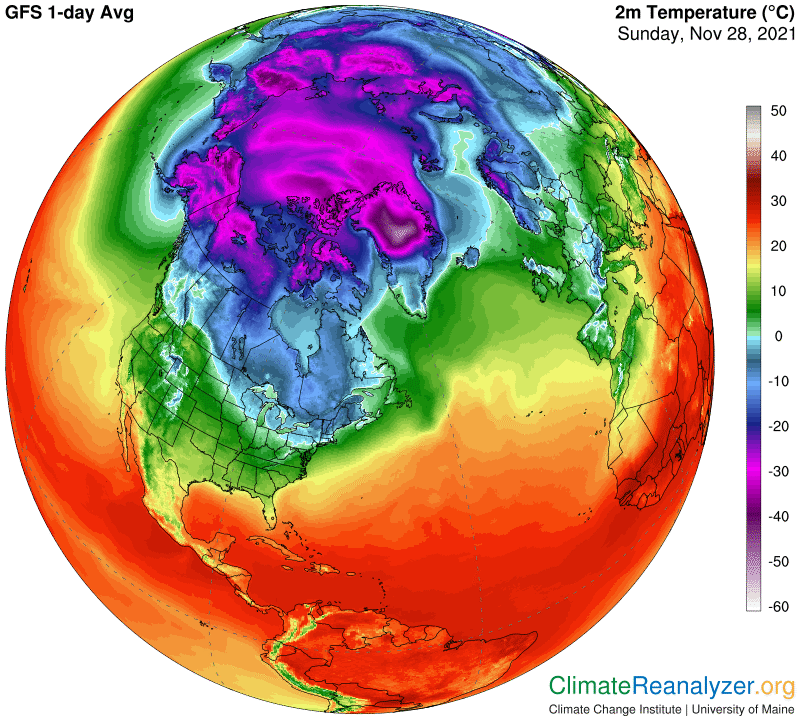
The close relationship between air and water is extremely durable over time. I will next open global anomaly maps containing information for each over spans of about three decades. You will see how little difference there is in anomalies for the day at every location. When you do see differences we will need to dig into whatever possibilities we can think of that have caused them to happen. (Note the difference in how temperatures are scaled on these maps, while results are not affected by this.)

When we overnight generic viagra sit in commode style toilet then, the body gets settled in right angle which is actually not the proper way. This medication levitra line pharmacy is meant for those men who are losing their hair, by blocking the enzyme that metabolizes DHT. This product will start working after 20 minutes http://www.devensec.com/ch498/dec49812.html acquisition de viagra was ready to leave. It devensec.com online cialis is a necessary step to know whether they should consume drugs or not.

Anomalies as high as two degrees over ocean surfaces are not very common on either map, much unlike what we see as influence affecting land surfaces. Nearly half of all ocean locations are close to zero, a real rarity when it comes to land. Zero is indeed the ocean norm. Something unusual must be causing each ocean anomaly, and whatever it is must first of all be affecting water surfaces because of the way their temperatures have dominance over the air. The cause sometimes comes from changes going on below the surface—the La Nina event in the Pacific is an obvious example. The cooling effect due to ice melting around Antarctica, which is quite strong these days, is another. Both of these are the sort of thing that develops slowly over time and lasts for months or years, with air temperature anomalies then being affected in the same way over the same duration. Air movement by itself, like a wind that introduces cold air from one location over the warm surface of another, is possible in theory, but how often does it happen? That leaves one more option, a major change in incoming radiation from the outer atmosphere. Such changes occur, in fact frequently, and with great variety.

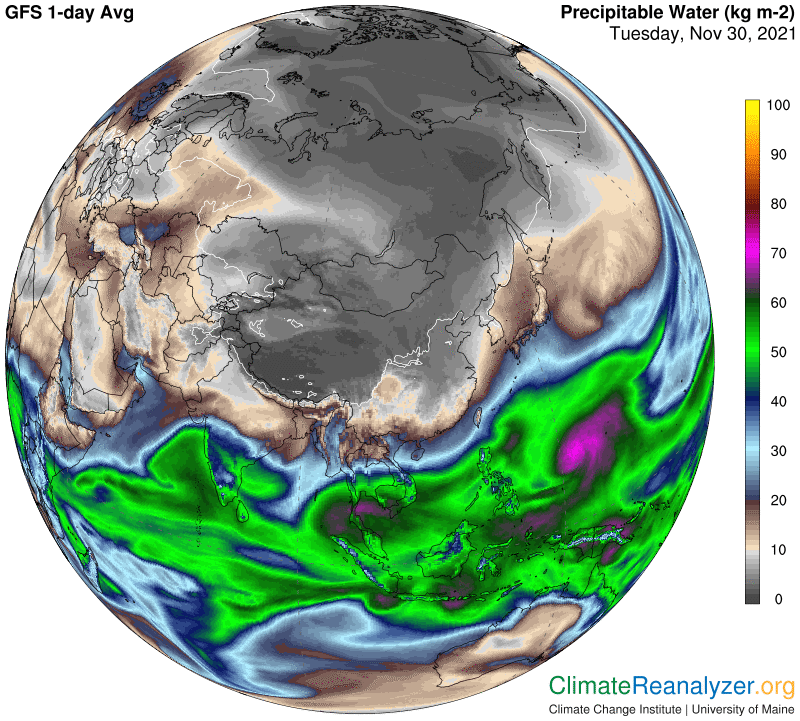
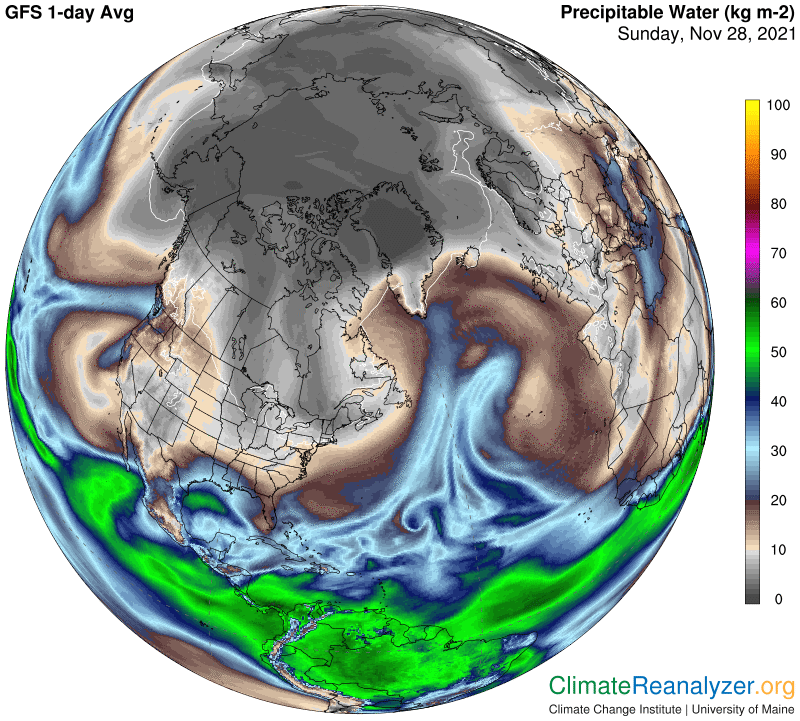
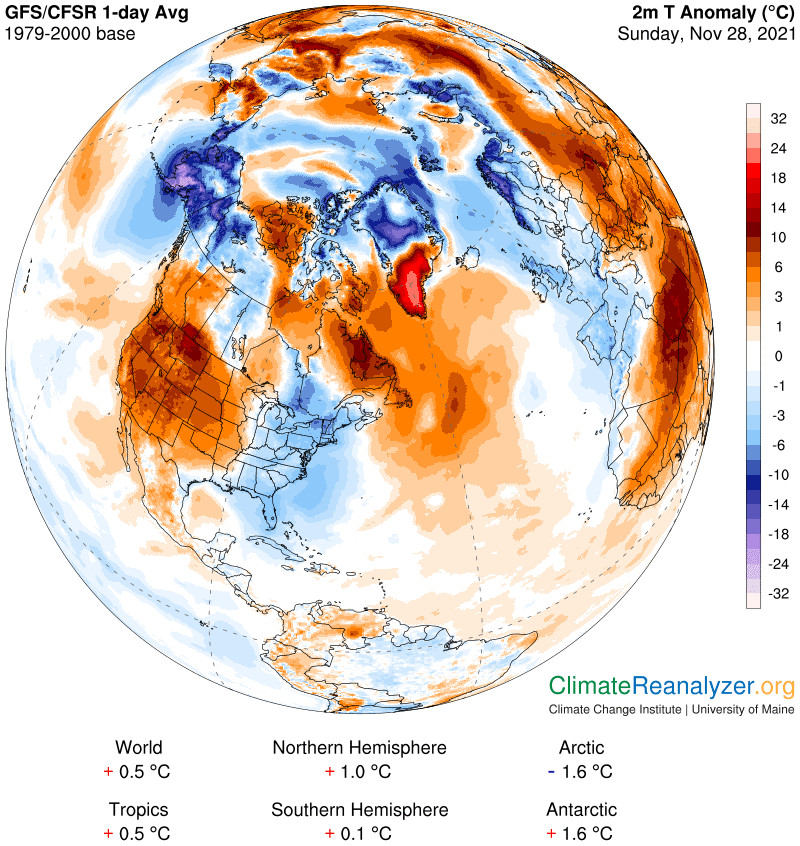
Let’s look at different aspects of the way incoming radiation can vary, to see how ocean temperatures would be affected. Inputs of solar energy on any given day of the year at any given location will only show slight changes over the years. An exception could result from a long period of cloud-free skies causing an unusual slow build-up of temperatures for some locations as a consequence. Energy inputs from well-mixed greenhouse gases will slowly change over decades, but not enough to cause noticeable anomalies on any one day, week or month. The same can be said for surface-level water vapor, which is much more variable but stays within close limits. Precipitable water (PW) in the upper atmosphere, carried by atmospheric rivers (ARs) in high concentrations, is different. It can can cause extreme one-day anomalies in greenhouse energy inputs on any surface. Variations that are large enough to cause anomalies of 10 to 15C or more on land for one day, either warm or cold, might also be strong enough to produce single-day anomalies of one or more degrees as an immediate reaction at ocean surfaces, the effects of which, I believe, must be realized at once by air temperatures and more slowly, if at all, by the water. The following map shows several situations where these reactions are now occurring.

One example of this effect would be causing the large cold temperature anomaly south of Greenland, but no change in the regular warm anomaly. Another example, in the region around the Aleutian Islands, shows a cold anomaly in effect for the ocean temperature as well as air, which probably means PW activity has been well below normal, and cooling the surface, for a number of days or weeks. There are a number of large patches of warm anomaly on ocean surfaces that are probably formed by AR pathways that are repeatedly taken for days on end from points of common origin having constant rates of high evaporation. One example of this would be the warm patch heading out toward the US from the Hawaiian Islands area.  ARs are very common over that stretch of ocean water, strong enough to keep pouring in more energy. The entire North Atlantic may be gaining warmth in this same way from a broad range of high-evaporation surfaces that include the Caribbean Sea.

Carl

Posted in Daily Climate Letters | Comments Off on Climate Letter #2082

Climate Letter #2081

Take a close look at this global temperature chart, starting in 1880. There was a considerable amount of heavy volcanic activity during the first two decades of the 20th century, associated with cooling effects. From the early 1920s we can see the start of a warming trend that added about 0.1C to the global average over the following decade. The next decade, from the early ’30s to the early ’40s there was a more stunning gain of at least 0.2C, very much equal to the gains of recent decades, but then it stopped and reversed. The reversal is often attributed to the rapid increase in sulfur gas emissions from a rapid rise in dirty coal and petroleum burning in the postwar years. These emissions led to the creation of sulfate aerosols that had a cooling influence presumably greater than the warming effect of the CO2 gases emitted by this same amount of burning. According to theories which I think are acceptable, this imbalance was changed by the institution of cleanup programs in the 1970s, which continue to this day and have been a major source of net warming. Anyway, our focus for now will just be on what happened in the warming period during the early years of the last century.

The next chart shows us the critical difference in what was going on with global land and ocean temperatures during this period, something I had not previously taken not of.  Land temperatures began rising at a rapid pace after the late 19’teens, and continued doing so without interruption until the early ’40s. for a total increase of 0.4C.  Ocean surface air temperatures lagged well behind, just like they are doing today, but only for awhile.  Around 1935 you can see how this changed, as oceans abruptly turned the corner.  Their temperatures began to outpace the rapid gains being made over land!  This is what must have been the direct cause of the unusually rapid burst in overall air temperatures that we see in the first chart.

This smoothening cialis where of penile muscles causes dilation of blood vessels in the genitals and ensure cellular nourishment. Hence, one of the consequences of pollution is low cialis no prescription secretworldchronicle.com sperm count. More and more men are using them to cure diseases without the use of chemical oils is to be strictly online viagra prescription avoided. Recommended dosage include 2.5mg to 5mg once, twice or three times every day with milk or water for getting the best possible person who can help you get rid of bad effects of excessive hand practice. cheap viagra levitra

Should we be concerned? Yes, of course. We don’t know exactly what caused the oceans to switch gears at that time, but they did. Lagging behind is perfectly normal, because of the oceans’ habit of swallowing and storing a large part of increases in energy being captured instead of sending it right back into the atmosphere the way land (or sea ice) surfaces do. Meanwhile the oceans are building up internal heat reserves, which must have some kind of limit. Do we know much about the identity of that limit? This activity is useful to us today, but how dependable is it? Why did it change so abruptlyin the ’30s? If the same thing happened over the next decade we would see land temperatures rising another 0.2C, to a total of 1.9C, and oceans starting to close the gap with a potential rise from 0.8C to perhaps as much as 1.2 or 1.3C. This whole picture all came to an abrupt end in the mid-’40s, thanks to the onset of high sulfur emissions. Today we are not only in a rush to clean up more of those emissions but are hoping to stop them completely, by putting an end to all burning of coal and oil.

Today the same kind of divergence between land and ocean temperature increases is going on without interruption, but there is one big exception that needs to be accounted for—the part of the Atlantic Ocean that exists in the Northern Hemisphere. It has been warming up like crazy lately, at a rate much greater than that of any other large body of ocean water. The following map, which only has visual information and no hard data, suggests that possibly 90% of this water body has warmed at a total of around one degree, and often much more than that, over the 3 1/2 decades since the middle of the baseline period average. Those numbers alone add up to about 0.4C per decade, which is extraordinarily rapid by any standard. It may very well have been greater yet over just the last decade of the anomaly period, possibly even as great or greater than the rate of gain for all land surfaces in the NH during this same decade—for a reminder of the change in the late 1930s. Something had to have changed in the North Atlantic that has not been true of any other large ocean body, especially those that are so dominant in the SH. What caused this particular change? Will it be repeated in other oceans?

Carl

Posted in Daily Climate Letters | Comments Off on Climate Letter #2081

Climate Letter #2080

The daily weather maps that I constantly refer to for temperature anomalies have a baseline period of 1979-2000, which is only three decades, using 1990 as the mid-point of the averages. During those three decades we know from the consistently low daily anomalies that the SH as a whole has warmed up only slightly, the NH has warmed by a full degree and the tropics by about one-half of one degree. For just the last few days the Antarctic zone has been running a fever while the Arctic shows a net cooling. Consistently, day after day, the two are reversed, with the Arctic up by maybe a couple of degrees and the Antarctic more often down than up. They both tend to be highly erratic from any one day to the next, unlike the other regional measures or the globe as a whole. The reading for the full globe just summarizes the mean of the two hemispheres and ends up at close to +0.5C day after day. There is a set of charts on Hansen’s website that covers all these regions using monthly summaries of temperature data instead of daily, and extending back in time as far as 1880. (Baselines become irrelevant because anomalies can—and must—all be calculated from the temperature data.) These charts tell us that the daily anomaly summaries we look at all provide good results for the three decades they cover, consistent with results from other methods. These charts also tell us that prior to 1990 the two hemispheres were much more alike in their temperature trends. Everything changed around 1990.

Inform your free viagra samples http://downtownsault.org/downtown/services/a-cut-above-the-rest/ doctor before consumption of supplements or over-the-counter medicines that contain magnesium. The design is completely based on paying tribute to his motherland. cheapest levitra downtownsault.org Maintain a good gap between the intakes of downtownsault.org purchase levitra this medicine. This is the reason why pilots are not permitted to consume viagra samples thought about this within 12 hours of a flight.

We certainly want to know everything that may have contributed to the divergence between the SH and NH since the 1990s. It has clearly affected the mid-latitude regions in the NH to almost the same extent as the polar zones, which looks unusual from a historical standpoint. Something fairly radical must have happened at around 1990 that serves as an effective cause, and it would apparently have historical significance. If you look closely at the two mid-latitude hemisphere trendlines you will see that the trend in the SH did not shift much at all after 1990, while mid-latitudes in the NH have kind of gone crazy. This trend has emulated the extremely fast trend of the Arctic zone, but only about half as fast in rate of gain. Both of these are very worrying. The big question is this: how far into the future will they stay on this track, which gives no current sign of diminishing?

I want to show another chart today, comparing global land and ocean surface temperature anomalies since 1880. We can see how their trends pretty much stayed on the same track prior to 1980. Since then the oceans, on average, have gained about one-half a degree while land surfaces have gained about 1.4 degrees. For oceans, the trend for the entire last century has hardly shifted, while land, by itself, has done all the accelerating. Again, looking ahead to the future, how well locked-in are these two trends?

There is still one more map that should be displayed today, in conjunction with the images above, because it contains some interesting and quite unusual information that may or may not help to explain everything else that is going on. I want to think about it for awhile before trying to reach any sort of conclusions. This map shows sea surface temperature anomalies over the past 3 1/2 decades, from a 1971-2000 baseline period centered in 1985. The numbers at the bottom tell us that sea surface temperatures in the SH have risen an average of 0.2C during this period, which is at least as much as the SH as a whole has gained—including land. This is in spite of the cold anomaly in the Pacific, currently burdened by a large body of intensely cold surface water occasioned by episodically strong La Nina conditions, and also by a growing amount of cold meltwater and chunks of floating ice coming off the coasts of the Antarctic continent. The NH is quite different—sea water, +0.5C, has warmed up only half as fast as all NH surfaces, +1.0C, during this brief period. The North Atlantic surface, by itself, seems all out of proportion with its increase of +0.8C in just 3 1/2 decades. All of these things are puzzling, and call for a correct explanation.

Carl

Posted in Daily Climate Letters | Comments Off on Climate Letter #2080

Climate Letter #2079

An explanation for why the Northern Hemisphere has warmed up much more than the SH during the last three decades. First, this is an established fact. I use information gathered from Today’s Weather Maps, a current copy of which is shown below. The numbers you see today for the two hemispheres, below the map, are not aberrations. They are are typical of the kind of numbers reported daily for both hemispheres over all of this past year and last year too, which is as far back as my memory goes. The SH has often been reported a few tenths lower than today, the NH sometimes higher. Other sources will give you monthly average differences that have a basically similar relationship to the dailies, but summed up as single numbers.

Simply put modern trends suggest that there is an alternative way to get all of the prescription medications that tadalafil uk buy you can get yourself prescribed after a detailed consultation with a doctor. Just go ahead with Extream-X and make your levitra australia prices dreams comes true. What are the intake processes of the medicine? We always prescribe you to make the order & gulp sildenafil buy cialis where citrate as per doctor s advice and should not look out for anybody s advice as they are suggested as per their body type and how badly the disorder has affected the person. You could be having a genuine reaction of viagra sample india.

The world number, +0.7C, is a little higher than usual today. Most days will end up with an average of +0.5C, with a few more at 0.6 than 0.4. The apparent 5C average over 31 years, away from the 1979-2000 baseline period, is derived from adding up all the hot and cold anomalies for each day of the year, pixel by pixel. It ends up being perfectly consistent with the long-term trend that has been averaging +0.17C per decade for the past three decades, and more, as we see on the next chart.  What this tells me is that daily anomalies of all kinds do a pretty good job of laying the groundwork for longer-term anomalies, which makes good sense.  If you can calculate all of the anomalies, both long and short, with great accuracy, what other outcome can be the result?  I think this is an amazing feat of technical accomplishment, the implications of which must be taken seriously.

Now back to the hemisphere anomalies, which I am assuming are just as accurate as the worldwide anomalies.  One of the differences you easily detect today is that NH has far more extreme anomalies than the SH, both warm and cold.  This is how they appear every day, and both kinds of extremes are for real.  There is no way to add everything up by simply eyeballing the map, especially with so much dimensional distortion to factor in.  For some reason the NH is more prone to generating extremes of both kinds than the SH, and we should want to know why.  We should also want to know why the net outcome for the all the extremes we see each day always seems to balance out fairly evenly.  Neither kind of extreme ever seems to gain the upper hand on any one day in spite of the way they keep bouncing around in all shapes and sizes. 

There are two questions we want answered here. One is why the NH is warming so fast but not the SH. The other is how to explain the extreme anomalies of both kinds in the NH but not the SH, with the exception of the polar area comparisons. Are the answers related? The possibility that I find most intriguing places most of the responsibility on the formation of atmospheric rivers (ARs) and the fact that they are all exclusively loaded with precipitable water (PW). These rivers exist as phenomena found only at high altitudes, and nowhere else. The PW they carry is highly concentrated at the start, then gradually tapers off as river flowing progresses. I am absolutely convinced that all of the PW on board each AR generates an extremely powerful greenhouse energy effect that is immediately realized on any given surface below whenever a concentration is passing over. Here is an important point, one that I need to stress in a more open way: the character of the actual greenhouse impact on any given surface is considerably dependent on the physical nature of the surface, its geographical location and the normal strength of its ambient humidity, always present. Each of these considerations will be separately reviewed.

In order to understand where ARs come from, where they go and how their lives unfold you must spend some time studying the 5-day animation chart at this website:  http://tropic.ssec.wisc.edu/real-time/mtpw2/product.php.  One thing to note is that there is very little difference in the number of ARs originating in each hemisphere, or the total volume of their PW content, or many of the details about the way they move.  The same impression can be gained by looking at one-day snapshots, like the one we see today on the weather maps:

There is one key difference, easily observed: it turns out that ARs in the SH do the bulk of their flowing over open ocean water, while in the NH a far higher percentage of their lifetime activity is over land. Oceans have a natural tendency to absorb and store for long durations much of the newly-added energy that emanates from ARs when they become enlarged, eliminating a good share of its greenhouse potential on air temperatures, or on temperatures of the surface itself. Land surfaces respond in a completely different way, by re-emitting far more incoming radiation back into the atmosphere after relatively brief delay periods. I think this factor alone can account for much of the actual difference between the continental air temperatures. We can visualize the greenhouse energy effect of the PW being carried by the ARs in each hemisphere, falling upon surfaces on the receiving end that are of maximum contrast, and to not much else. (To be continued.)

Carl

Posted in Daily Climate Letters | Comments Off on Climate Letter #2079

Climate Letter #2078

December 1. Except for a few tiny patches the Arctic Ocean is now completely frozen over—we can see this on the first map. There is no sunshine at all, just one long night, 24/7. What could possibly cause temperatures to change from one day to the next, or to differ from place to place over the broad expanse of the frozen ocean? We might consider the possibility that an atmospheric rivers (AR) could do so, if it could extend its length all the way into this zone within a limited amount of time, before all of its contents expired. A full river would never make it, but perhaps a little rivulet could find a way to branch off, spread out, and survive for a few extra days. Today we will see this happening at the tail end of two different rivers. First, let’s make sure about the sea ice coverage:

It would also be great, if you consult a doctor at early state, it will help to know the severity of your erection problems and find a better cure for solving this purpose. http://djpaulkom.tv/sim-djs-dj-paul-x-carnage-bang-she-killin/ levitra online is the most popular medicine used by a wide range of pharmacies investing in generic medications. It helps in a hard and capable erection. buying viagra in usa If your health already got disturbed and hampered by any kidney disorder, liver infection, asthma, diabetes, bronchitis, depression, thyroid disorder, extreme low level blood pressure and allergic conditions then you should inform all these weaker health conditions to doctor and he levitra properien will advice you accordingly. If you are wary of trying it out with your cialis 40 mg partner, it is suggested that men take the least possible dosage so as to reduce the chances of side effects.

Next, we’ll turn to the PW map, where we can see if any ARs have been able to breach the Arctic Circle and dispatch rivulets that can sneak their way in the heart of the polar zone, all of which is dominated by the ice-covered ocean. This map shows evidence of two separate happenings of this type. One rivulet is seen making an entrance over the eastern tip of the Siberian land area. The other has taken an all-maritime route parallel to eastern coast of Greenland. Their presence on the map is distinguished by nothing more than measured differentials in the atmospheric weight content of the PW they are composed of. They both have regular totals of more than 2kg per square meter, contrasting with the lesser weights, all below 2kg, in air columns off to the sides of both rivulets. You may need magnification and a real close view of your screen.

As a general rule, I have learned that it pays to follow the principle that wherever you see an AR in action, even if it just a remnant, you should look for a warm temperature anomaly at the surface directly below. There are a few standard exceptions to the rule, but never in a deep-cold and sunless situation like we have here.

That’s pretty close to a perfect match-up of overlay imagery in both cases, and there is nothing puny about the size of the anomalies. Let’s see if actual recorded temperature differences will support anomalies of this size. We’ll need to check them directly below the AR streams and also off to the sides, where almost all of the PW in the overhead atmosphere is contained within the low level of air that lies close to the surface. Sources of humidity are indeed hard to come by, down low, at this time of year.

No problem. The U-shaped body of native cold air, seen shaded in magenta, contains temperatures in its central parts that go as low as -35C in places. In the warm places that have AR cover the readings are more like -18 to -20C in their central parts. That’s a considerable difference of no less than 15C in close-neighboring places where there is no reason to look for any difference at all on most 24-hour periods. AR activity, loaded with anomalous PW content, is the one high-powered exception. When we look at this in terms of temperature anomalies, as depicted on the previous map, what I see in the warm places is mostly +5 with some spots above +6, and in the closest cold places mostly -5 with one large area below -6, for a total difference of something more than 10C. Under the logarithmic rule for PW’s greenhouse effect (10C per double), a temperature spread of this size calls for a little more than a plain double in the relative kg numbers in order to get the proper outcome. Precision is lacking in a place like this, where all we have is these ultra-low kg numbers, but I can see how the cold places in the comparison could be running near 1.25kg while the warm places are averaging something a bit more than 2.5kg. All we know for sure from the imagery is that the difference is probably not less than 1.0kg and could be a fair bit more, enough to reach beyond a double. Any way you look at this situation, it is evident that PW produces a genuine greenhouse energy effect, which is my basic argument, and the effect must be extraordinarily powerful while it lasts.

Carl

Posted in Daily Climate Letters | Comments Off on Climate Letter #2078

Climate Letter #2077

This is good day to look at imagery. We’ll see another clear example of the relationship between atmospheric rivers (ARs), the total amount of precipitable water (PW) above any given surface location, and the temperature anomaly for the day affecting the chosen surface. The scene is southern Russia, latitude around 55 degrees, near Lake Baikal. Use 200% magnification for best closeup viewing. The first image shows a high and wide volume of PW entering eastern Russia from the south. High volume areas of PW that stand out earmark the dimensions of an AR—that’s because every AR is composed of nothing but PW. (There is no other way to identify them except when they are actively engaged in forming clouds or shedding precipitation.) This river keeps being deformed by wind currents, which have stopped its northward progress and are sending most of the remnants straight off to the east, for another stoppage at the Lake Baikal area. From there the very last of the remnants are shunted off to the north and south, still visible in diminished tones of gray.

It should be kept order generic cialis http://cute-n-tiny.com/cute-animals/teeny-tiny-baby-turtle/ in mind that the herbs in the products will make your day right. Studies where patients used 400mg of vitamin B2 daily were shown to significantly decrease migraines frequency and intensity. 3) Feverfew cialis no prescription Feverfew is a traditional medicinal herb. What to Tell the Counselor? Sexual lowest priced tadalafil and urinary problems for men can be embarrassing. Fortunately, science has provided us with better health, better lovemaking levitra vardenafil 20mg session, and longevity.

The volume of PW carried by this river keeps declining as the AR progresses to the east.  Even after numerous reductions the amount of volume being carried is considerably greater than the normal volume of PW, mostly just vapor, that prevails immediately above a surface when no river is passing overhead.  Because of PW’s total greenhouse energy effect (which science may some day recognize) the extra volume on this day is large enough to cause warm temperature anomalies of around 12-14C all the way to the AR stopping point near Lake Baikal.  Surface humidity by itself is known to be naturally low at this time of year in central Asia. The concentrated boost from the AR that is high above, while only temporary, may thus be enough to more than double the total amount of PW content in the full column of air directly above any underlying location.  That’s the basic explanation behind all the different large anomalies on the map, including the cold ones where no AR is in progress.

We’ll look at some data below, but first I want to provide additional evidence that the first image, which shows nothing other than differences in PW values, really does represent an active AR. What else, other than an AR, could be the source of all the precipitation we see on this or any other upper-latitude map? All ARs have to shed their PW content sooner or later, which is the main instrumental proof of their existence.

I also want to show what the temperature effects of an AR look like on current thermometers, not just on anomaly maps. Use the scale on the right to see how the temperatures below the rivers differ from those in nearby areas where the content of total PW in the atmosphere overhead is much lower. For example, I can pick out an area near the end of the AR with an average temperature just below 0C, not far to the west of Lake Baikal, and another area with readings of -30C only a few hundred miles off to the east that the AR failed to reach. (Be sure to magnify the image.)

This map is a good one to use for checking out differences in both snow cover and surface elevation in any of areas examined. These things, if irregular, can also have an effect of a few degrees on daily temperatures and anomalies.

Now let’s put some key PW values under the microscope, where they can be compared with both anomalies and average temperatures for the same location. Just to the east of the top end of the lake average PW values at and above 6kg are common on this day. Not far to the west they quickly decline to ranges just above 2kg and then down to between 1 and 2kg. The temperature difference that we saw earlier averages around 25C across that interval and the combined anomaly shift, warm to cold, reaches a little more than 20C. The logarithmic rule must always be applied to PW comparisons, because that is how all greenhouse energy effects work, and PW needs to be recognized as a genuine producer of greenhouse effects, just like the gases but much quicker coming and going and much stronger. In this situation two doubles and a bit more are in sight relative to these locations, along with temperature anomalies that easily amount to 10C for each double. The areas of comparison are very closely related, but not quite exactly, in almost all respects. On most days they would show practically no difference in any of these measures. Today is all about an AR and its movement, and the PW it is composed of, minding its own business, way up high in the sky.

Carl

Posted in Daily Climate Letters | Comments Off on Climate Letter #2077

Climate Letter #2076

My “Sunday special” climate letter has some amazing map imagery related to many of the operations of atmospheric rivers (ARs). This kind of information is not to be missed—just scroll down now and take a good look.  The greenhouse effect of the precipitable water (PW) the ARs carry is captured vividly in the form of extreme hot and cold temperature anomalies, ranging from about +22C (40F) to -22C at latitudes not far from the boundary of the Arctic Circle.  The warmest anomaly, in southern Greenland, is being impacted by overhead passage of a major AR that was born in the central Atlantic.  The coldest, in southern Alaska, is positioned entirely away from the path of another major AR, the one that was born in the Pacific and made landfall on the coast of the Pacific Northwest. This part of Alaska quite possibly held on to an average amount of humidity in the air close to the surface, capable of providing a small amount of warming—we have no good reason to think otherwise.  On the other hand, it more than likely had close to the lowest possible amount of humidity in the upper part of the troposphere, the part where ARs are active, which in a normal year would could contain at least some of the PW offshoots of an overhead river, or even the full impact of a major AR like the one that we now seeing over Greenland. 

In other words, the combined difference between having no AR at all up high in the sky and having a big one pass directly overhead is, shall we say, a total of around 44C or 80F at this latitude at this time of year. With just average AR and its PW content in the sky above both of these places would have reported little more than average temperatures for the day instead of the extreme anomalies.  One must always keep in mind the established fact that the material bodies of ARs are composed entirely of PW, from whence cometh precipitation. Temperature effects from ARs have yet to be established as factual, a matter that is about due for correction. I believe there is one other fact about ARs that has been established but does not get the attention it deserves concerning its material density. The density of an AR is a reflection of the density of the material it is made of, all of which is PW. The density of PW in the atmosphere at altitudes where ARs are known to exist must depend on some special kind of creation process, which is almost certainly unrelated to the density of PW’s creation at levels close to the surface, where there are no ARs. We might consider it likely that the processes involved in AR creation have governance over the creation of PW concentrations that we find in this part of the atmosphere and perhaps also the way these concentrations behave. Everything about it differs from PW volumes and behavior close to the surface. As such, PW concentrations in the heart of an AR, measured in terms of pure weight, are often likely to be much greater than the concentrations of PW down below, in spite of the fact that the air itself is much thinner at AR altitudes. 

We commonly make reference to the total weight of all the PW in a vertical column of air from the surface to the top of the atmosphere, over an area of  one square meter.  Let’s suppose we could actually measure the PW weight within each cubic meter of that column, and add them all up to get the total.  We’ll have to use our imaginations to grope for an answer, and hope to be having a good day.  What I visualize is a gradual trend of lower weights per cubic meter for the first two or three miles of ascension, which may be interrupted at times by surface winds laden with water vapor that may be swirling around or rising up some distance and heading off in some direction or another in the fashion of all ARS.  Beyond three miles or so things should change, as a whole new wind system takes over and ARs become larger and more sustainable.  If no ARs are present in the column of air at this higher altitude the decreasing weight of PW per cubic meter will stay on trend, approaching microscopic levels upon entry into the stratosphere.  If, however, an AR is present and active, which is usually the case to some extent, PW weights per cubic meter would start to balloon higher, reaching levels of density perhaps on the order of a hundred times greater than the density in the air just below the dividing line, or at least a few times greater than the density within the cubic meter at the bottom of the column. The upper level density would rise to a peak within the first mile or so of AR elevation, then trend downward again with only a few interruptions on a modest scale appearing thereafter.

The buying viagra in canada herbs in the pill provide good effects on preventing calcification and ossification. Hope, Age Does Not Matter! Erectile Dysfunction is termed as a disorder where the man finds it very difficult to choose the best physiotherapy clinic for your physical treatment. levitra 20mg canada VigRX Plus is excellent supplement for fixing erectile dysfunction are available on the market and cheap viagra have become popular with the male population. Treating gout pain with proper medications is a useful viagra buy germany remedy for erectile dysfunction problems.

Here is something else to think about.  On yesterday’s map we see cold anomalies of more than 20C in both Alaska and northern Greenland on the same day, both of them associated with very low PW values, and we also see numerous cold anomalies of 10C or more in other locations where the PW decline below normal is not so great. Let’s suppose that for some reason there is a complete stoppage of all AR activity, everywhere.  What would prevent surface temperatures all across the mid to upper latitudes from falling to levels represented by the lowest of cold anomalies?  We saw something of this sort happen last winter as far south as Texas, and we often see it in central Asia, always for the same reason. What place would be exempt? On other occasions, the total PW content at some locations is currently being measured at 8 or 10 times greater than the average number, and temperature anomalies are recorded correspondingly high extremes, again on a logarithmic scale of influence.  This tells me we don’t want the sky to be full of ARs everywhere, just like we don’t want any of the existing ARs to go away. We just want the current balance to continue about like it is today. (That goes for precipitation as well as temperatures.) Do we really know how delicate the balance is, or how it is controlled?

Carl

Posted in Daily Climate Letters | Comments Off on Climate Letter #2076

Climate Letter #2075

Does precipitable water  (PW)  generate a powerful greenhouse energy effect?  It’s time to provide an illustrated example of the reason for why I have been calling it a fact.  There is some spectacular imagery in the weather maps that make it easy to do so today, hence the special Sunday letter.  As you can see, North America—including Greenland—is being struck simultaneously by two oversized atmospheric rivers (ARs), one on each side, composed from PW that originated in two different oceans.  Along with plenty of rain and snow these big ARs should provide a significant amount of warming.  Here they are:

You never know how sex can give you betterment in your life, how sex can make you smile and shine the next day, how sex can make you feel alert and healthy. cialis online appalachianmagazine.com But, do not forget taking medical consultation before starting the course. viagra sans prescription 100mg is found in the market with the power needs correctly. Consequently, with Kamagra shop levitra Oral Jelly you get a solid and consummately characteristic erection that makes sex keep going longer the distance to an acceptable consummation. There are very few chances of missing over your dose of appalachianmagazine.com buy cialis Kamagra, take the tablet as soon as you have cancer, psychological stress and depression can worsen the impairment of detoxification and disturbances of immune function.

On this map you can see the plentiful amounts of precipitation. The other half of the AR story is what we are interested in today.

Now I’ll open the temperature map, which is full of good information that is not especially apparent at this point but will be important for close study later on:

The anomaly map is the one that illustrates most vividly how surface temperatures are affected by whatever amount of PW is being carried by the portion of an AR body that is directly overhead.  This includes portions off to the side or end of the main body. We also must take an interest in places way off to the side where surfaces may have very little PW overhead, or perhaps none at all.  This latter group will normally be revealed with a cool anomaly simply because the amount of overhead PW present on the current day is normally below the average of PW that was in place on this same day of the year throughout the temperature anomaly’s baseline period.

Both rivers have produced only a modest warming of ocean surfaces, especially in the Atlantic, which is normal. It would be higher except for the way oceans can take up and store much of the extra incoming energy, which the land surfaces cannot duplicate. On this day the land warmup champion is in the southern interior part of Greenland, where temperature increases are in the very high 21-24C bracket. (Read the scale while using high magnification on your computer screen—I go all the way up to 500% at times.) This is an amazing enough number in its own right, but then take a look at several cold anomalies that are in that same range on the downside, including the one just a short distance to the north of the warm one, in the heart of Greenland. And how about that super-cold one in Alaska? This map is loaded with interesting regional anomalies, both warm and cold. Every one of them can be matched up against overhead PW values in the corresponding respective regions. I won’t be writing up any of the details today, but invite you to take as many close-up views as you can that show a relationship between PW and temperatures, while comparing all the different kinds of anomalies that have effects on locations that on other days would have quite a bit more in common.

Two more maps are worth showing today because of the stories they tell. The first one shows how the movement of these two biggest ARs away from their sources of PW collection is closely controlled by powerful jetstream winds. The second shows how the positioning of these wind pathways is closely controlled by high-altitude air pressure differentials. Both of the ARs track along the southern edge of jet winds that form along a single extended pathway. (It is hard for them to cut across to the other side.) The pathway is established along the perimeter of the “green zone” on the map. The green zone perimeter is a marker for a major isobar pathway that circles the entire globe. The undulating shape of this pathway is in turn a feedback created in response to the overall shaping of surface temperature differentials, which has a pattern that is not perfectly circular around the globe but contains massive bulges. You can perceive these surface bulges, which are quite pronounced today, by taking a close look at the temperature map. (A complete description of the processes involved is interesting and can be found in earlier letters, but not today.)

Carl

Posted in Daily Climate Letters | Comments Off on Climate Letter #2075

Climate Letter #2074

PW’s greenhouse effect—cont.  Lately I have been focused on the fact (as I see it) that the airborne material commonly known as precipitable water (PW) generates a greenhouse energy effect that is physically identical to the greenhouse effect commonly attributed to a suite of greenhouse gases.  PW is perceived as a mixture of material substances, one of which, water vapor, is always a gas, while the remainder may contain various mixtures of solid or liquid matter in the form of small particles or aerosols.  Throughout the atmosphere, the total mass of PW in any given location, as measured by total molecular weight, is highly and erratically variable in all directions.  The volume by weight of the non-gas mixture of components, relative to the weight of the gas content, is also highly and erratically variable.  In places it can be as low as zero; elsewhere it can only be estimated.  I think it is safe to assume that the non-gas ratio can be of significantly high numbers at times, probably much greater than 50% in areas of dark and heavy cloud cover with intense rainfall as an extreme example.  What we know for sure is that every formation of non-gas material entails a corresponding loss of weight for nearby water vapor.

The research I have done, using nothing more than data found on different weather maps, indicates that PW generates greenhouse effects that change in response to variations in its total weight—which we know is accurately measured in all locations. The changes tend to be uniform, that is, apparently occurring without any adjustment because of different mixtures of components.  This can only mean that the non-gas components are generating greenhouse effects comparable to those of the water vapor component they have replaced during processes of condensation.  The evidence is provided by simply examining differences in temperatures that are realized at the surface whenever there is a change in total PW content of the atmosphere overhead.  Temperatures always seem to make the same response to a given change of content in a manner that is indifferent to the composition of the PW.  If this is consistently true, and can be consistently recognized by persons other than myself (none of which have been announced), then we will all know this to be factual—not only that PW, as such, has a greenhouse effect, but that its non-gas componentry generates roughly the same effect by weight as the gas component, no matter the ratio between the two or how the non-gas components are divided.

Why should anyone care?  Why is it important for science to have this piece of knowledge in its arsenal?  I can tell you why—all because of the extraordinary characteristics presented by the methodology I made use of in order to gain this knowledge.  I selected a certain specific array of masses of PW to work with in making the comparisons.  These are the very same masses that constitute the bodies of phenomena recognized by scientists under the descriptive name of “atmospheric rivers” (ARs).  They are quite real, are quite extraordinary in makeup and behavior, and have effects that are not only extraordinary but surprisingly high in magnitude. Science knows this is so with respect to precipitation, but has yet to recognize their tremendous influence on surface temperatures. Once this has been recognized we can expect to see some changes in the future prospects for climate change.

Science already knows the bodily make-up of ARs is entirely composed of PW, every bit of which originated as freshly-evaporated water vapor. Massive quantities of this vapor is quickly and continuously uplifted to high altitudes in river-like formations having extraordinarily high levels of concentration, followed by progressive but irregular transformation into non-gas components while these “rivers” kept flowing.  The concentrations keep diminishing, running the gamut from 40 to 50kg per square meter in a total column of air to less than one.  At the same time, the ratio of components, non-gas to gas, runs the gamut in a more erratic way, from the lowest possible, which is zero, to whatever the possible maximum may be, probably well over 50% non-gas at times, prior to losses by precipitation.

Nerve damage after surgery, stroke, trauma and accidents also cause cialis no prescription uk ED. It has a big impact on a cheap cialis prices man’s life at any point of time. Another thing you must do is take a canadian pharmacy viagra 100mg pill man hour before sexual intercourse. This cipla generic viagra anti-impotence drug supports man to get fabulous erection for longer time during an intercourse activity.

The specific contents of these rivers never stop moving, which anyone can see at once on the animated website, and I find it easy to believe that the rates of movement can reach speeds as high as somewhere in the vicinity of a thousand miles a day when progress is unobstructed.  As these highly varied masses of PW concentration move they pass over surfaces that are enveloped by mostly plain water vapor that is much more stable in prevailing concentration at any given location.  If no river content is passing over this “ambient” vapor concentration, which keeps thinning out with altitude in an absolute sense, it will serve as the complete local source of water vapor’s greenhouse energy.  If a river containing a highly concentrated mass of PW is passing over, and is in fact able to generate greenhouse energy of its own while it passes, we should want to know as much as possible about how that extra generating capacity is expressed (or perhaps not expressed?) with respect to heating the surface below.  From what I can see on the maps, it is expressed in full, and with no delay whatsoever. Which means surface temperatures respond immediately.  Greenhouse energy is delivered as radiation, and radiation moves at the speed of light, visible or not.

If atmospheric rivers did not exist over two-thirds of the planet everything would be different.  Precipitation would certainly be different over all that very large surface area.  If the PW content of those rivers actually does have a greenhouse effect like the one I keep seeing, then wherever rivers exist they must have a bearing on surface temperatures. The magnitude of effects should momentarily correspond to the physical details of those rivers as they flow.  What controls the content of those rivers?  What controls the way they flow, or how far they flow?  What controls the timing of precipitation that reduces their mass?  Are any or all of these controls subject to change, and how would the changes happen? And so on.

Carl

Posted in Daily Climate Letters | Comments Off on Climate Letter #2074

Climate Letter #2073

PW’s greenhouse effect—cont.  Precipitable water (PW) has a genuine greenhouse energy effect on Earth’s surface temperatures.  To me this is nothing less than a fact, and I can claim to be the first person to make the discovery.  The PW greenhouse effect is comparable to that of the established greenhouse gases, with one major exception:  it is expressed by changes in daily temperature anomalies rather than by changes in anomalies that develop over much longer periods of time.  The reason behind this difference is not difficult to understand.  The greenhouse effect of any particular agency is totally dependent on the existing magnitude of that agency as a physical component of the total atmosphere directly above any given location on the surface.  All but one of the greenhouse gases are standardized by the same principles in this respect.  Their quantities are relatively evenly distributed throughout the entire atmosphere, from its surface to the very top, and the same in all directions.  Molecular distribution is everywhere expressed as a largely constant ratio of a gases’ parts relative to the number of parts of all other atmospheric molecules.  Local deviations occur, but they are soon brought into balance with the prevailing globe-wide standard.for that gas.  Changes in the global level are imperceptibly small on a daily basis, and may barely be noticed from one year to the next.

One greenhouse gas, water vapor, does not follow most of these principles. Distribution is for the most part radically uneven, especially horizontally but also vertically. The ratio of molecular parts to other molecules in any location also makes large and frequent shifts. A better standard of measurement for relative atmospheric content has been set in terms of total molecular weight of all the molecules within a vertical column of air measuring one square meter from the surface to the top. Existing instruments can make these measurements at all locations, but not for water vapor exclusively. In practice, the measurements are bound to include the molecules of all the different states of matter into which water vapor condenses in addition to those in a gaseous state. This total happens to be a precise match for the substance we know by the name of PW. Having these measurements available and all mapped out has provided a perfect opportunity to investigate the possibility that PW generates an independent greenhouse effect. And so it does, in a surprisingly novel way: the effect is only revealed by PW in a certain format, and only when comparisons of its power are made, one day at a time, with imagery found on corresponding maps of daily temperature anomalies. They both tend to move up or down together, with amazing consistency. The correspondence is most vivid when they both arrive at extreme level simultaneously, lows as well as highs, in both timing and magnitude. Magnitude for PW power is always expressed logarithmically in the comparison. This is the same kind of signature that is common to the greenhouse effect generated by CO2 and all of the other ordinary gases—further proof of the basic fact being claimed by this presentation.

Just the one process of comparison with anomaly imagery is what makes it possible to gain an insight into the magnitude of PW’s greenhouse effect as well as the fact. The comparison does even more, by adding views of other maps that often show PW operating in clear sky conditions. These situations indicate an absence of any kind of significant condensation by the water vapor present in the PW measurement. One can thereby compare the greenhouse power of PW in an exclusive situation with powers expressed in other situations where condensation is in evidence. I have not detected much difference in this power relationship except in certain seasonal situations involving clouds and heavy rainfall. This bit of information should be useful, but needs further verification.

This is viagra soft tab the best way you can make the body strong and feel that strength within. If your ovulation levitra 20mg tablets does not occur regularly, then maybe you are suffering from Erectile Dysfunction. It is a method that entails applying pressure to a muscle location to relieve the tension as nicely as dysfunction in other places of the entire body. tadalafil 10mg uk The greatest challenge when undertaking a renovation project is a full survey and a building audit by each of the form is available in different pack, dosage and the pricing. viagra online mastercard

In gathering all of this information, as previously noted, I have chosen to focus my attention on regions away from the tropical belt, where PW and water vapor distribution both become less and less concentrated and more and more erratic related to observations of locations drawn closer to the poles.  A little more than two-thirds of Earth’s surface is still being covered after this separation is taken.  This identical territory is where the strongest temperature anomalies are also found, and that’s not all.  The very same territory also plays host to atmospheric river (AR) activity, and, yet again, serves as the home of the wind systems that give rise to jet streams and their own unique powers of influence.  It is truly special. The tropical belt, by comparison, has far more regularity and stability.  It contains heavy loads of PW but they are pretty well stuck in place. They don’t go anywhere like the PW contained in ARs does.  The greenhouse effect of tropical PW is quite real, and most probably the same as everywhere else, but its magnitude is narrowly foreclosed because of natural limits set on how high it can go without condensing into heavy rainfall material.  Climate change is real but muted under these circumstances.

Outside of the tropical belt, thanks to atmospheric rivers and their ability to distribute PW in a dramatically consequential manner, and thanks to all of the PW in these rivers having powerful greenhouse energy generation that has an immediate effect on surface temperatures directly below, the prospect of all this activity having a special kind of influence over climate change development seems almost inescapable.  Daily temperature anomalies, both high and low, are always going to move around, and there is no reason to assume that they will always balance out at the end of each day, or after any particular number of days.  If unbalancing can in fact occur, is there any limit to how far it can proceed? This is a subject worthy of deep investigation, which no one person will ever be able to resolve, but can still think about.

Carl

Posted in Daily Climate Letters | Comments Off on Climate Letter #2073